Create your own


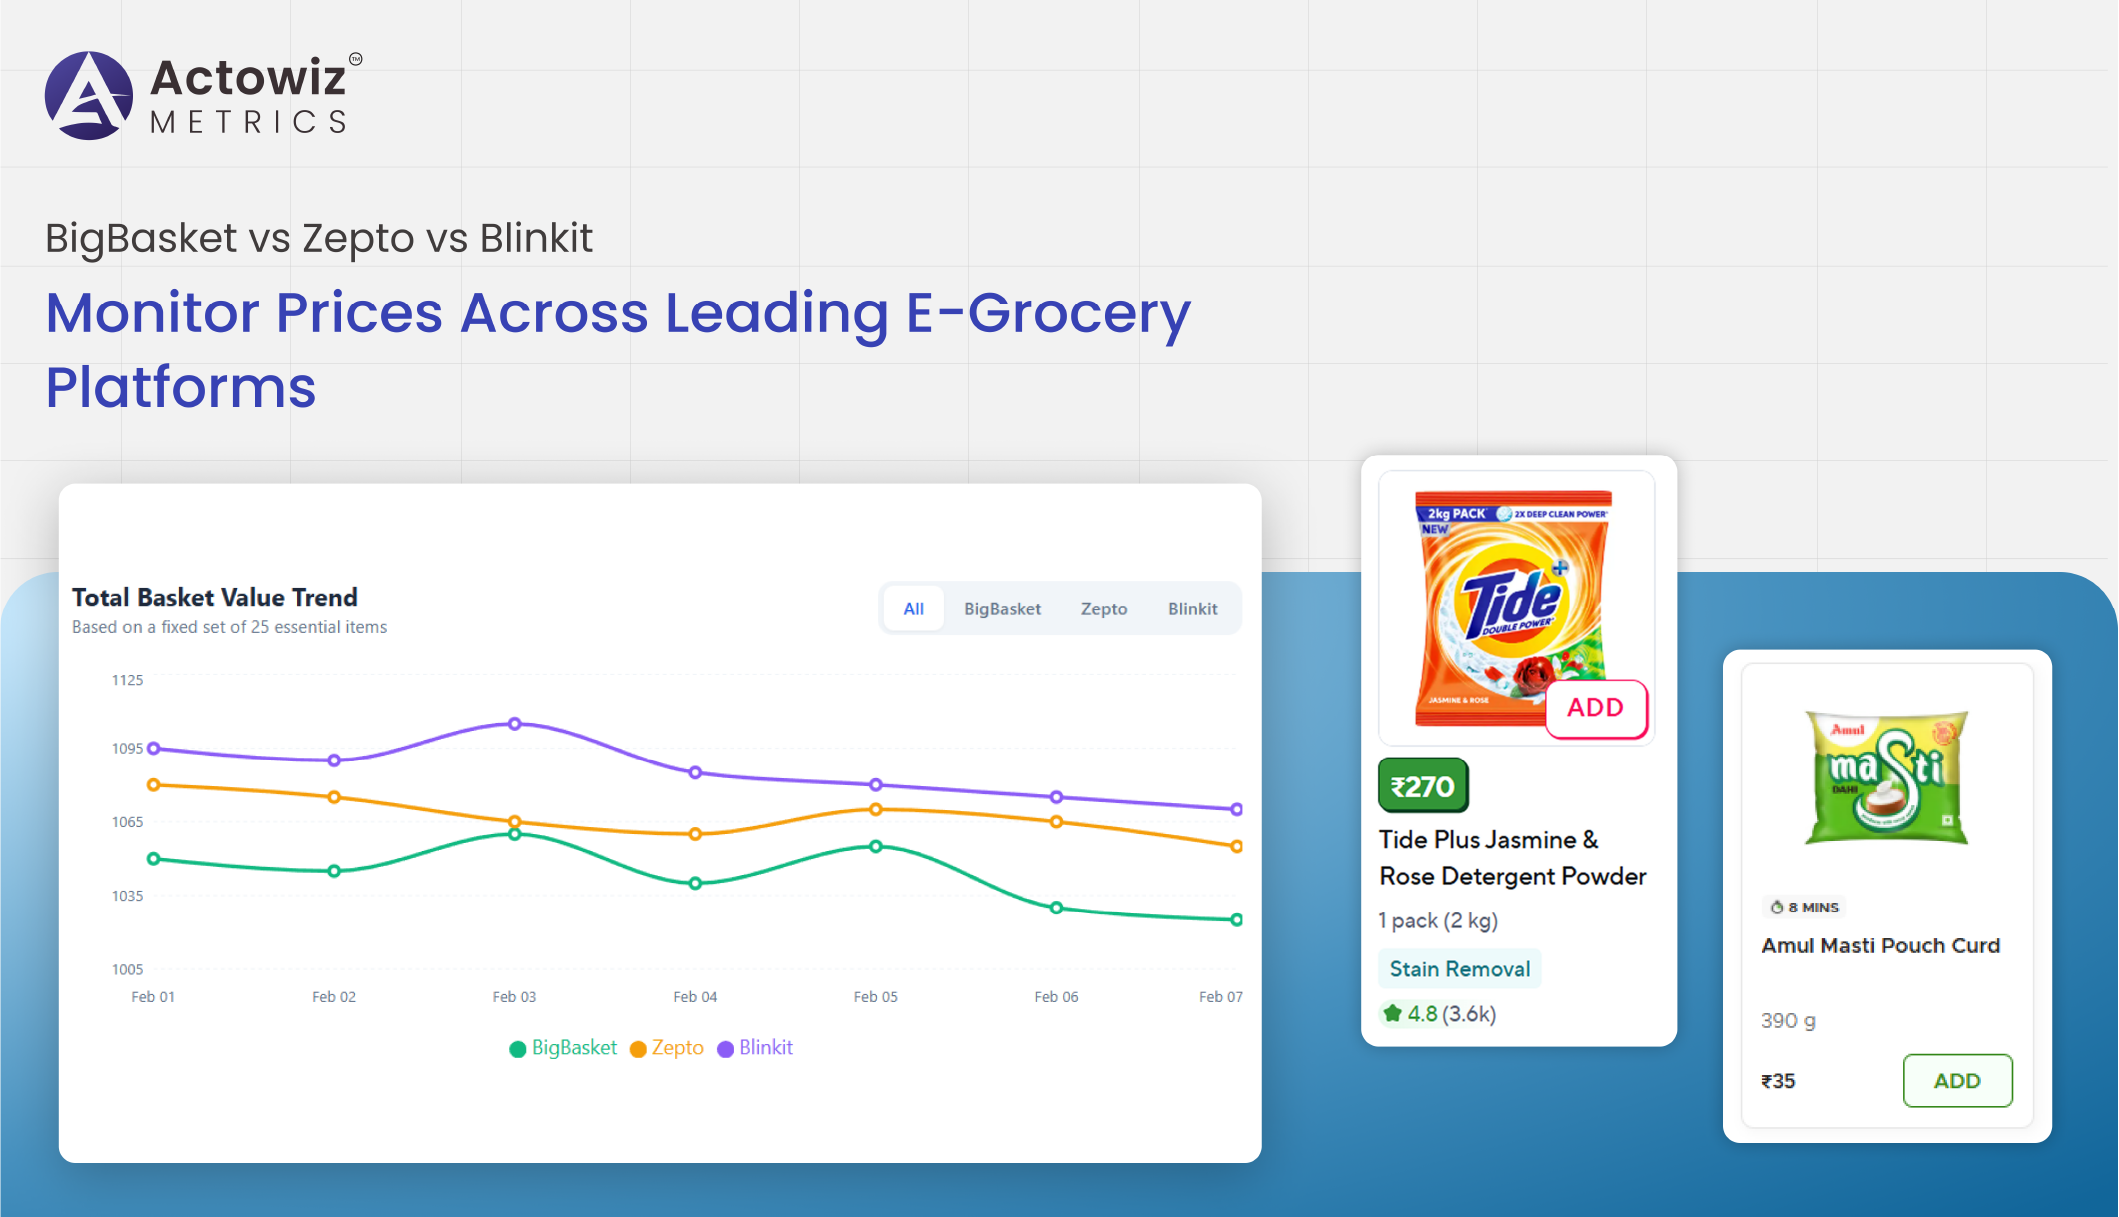
India’s online grocery market has expanded rapidly, with quick commerce platforms reshaping consumer buying behavior. Between 2020 and 2026, the e-grocery sector witnessed double-digit annual growth driven by urban demand, faster deliveries, and hyperlocal fulfillment models. For brands and retailers, the ability to Monitor Prices Across Leading E-Grocery Platforms has become essential to protect margins and remain competitive in dynamic markets.
Modern Grocery Analytics solutions enable businesses to track pricing fluctuations, promotional intensity, availability gaps, and category-level performance across major platforms. Without structured intelligence, brands risk overpricing, margin erosion, or losing digital shelf visibility.
From metro cities to tier-2 markets, grocery pricing differs significantly due to delivery zones, dark store availability, and localized competition. Data-driven monitoring empowers decision-makers to align strategies with market realities, optimize campaigns, and benchmark performance effectively. This blog explores how structured analytics across BigBasket, Zepto, and Blinkit drives smarter pricing, competitive benchmarking, and category leadership from 2020 to 2026.
The growth of quick commerce has intensified platform rivalry. Leveraging BigBasket vs Zepto vs Blinkit Price Data Scraping, businesses gain structured visibility into SKU-level price differences, discount depth, and assortment strategies. This data supports advanced Digital Shelf Analytics, helping brands measure online visibility and pricing competitiveness.
| Year | BigBasket (%) | Zepto (%) | Blinkit (%) |
|---|---|---|---|
| 2020 | 48 | 5 | 22 |
| 2021 | 45 | 9 | 25 |
| 2022 | 41 | 15 | 28 |
| 2023 | 38 | 20 | 30 |
| 2024 | 36 | 23 | 32 |
| 2025 | 34 | 25 | 33 |
| 2026 | 32 | 27 | 35 |
As Blinkit and Zepto expanded aggressively after 2022, pricing wars intensified. Discount frequency increased by nearly 30% between 2022 and 2025. Brands tracking shelf position and price variations could identify where undercutting strategies were strongest.
Digital shelf monitoring also reveals assortment gaps. For example, a leading FMCG brand observed 12% higher SKU visibility on one platform versus others, influencing marketing spend allocation.
Data scraping combined with shelf analytics ensures brands maintain competitive positioning across evolving quick commerce ecosystems.
To stay competitive, brands must Extract BigBasket vs Zepto vs Blinkit Price Data systematically. Structured extraction enables accurate Price Benchmarking across cities and product categories.
| Year | Avg Discount (%) |
|---|---|
| 2020 | 12 |
| 2021 | 15 |
| 2022 | 18 |
| 2023 | 21 |
| 2024 | 23 |
| 2025 | 25 |
| 2026 | 27 |
Discount depth nearly doubled over six years, especially in staples and packaged foods. Without benchmarking tools, brands struggle to respond quickly.
Price benchmarking helps identify:
For instance, metro markets often showed deeper discounts compared to tier-2 cities, with variations up to 8%. Such insights help optimize pricing strategy and promotional budgets effectively.
Structured extraction enables dynamic comparisons that support strategic decisions across procurement, marketing, and retail operations.
Retailers often need to Compare Grocery Prices Across BigBasket ,Zepto & Blinkit to understand competitive positioning. This comparison supports deeper Brand Competition Analysis, revealing how rivals adjust pricing across categories.
| Category | Avg Price Gap (%) |
|---|---|
| Staples | 6 |
| Dairy | 5 |
| Snacks | 9 |
| Beverages | 8 |
| Personal Care | 7 |
Snack and beverage categories show the highest pricing variability, driven by promotional bundling strategies. Competitive comparison also highlights where private labels undercut national brands by 10–15%.
By analyzing structured platform data, brands can adjust margins while preserving market share. For example, one FMCG manufacturer reduced price disparities by 4% across platforms, leading to a 6% increase in conversion rates.
Platform comparison ensures brands remain visible, competitive, and aligned with evolving consumer preferences.
In quick commerce, delays in monitoring can result in lost revenue. Implementing Real-Time Grocery Price Monitoring BigBasket ,Zepto & Blinkit ensures continuous updates. Combined with advanced Product Data Tracking, brands can monitor stock levels, discounts, and assortment changes instantly.
| Year | Orders (Billions) |
|---|---|
| 2020 | 0.9 |
| 2021 | 1.2 |
| 2022 | 1.6 |
| 2023 | 2.1 |
| 2024 | 2.6 |
| 2025 | 3.1 |
| 2026 | 3.8 |
As order volumes quadrupled between 2020 and 2026, price volatility increased significantly. Real-time monitoring reduces response time to pricing discrepancies by nearly 40%.
Continuous tracking supports:
Real-time intelligence ensures brands remain proactive rather than reactive in highly competitive grocery markets.
Brands aiming to Track BigBasket vs Zepto vs Blinkit Grocery Data across regions gain hyperlocal intelligence. City-level and zone-level analysis uncovers demand shifts and pricing patterns.
| City Tier | Avg Price Variation (%) |
|---|---|
| Metro | 7 |
| Tier 1 | 6 |
| Tier 2 | 9 |
| Tier 3 | 11 |
Tier-2 and Tier-3 cities show higher price variation due to supply chain and competition differences. Hyperlocal tracking allows brands to adjust logistics, pricing tiers, and promotional strategies accordingly.
Tracking grocery data also identifies emerging demand pockets. For example, rapid quick commerce expansion in smaller cities resulted in 18% higher SKU additions year-over-year.
Hyperlocal insights strengthen market penetration strategies and improve distribution efficiency.
Understanding top-performing brands is crucial for growth. Through BigBasket Bestselling Grocery Brands Analytics, companies can identify high-performing SKUs, seasonal leaders, and promotional winners.
| Category | Growth (%) |
|---|---|
| Organic Foods | 38 |
| Ready-to-Eat | 42 |
| Beverages | 35 |
| Dairy Alternatives | 40 |
Bestselling analytics reveal that ready-to-eat products saw over 40% growth, influenced by urban demand and quick commerce adoption. Brands leveraging bestseller insights improved placement and optimized supply chain alignment.
Bestseller tracking also helps evaluate competitor momentum and promotional impact, enabling strategic decisions backed by structured data.
Actowiz Metrics delivers advanced analytics and competitive intelligence solutions tailored to e-grocery ecosystems. With specialized Zepto Bestselling Grocery Brands Analytics, businesses gain deep visibility into category leaders and SKU performance trends.
The platform enables enterprises to Monitor Prices Across Leading E-Grocery Platforms with structured data extraction, automated updates, and scalable dashboards. From pricing discrepancies to competitive benchmarking, Actowiz Metrics ensures reliable insights delivered in real time.
By integrating multi-platform data into centralized dashboards, brands improve pricing decisions, optimize promotions, and enhance competitive positioning. The solution is scalable, secure, and adaptable to rapidly evolving quick commerce landscapes.
In today’s competitive grocery landscape, brands must Monitor Prices Across Leading E-Grocery Platforms consistently to protect margins and maintain digital shelf leadership. Structured analytics combined with Blinkit Bestselling Grocery Brands Analytics empowers businesses to track pricing shifts, bestselling trends, and competitive movements across markets.
From benchmarking and real-time tracking to hyperlocal insights and bestseller intelligence, data-driven strategies deliver measurable growth advantages. Companies that invest in automated monitoring systems respond faster to market changes and outperform competitors in both pricing accuracy and brand visibility.
Ready to transform your grocery intelligence strategy? Partner with Actowiz Metrics today and gain real-time competitive advantage across every major e-grocery platform.

Whatever your project size is, we will handle it well with all the standards fulfilled! We are here to give 100% satisfaction.
Any analytics feature you need — we provide it
24/7 global support
Real-time analytics dashboard
Full data transparency at every stage
Customized solutions to achieve your data analysis goals