Amazon.com Bestselling Apple Products Analytics
Explore Amazon.com Bestselling Apple Products Analytics to gain strategic insights into the most in-demand Apple products across multiple categories. When you scrape Amazon.com Bestselling Apple Products Data, you unlock data-driven intelligence on customer preferences, price points, and market positioning. With over 250+ Apple products spread across 10+ categories such as smartphones, tablets, accessories, and wearables, this dataset is ideal for tech sellers, resellers, and researchers. The average price for bestselling Apple items on Amazon hovers around $499, reflecting the brand's premium positioning. Most of these products maintain an average ranking of 4.5 stars, indicating strong customer satisfaction and reliability. Use Amazon Bestselling Apple product insights to identify trends like which iPhone models are topping charts, what accessories are selling fastest, and how AirPods, MacBooks, and iPads are performing. Leverage this powerful data to optimize inventory, pricing, and marketing strategies in the competitive electronics category.
Get Started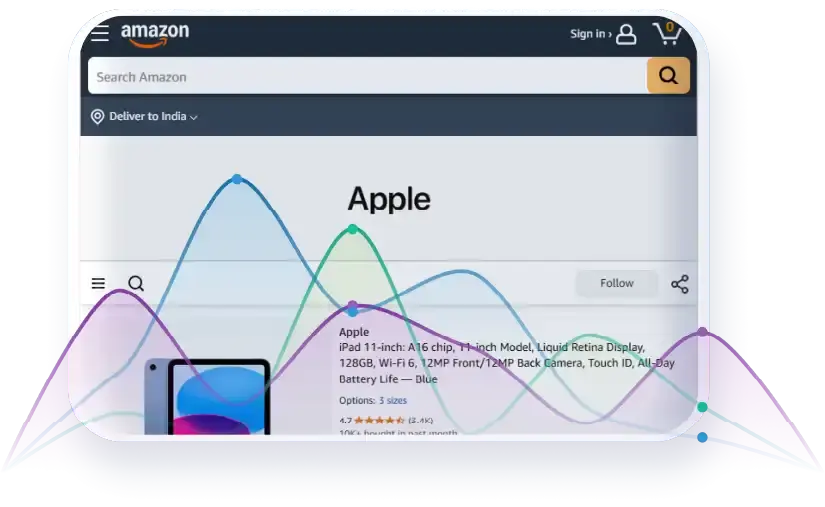


.png)
.png)