Create your own


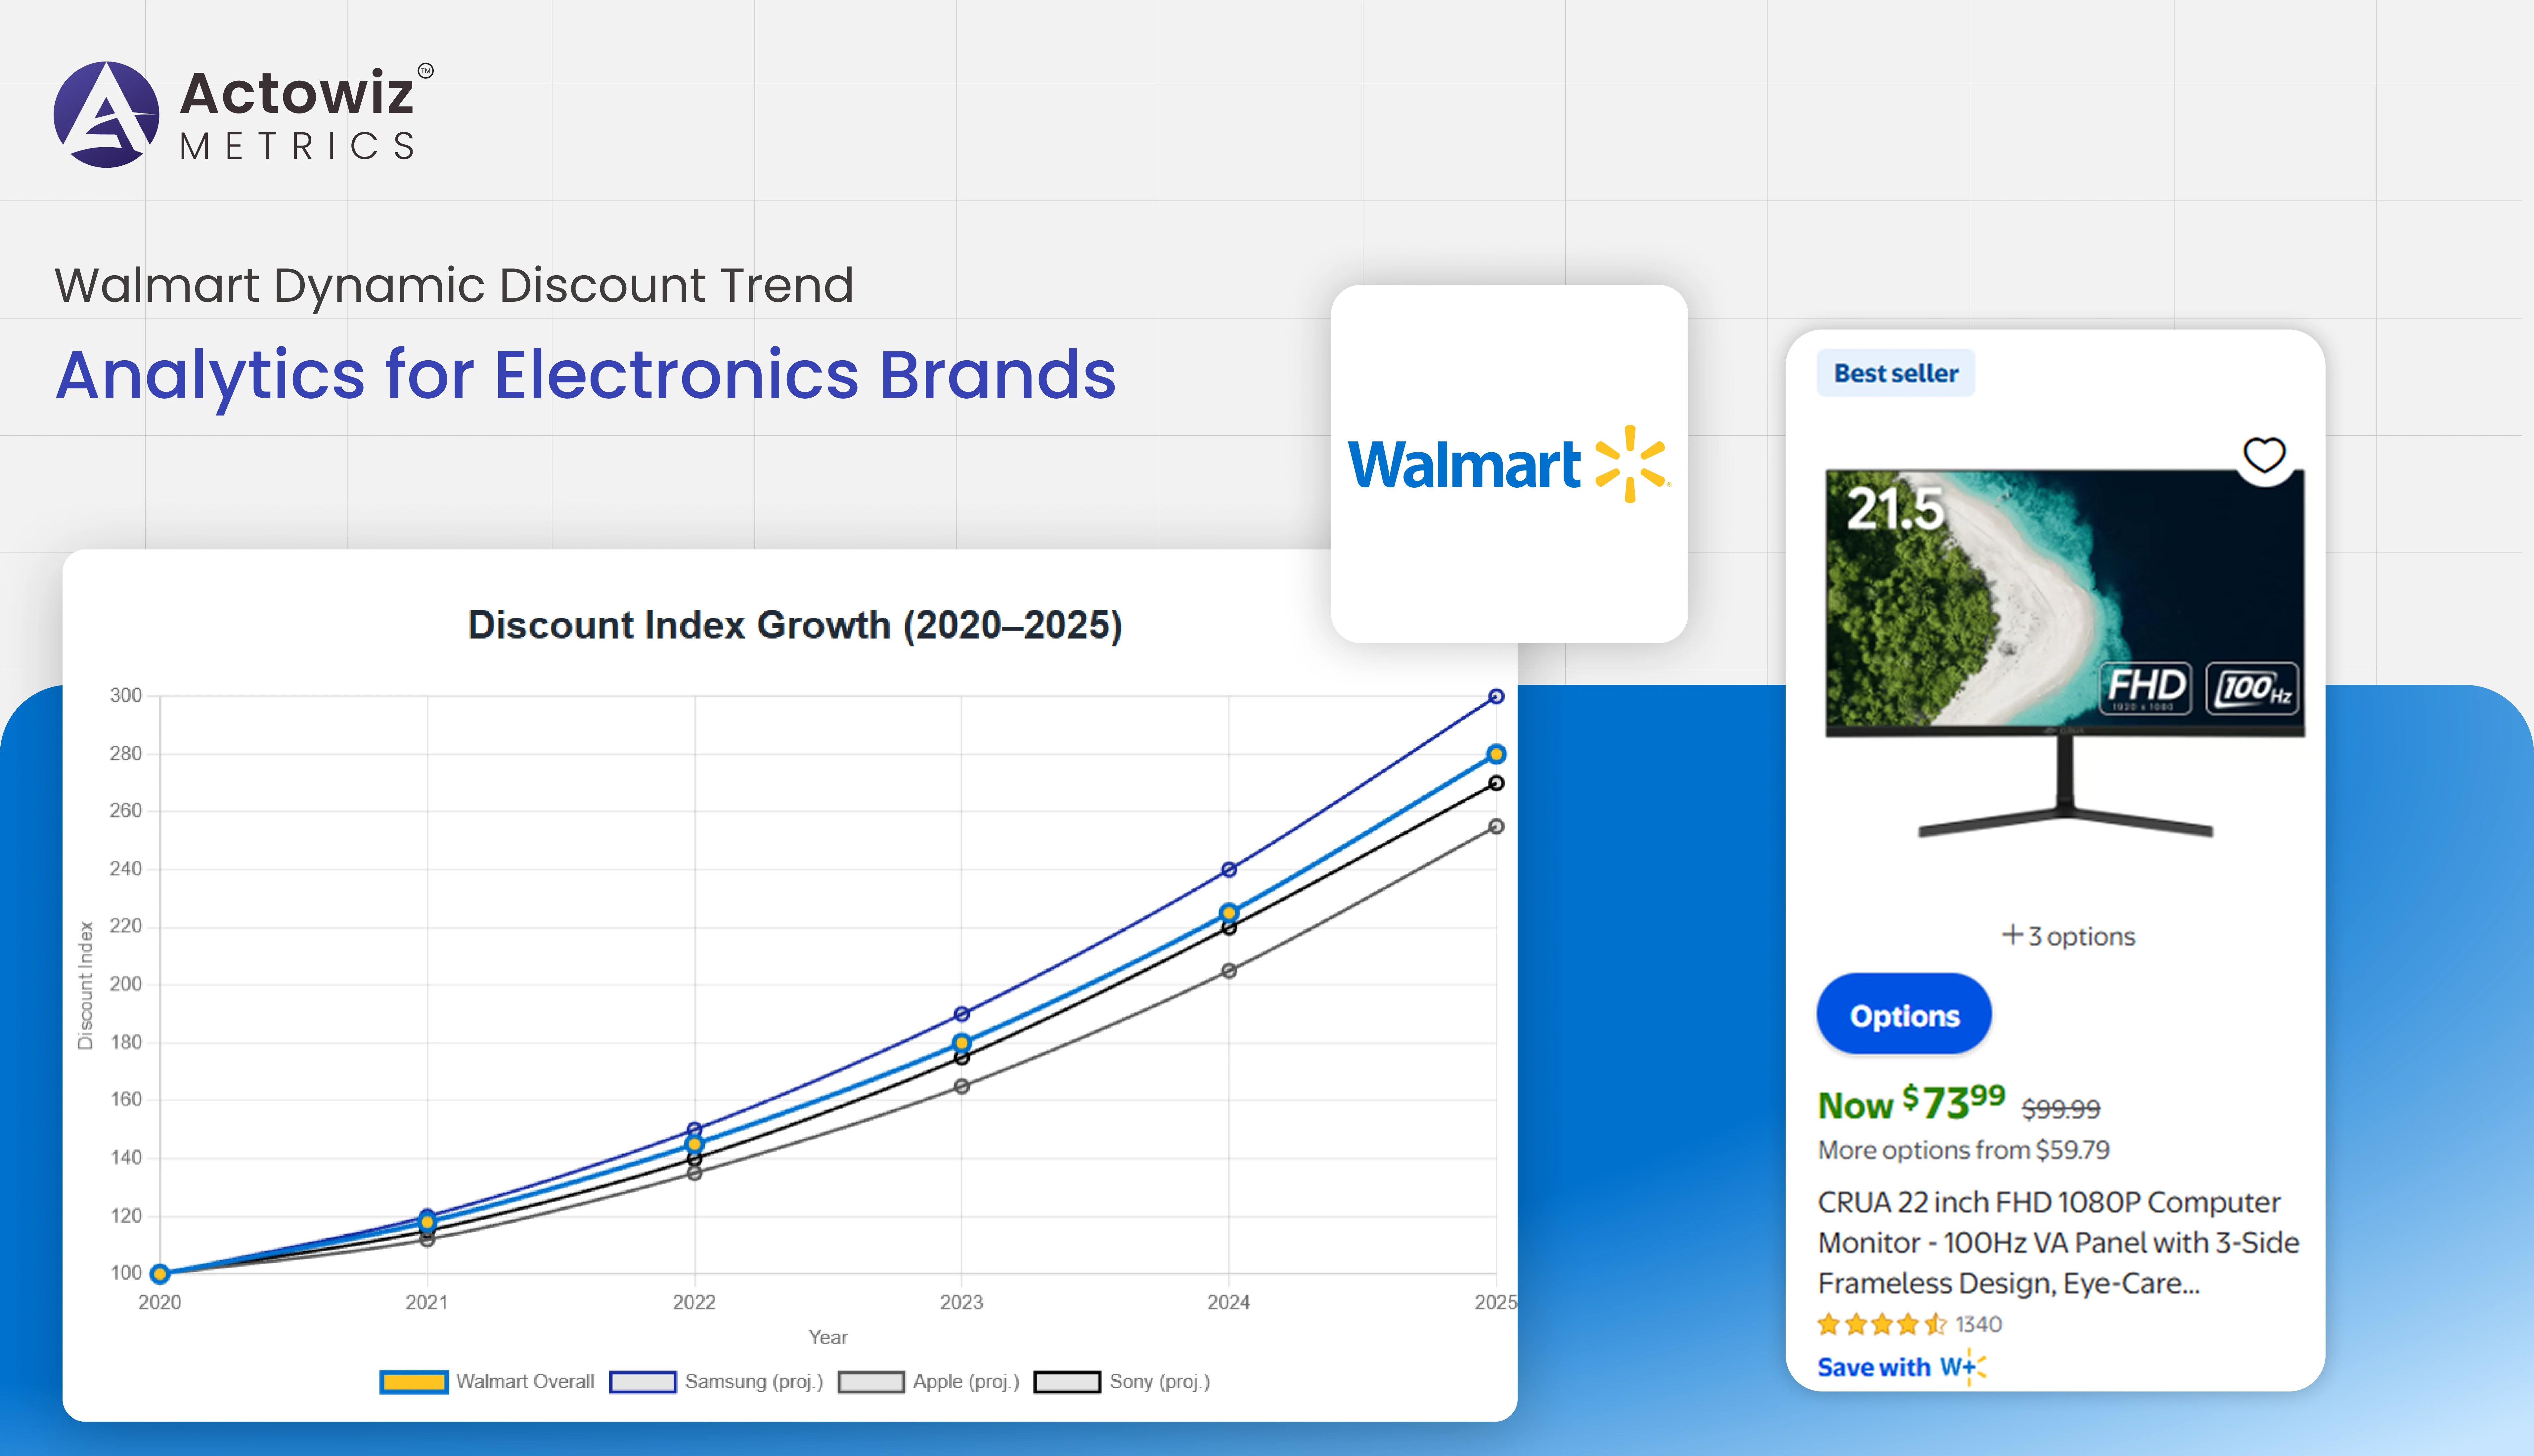
The global electronics retail market has undergone a fundamental transformation over the last decade, driven by rapid technological innovation, shorter product life cycles, and heightened price sensitivity among consumers. Walmart, as one of the world’s largest omnichannel retailers, plays a critical role in shaping pricing and discount dynamics for electronics brands. This research report focuses on Walmart Dynamic Discount Trend Analytics for Electronics Brands, offering an in-depth view of how discount strategies have evolved from 2020 to 2026 and how brands can leverage analytics to stay competitive.
By systematically analyzing discount patterns, SKU-level pricing behavior, and competitive movements, this report highlights the importance of data-driven decision-making in managing margins, visibility, and brand equity within Walmart’s highly competitive digital shelf ecosystem.
Understanding promotional behavior at scale begins with Walmart Electronics Products Deals Tracking, Price Benchmarking across core categories such as TVs, laptops, smartphones, wearables, and home electronics. From 2020 to 2026, Walmart steadily increased the frequency and depth of electronics promotions to attract price-conscious consumers and counter competitive pressure from other marketplaces.
| Year | TVs | Laptops | Smartphones | Accessories |
|---|---|---|---|---|
| 2020 | 10% | 8% | 7% | 12% |
| 2022 | 16% | 13% | 11% | 18% |
| 2024 | 20% | 17% | 15% | 22% |
| 2026* | 23% | 19% | 17% | 25% |
Price benchmarking enables electronics brands to compare their discount strategies against category norms. Brands that fail to benchmark often over-discount, eroding margins without gaining incremental visibility. Conversely, under-discounting can result in lost Buy Box share and reduced traffic. Deal tracking data provides clarity on optimal discount bands, helping brands maintain competitive positioning while balancing profitability in a high-volume retail environment.
Granular pricing intelligence is unlocked through Walmart SKU-Level Discount Data Scraping for Electronics Products, which captures discount activity at the individual SKU level. Between 2020 and 2026, Walmart’s electronics assortment expanded rapidly, increasing both competitive density and pricing complexity.
| Year | Active SKUs | Avg. Discount Events per SKU |
|---|---|---|
| 2020 | 175,000 | 3.1 |
| 2022 | 210,000 | 4.0 |
| 2024 | 240,000 | 5.1 |
| 2026* | 270,000+ | 6.2 |
SKU-level data reveals that not all discounts drive equal value. Some SKUs benefit from frequent low-depth promotions, while others perform better with fewer but deeper discounts. Brands can use this insight to refine product-level pricing strategies, align promotions with inventory objectives, and optimize lifecycle pricing for both new launches and end-of-life products.
Comprehensive Walmart Electronics Products Pricing Intelligence, Brand Competition Analysis allows brands to understand how their discount strategies compare against direct competitors and private labels. From 2020 onward, Walmart private brands and emerging manufacturers increased pressure on established electronics brands.
| Brand Type | Avg. Discount % | Promotion Frequency |
|---|---|---|
| Global Tier-1 Brands | 13% | Medium |
| Challenger Brands | 18% | High |
| Private Labels | 21% | Very High |
Brand competition analysis highlights strategic differences in how discounts are deployed. While premium brands often protect pricing to preserve brand equity, challenger brands rely on aggressive discounting to gain share. Pricing intelligence helps brands identify threats early, benchmark against peers, and design differentiated pricing strategies that align with long-term brand objectives.
Advanced Walmart Electronics Products Competitive Pricing Analytics transforms raw price and discount data into actionable insights. Between 2020 and 2026, brands using analytics-driven pricing frameworks significantly improved promotional effectiveness.
| Year | Avg. Sales Lift Without Analytics | Avg. Sales Lift With Analytics |
|---|---|---|
| 2020 | 12% | 18% |
| 2023 | 14% | 24% |
| 2026* | 15% | 29% |
Competitive pricing analytics enables scenario modeling, elasticity analysis, and promotion planning. Brands can simulate the impact of discount changes before execution, reducing risk while maximizing ROI. This strategic approach helps electronics brands move away from reactive price matching toward proactive pricing leadership.
Scalability and speed are achieved through the Walmart Dynamic Discount Monitoring API for Electronics Products, Product Data Tracking, which enables automated, near real-time access to pricing and promotion data. From 2020 to 2026, automation adoption dramatically reduced operational inefficiencies.
| Metric | Manual Monitoring | API-Based Monitoring |
|---|---|---|
| Data Refresh Rate | Weekly | Real-Time |
| Pricing Errors | 9–11% | <1% |
| SKU Coverage | Partial | Full Assortment |
APIs allow brands to set alerts for sudden price drops, unauthorized discounting, and competitor promotions. This continuous monitoring capability ensures pricing governance, faster response times, and better alignment between marketing, sales, and supply chain teams.
Long-term Walmart Retail Discount Analytics for Electronics Brands provides insights into how discount strategies affect sales growth, margins, and brand perception over time. Historical data from 2020 to 2026 highlights the relationship between discount depth and performance.
| Discount Range | Avg. Sales Lift | Margin Impact |
|---|---|---|
| 5–10% | 7% | Low |
| 10–20% | 17% | Moderate |
| 20%+ | 28% | High |
These insights help brands identify sustainable discount thresholds that drive volume without damaging long-term profitability. Retail discount analytics also supports forecasting, seasonal planning, and evaluation of promotional fatigue across product categories.
Actowiz Metrics delivers advanced E-commerce Analytics capabilities purpose-built for Walmart Dynamic Discount Trend Analytics for Electronics Brands. With scalable data extraction, high-accuracy SKU-level insights, and customizable analytics frameworks, Actowiz empowers brands to track discounts, benchmark competitors, and optimize pricing strategies with confidence. The platform transforms complex Walmart marketplace data into actionable intelligence, enabling electronics brands to make faster, smarter, and more profitable decisions.
In today’s highly competitive electronics marketplace, pricing and discount strategies directly influence visibility, conversion, and brand equity. Leveraging Digital Shelf Analytics alongside Walmart Dynamic Discount Trend Analytics for Electronics Brands allows manufacturers and retailers to understand discount behavior at scale, anticipate competitive moves, and optimize promotional investments.
Partner with Actowiz Metrics today to unlock deeper Walmart discount intelligence and build resilient, data-driven pricing strategies that drive sustainable growth.

Whatever your project size is, we will handle it well with all the standards fulfilled! We are here to give 100% satisfaction.
Any analytics feature you need — we provide it
24/7 global support
Real-time analytics dashboard
Full data transparency at every stage
Customized solutions to achieve your data analysis goals