Create your own


The U.S. beauty retail industry has undergone rapid transformation between 2020 and 2026, driven by omnichannel acceleration, influencer marketing, private-label growth, and aggressive digital expansion. This report by Actowiz Metrics delivers deep competitive insights through Beauty Product Data Analytics - Sephora vs Ulta Beauty, uncovering how both brands compete across store expansion, pricing strategies, assortment depth, and digital shelf dominance.
With increasing overlap in premium and mass-beauty categories, strategic Brand Competition Analysis becomes critical to identifying margin leakage, promotional intensity, SKU duplication, and price parity gaps. By leveraging structured datasets, SKU-level tracking, and real-time monitoring, this research highlights comparative growth trajectories, digital visibility metrics, review sentiment patterns, and pricing intelligence from 2020–2026.
The objective is to help beauty brands, distributors, and marketplace sellers understand competitive positioning, optimize assortment planning, strengthen MAP compliance, and enhance profitability in a highly dynamic retail landscape.
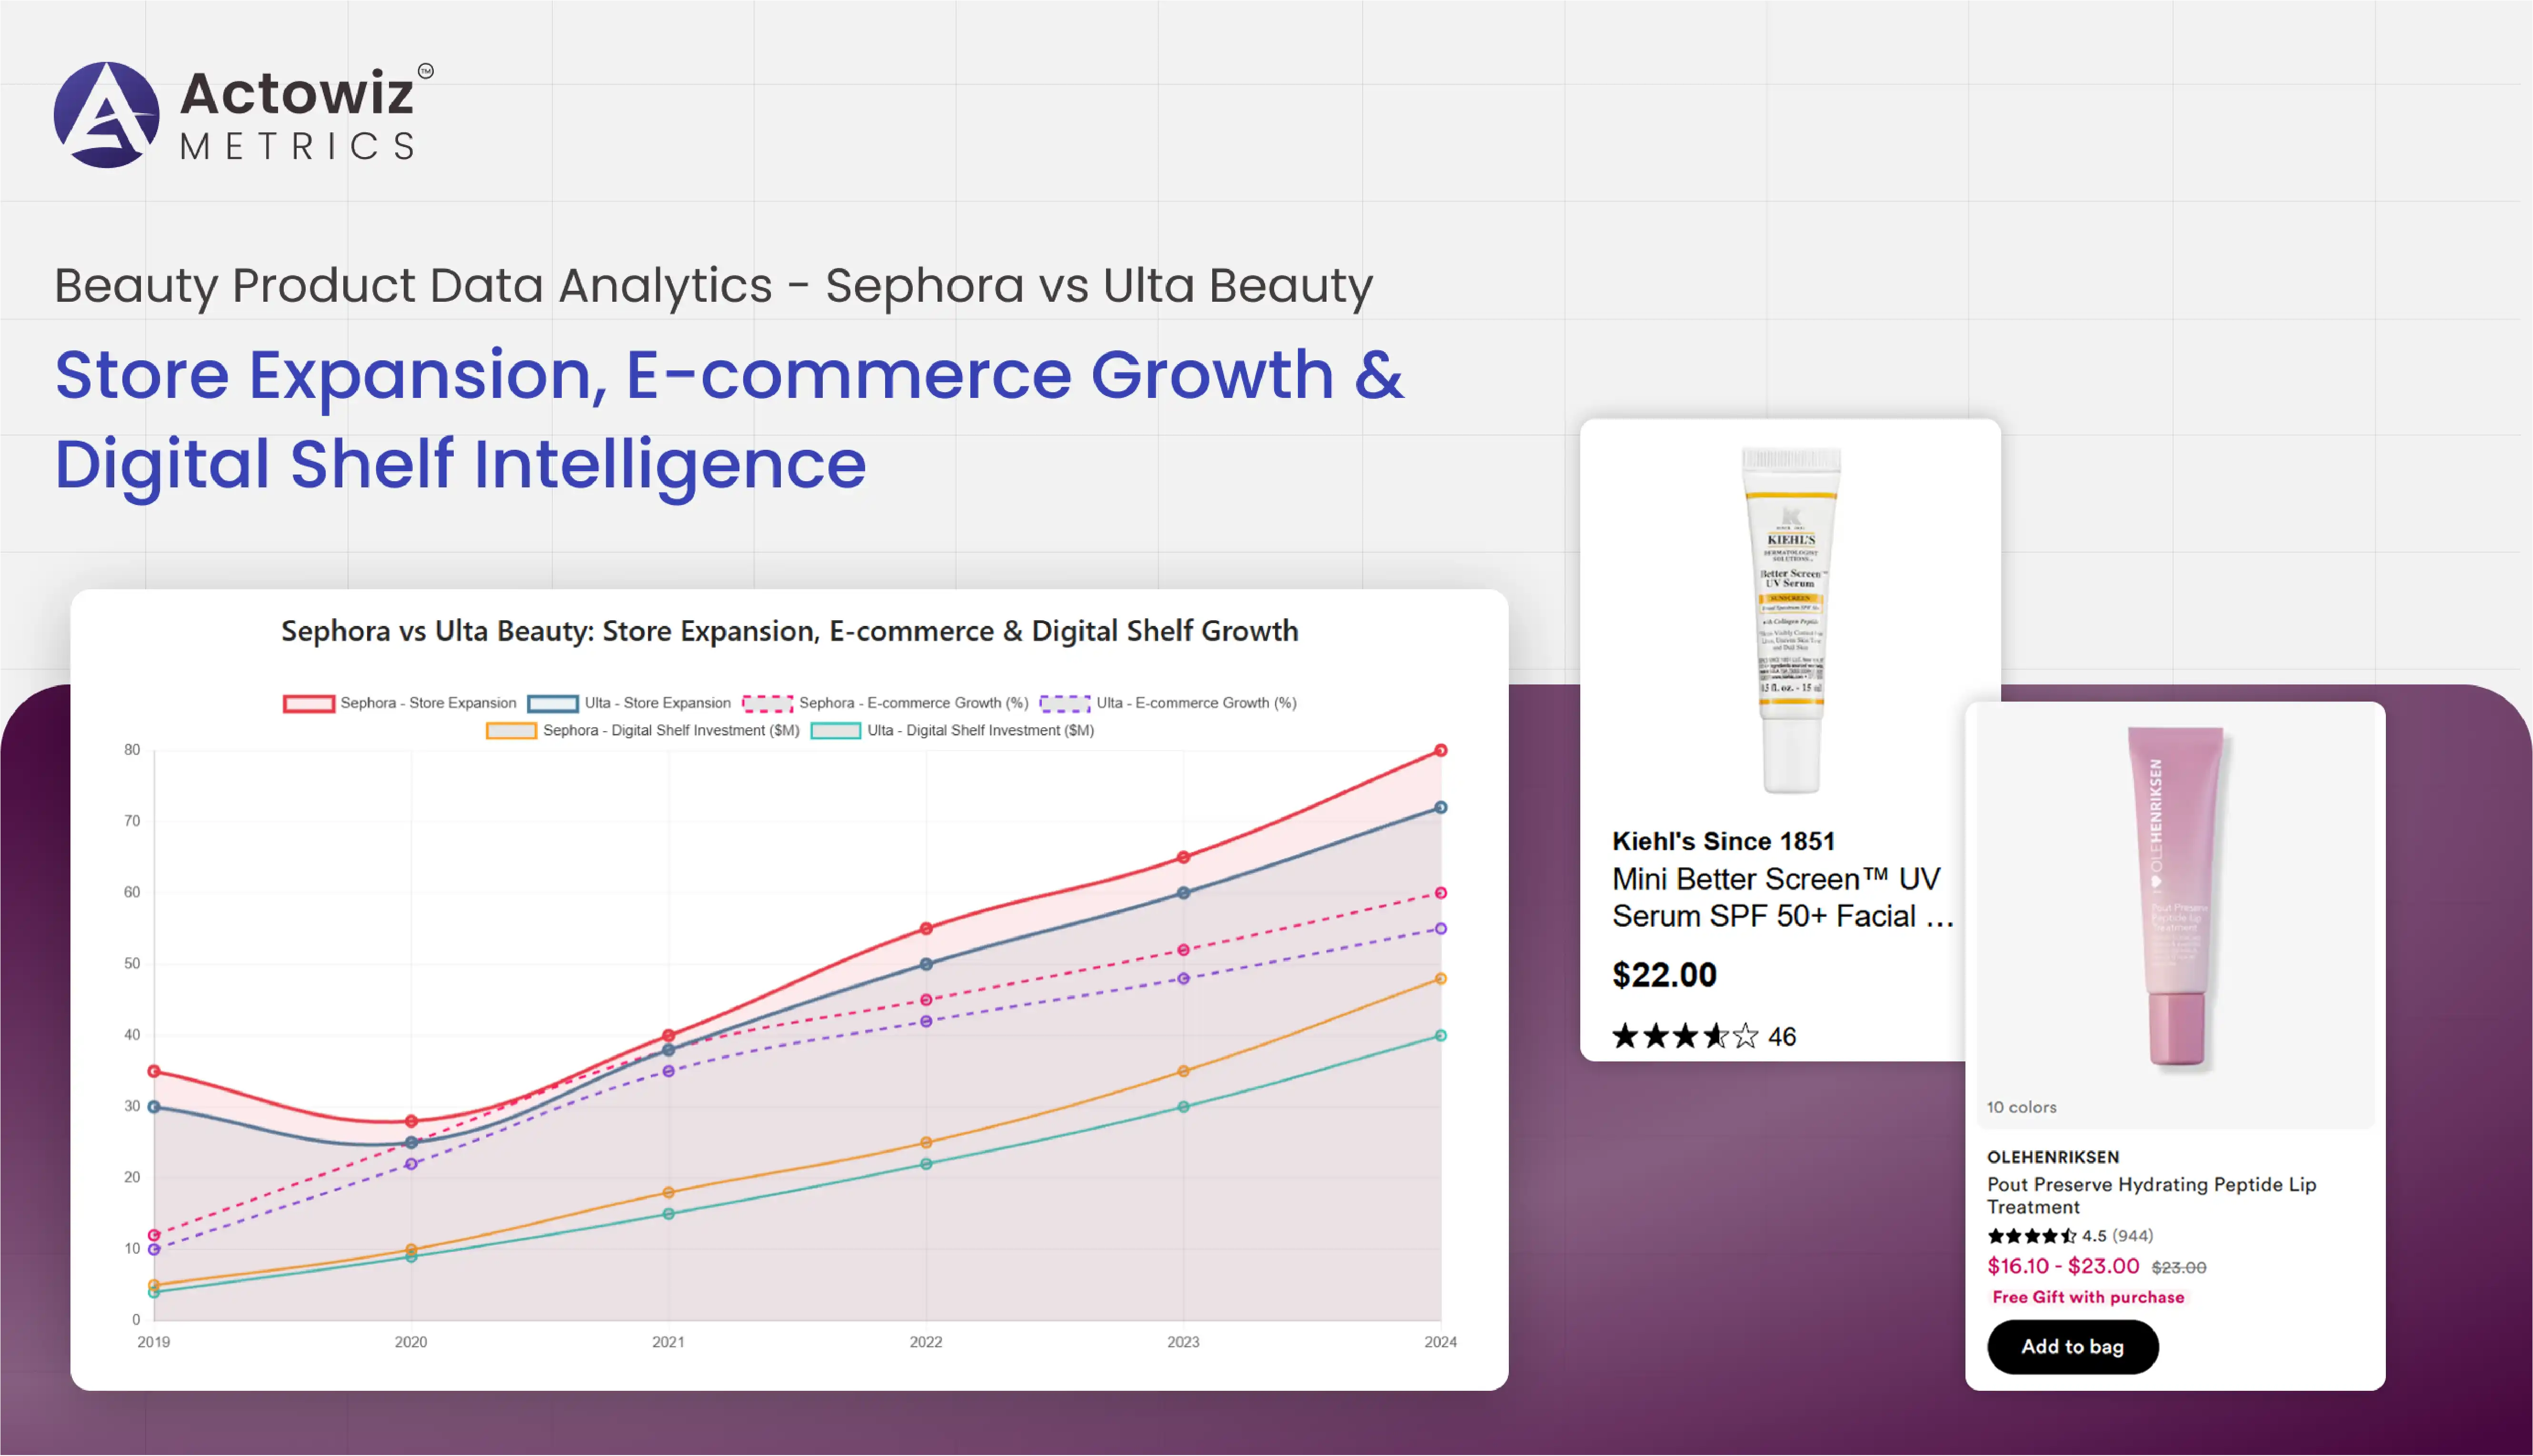
Between 2020 and 2026, both retailers aggressively expanded physical stores while strengthening e-commerce ecosystems. Actowiz Metrics used Scrape Sephora vs Ulta Beauty Product & Price Data techniques to monitor pricing consistency across channels, while advanced Product Data Tracking helped evaluate SKU growth and regional expansion patterns.
| Year | Sephora Stores | Ulta Stores | Sephora Online SKU Count | Ulta Online SKU Count |
|---|---|---|---|---|
| 2020 | 430 | 1,264 | 28,000 | 25,500 |
| 2022 | 480 | 1,325 | 32,500 | 29,000 |
| 2024 | 540 | 1,390 | 36,800 | 33,200 |
| 2026* | 610 | 1,460 | 42,000 | 38,500 |
Sephora focused on premium brand exclusivity and shop-in-shop expansion partnerships, while Ulta accelerated suburban penetration and hybrid mass-prestige assortment strategies.
Key observations:
Retailers increased SKU density to meet rising consumer demand for inclusivity and clean beauty. Through structured monitoring, Actowiz Metrics leveraged Track Sephora vs Ulta Beauty Product Data systems to evaluate assortment depth across skincare, makeup, haircare, and fragrance categories.
| Category | Sephora SKU % | Ulta SKU % |
|---|---|---|
| Skincare | 38% | 34% |
| Makeup | 30% | 32% |
| Haircare | 18% | 20% |
| Fragrance | 14% | 14% |
Sephora led in luxury skincare exclusives, while Ulta maintained stronger representation in drugstore-mass hybrid brands.
Key insights:
This diversification strategy improved consumer retention but intensified pricing competition and margin pressure.
MAP violations and price inconsistencies significantly impact profitability. Using SKU-Level Sephora vs Ulta Beauty Competitive Insights, Actowiz Metrics conducted structured MAP Monitoring to detect pricing deviations across online listings.
| Year | Avg. Price Gap (%) | MAP Violations (%) |
|---|---|---|
| 2020 | 3.8% | 9% |
| 2022 | 4.5% | 12% |
| 2024 | 5.2% | 14% |
| 2026* | 5.6% | 16% |
Findings show rising promotional intensity and discount experimentation.
Observations:
These pricing insights highlight the need for continuous digital shelf monitoring.
Consumer trust and promotion frequency significantly influence sales velocity. Through automated pipelines, Actowiz Metrics deployed systems to Extract Real-Time Sephora vs Ulta Beauty Product Insights Data including discounts, ratings, and stock availability.
| Year | Avg. Discount % | Avg. Rating (Sephora) | Avg. Rating (Ulta) |
|---|---|---|---|
| 2020 | 12% | 4.3 | 4.2 |
| 2022 | 15% | 4.4 | 4.3 |
| 2024 | 18% | 4.5 | 4.4 |
| 2026* | 20% | 4.6 | 4.5 |
Insights:
Real-time intelligence allowed brands to optimize campaign timing and manage competitive discount strategies.
Using predictive modeling and structured dashboards, Actowiz Metrics enabled advanced Sephora vs Ulta Beauty Product Data Intelligence to track demand shifts and revenue share growth.
| Year | Sephora Market Share | Ulta Market Share |
|---|---|---|
| 2020 | 33% | 37% |
| 2022 | 35% | 38% |
| 2024 | 37% | 39% |
| 2026* | 39% | 40% |
Key points:
Demand analytics enabled accurate inventory forecasting and optimized replenishment strategies.
Advanced E-commerce Analytics revealed how product rankings, sponsored placements, and review density influenced brand discoverability.
| Metric | Sephora | Ulta |
|---|---|---|
| Avg. Page Rank Position | 3.2 | 3.8 |
| Sponsored Listings % | 18% | 22% |
| Avg. Reviews per SKU | 1,250 | 1,040 |
| Conversion Rate | 4.8% | 4.5% |
Observations:
Digital shelf optimization directly impacted visibility and revenue growth.
Actowiz Metrics delivers enterprise-grade intelligence solutions powered by advanced Digital Shelf Analytics and deep domain expertise in Beauty Product Data Analytics - Sephora vs Ulta Beauty.
Key differentiators:
Our proprietary analytics models help brands reduce margin leakage, strengthen assortment strategies, and gain competitive clarity in omnichannel environments.
The beauty retail industry continues to evolve through aggressive store expansion, omnichannel investments, and data-driven pricing strategies. Leveraging Price Benchmarking insights through structured Beauty Product Data Analytics - Sephora vs Ulta Beauty empowers brands to reduce margin erosion, enhance digital shelf performance, and strengthen competitive positioning.
Actowiz Metrics provides actionable intelligence that transforms raw product data into measurable growth strategies.
Contact Actowiz Metrics today to unlock powerful competitive insights and gain a data-driven edge in the evolving beauty retail landscape!

Whatever your project size is, we will handle it well with all the standards fulfilled! We are here to give 100% satisfaction.
Any analytics feature you need — we provide it
24/7 global support
Real-time analytics dashboard
Full data transparency at every stage
Customized solutions to achieve your data analysis goals