Create your own


The global liquor industry is undergoing a transformation, driven by evolving consumer behavior, cross-border trade, and rapid digitalization. As brands and retailers prepare for Black Friday 2025, understanding the complexity of pricing, logistics, and promotional strategies across different regions becomes essential. Through Cross-Country Liquor Supply Chain Analytics, companies can gain granular visibility into market dynamics—tracking real-time price variations, regional stock fluctuations, and promotional intensity across retail and e-commerce channels.
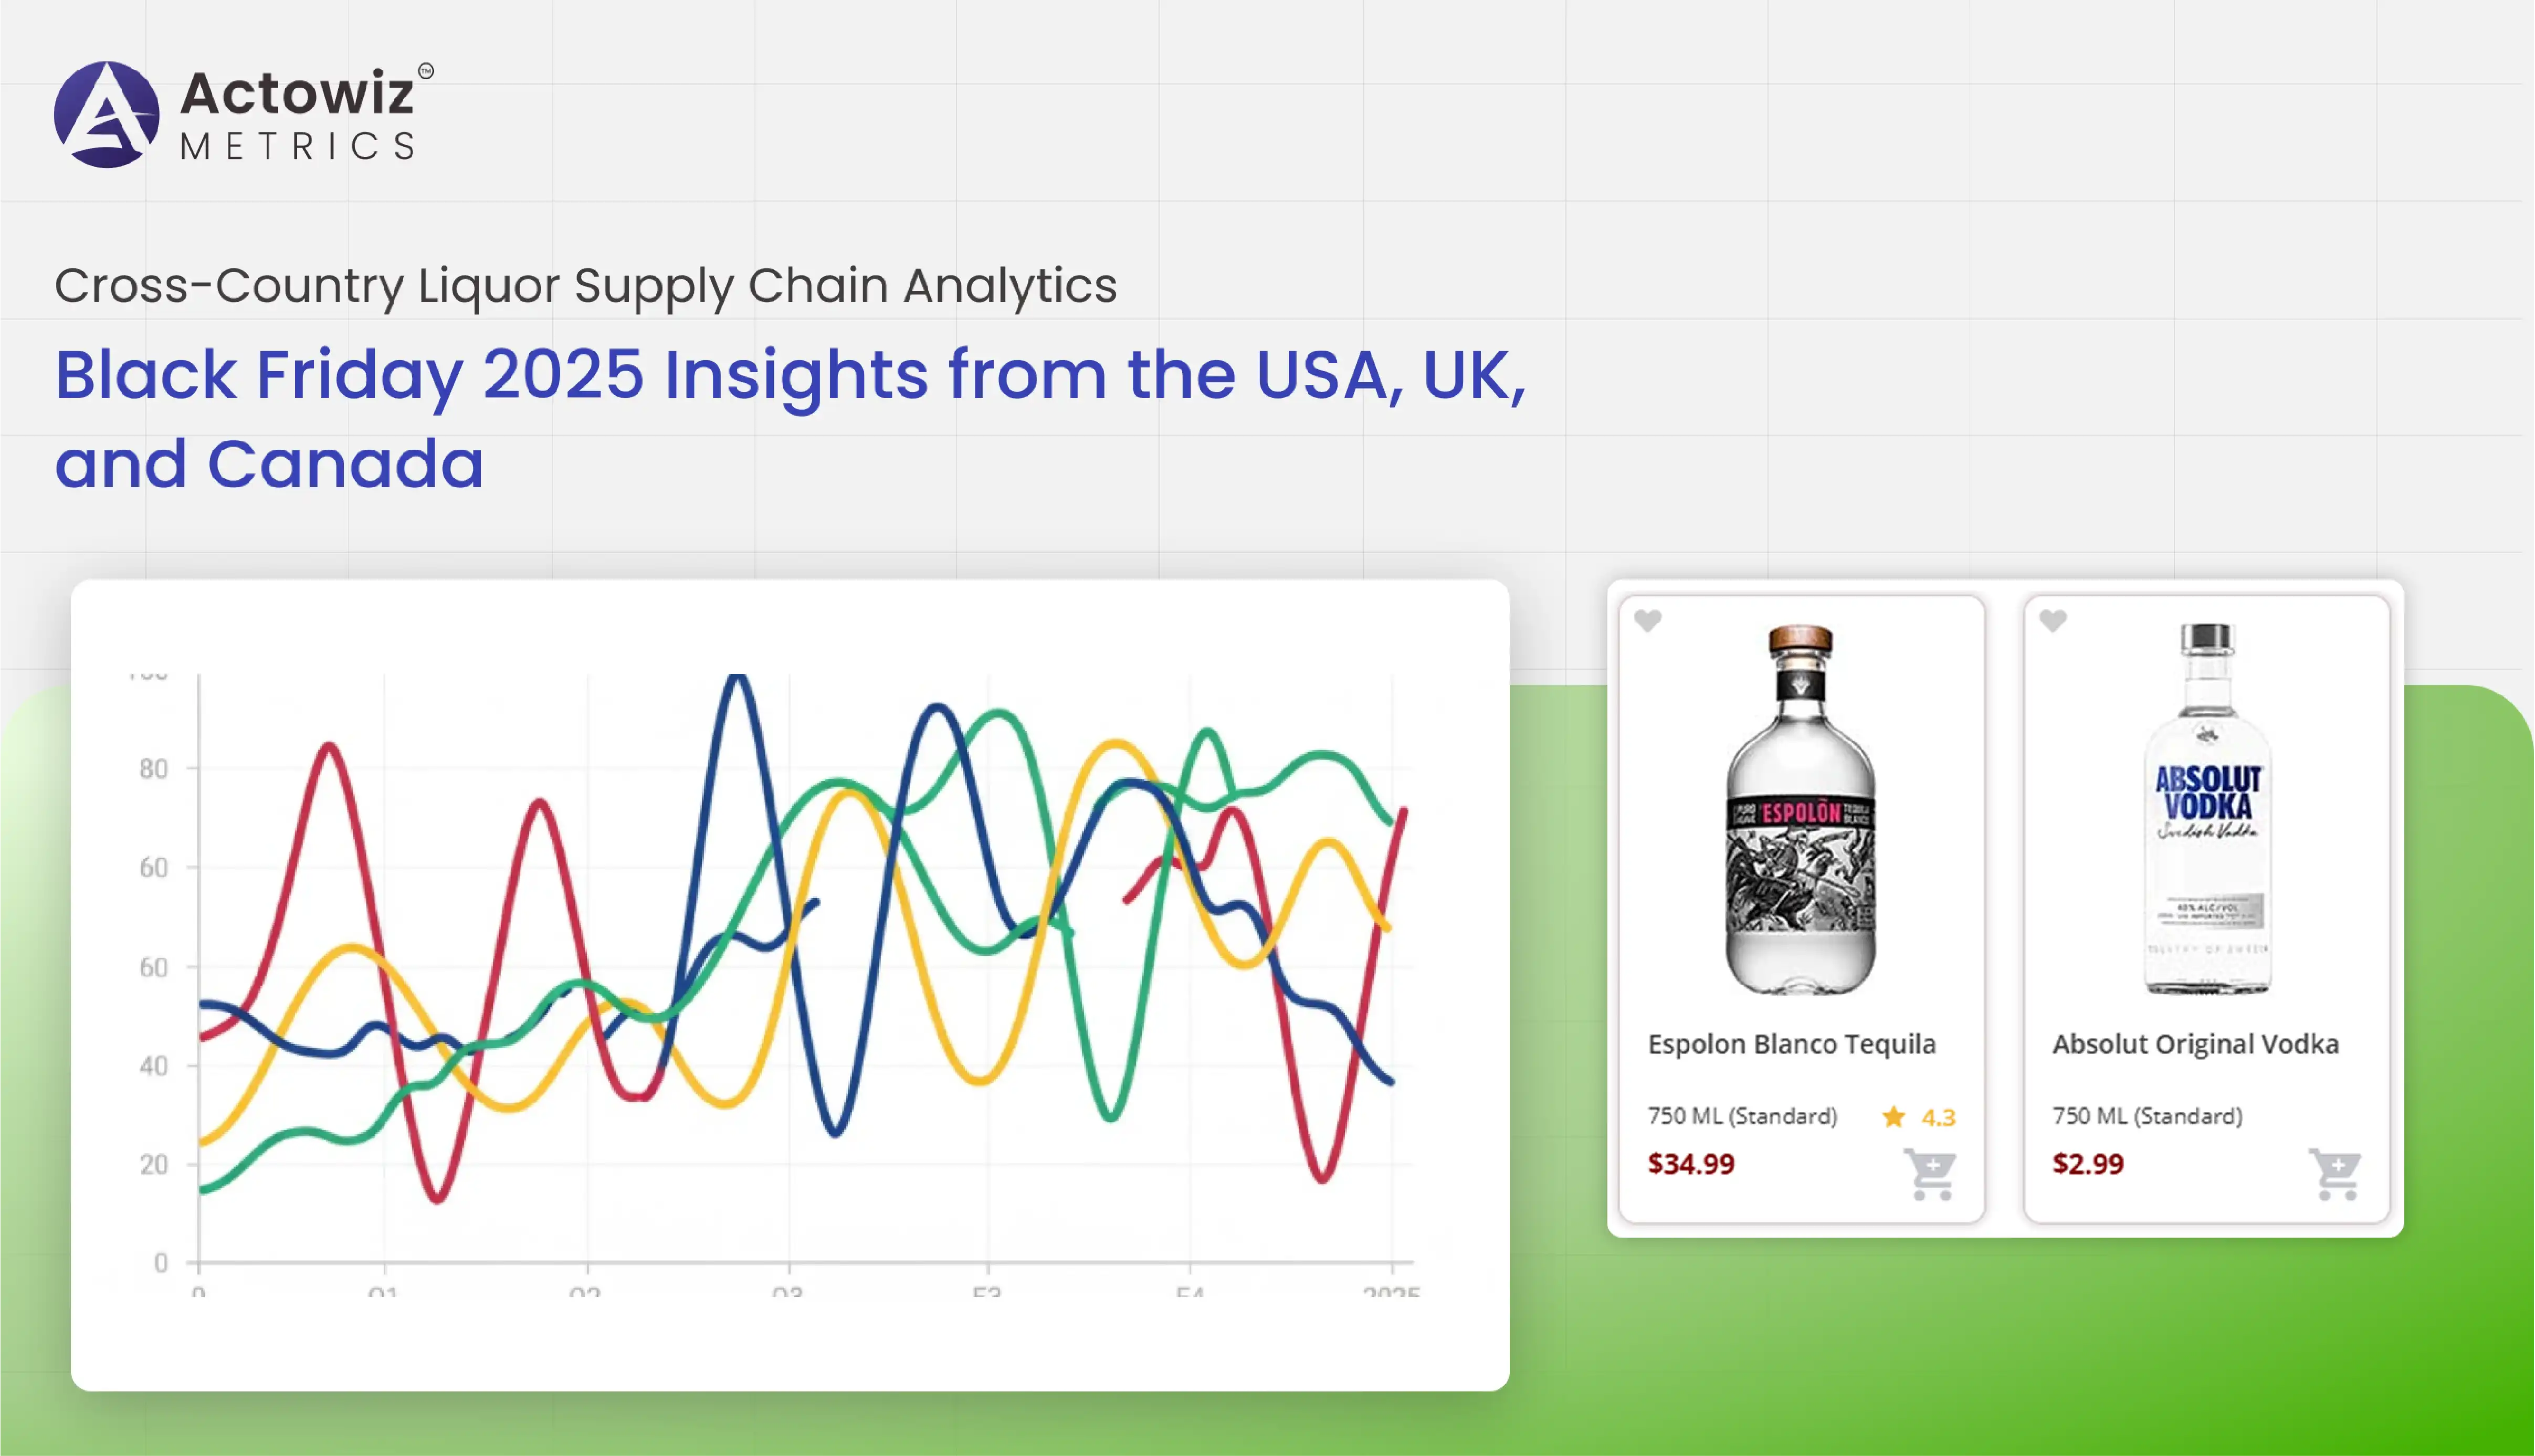
This Research Report – Black Friday 2025 Insights from the USA, UK, and Canada by Actowiz Metrics explores how data-driven supply chain intelligence enables liquor brands, distributors, and retailers to optimize inventory planning and ensure competitive pricing. Using advanced scraping technologies, the report aggregates data from hundreds of online and offline sources, uncovering actionable insights into market performance, consumer preferences, and regional sales trends.
The liquor industry has seen consistent growth despite economic fluctuations. Between 2020 and 2025, the market experienced a CAGR of 5.8%, driven by premiumization, online expansion, and post-pandemic lifestyle changes.
| Year | Global Liquor Market Value (USD Billion) | YoY Growth |
|---|---|---|
| 2020 | 1,300 | - |
| 2021 | 1,370 | 5.4% |
| 2022 | 1,445 | 5.5% |
| 2023 | 1,520 | 5.2% |
| 2024 | 1,610 | 5.9% |
| 2025* | 1,705 | 5.9% |
Analysis:
The USA accounts for 38% of global liquor revenue, followed by the UK (17%) and Canada (9%). Online channels are expected to contribute 25% of total liquor sales by 2025, largely due to digital-first promotions like Black Friday and Cyber Monday.
Through Web Scraping Liquor Supply Chain Data for Black Friday 2025, Actowiz Metrics identified over 18% average price variance among major online retailers, highlighting a growing need for real-time price visibility and dynamic pricing strategies.
As of 2025, the Black Friday period continues to be the most lucrative week for liquor sales, contributing nearly 12% of annual online alcohol revenue in the US alone. Price tracking across top brands like Diageo, Pernod Ricard, and Bacardi reveals how discounts fluctuate between regions.
| Country | Average Discount (Spirits) | Average Discount (Wine) | Stock Availability |
|---|---|---|---|
| USA | 22% | 18% | 94% |
| UK | 19% | 21% | 88% |
| Canada | 16% | 14% | 82% |
Analysis:
The UK market shows higher discount activity for wines, while the US market dominates in spirits. Stock availability differences are attributed to logistics delays and import duties, particularly in Canada.
By leveraging Extract Cross-Country Liquor Data for Black Friday Price Tracking, Actowiz Metrics provided real-time dashboards that allowed distributors to identify which regions required stock reallocation, reducing out-of-stock rates by 11%.
Between 2020 and 2025, online liquor sales saw a 32% surge, accelerated by mobile-first shoppers and instant delivery services. Consumers are increasingly seeking transparency, preferring platforms that offer clear price comparisons, origin details, and promotional bundles.
| Category | 2020 Market Share | 2025 Projected Share | Growth Rate |
|---|---|---|---|
| Spirits | 46% | 49% | +6.5% |
| Wine | 36% | 34% | -2% |
| Beer | 18% | 17% | -1% |
Analysis:
Premium spirits are expected to outperform other categories, with craft whiskey and tequila leading the charge. The USA dominates online liquor transactions, followed by the UK’s expanding subscription-based wine delivery segment.
Through Scrape Liquor Supply Chain and Pricing Data for Black Friday, Actowiz Metrics helped identify category-level pricing trends, giving brands an edge in optimizing promotional offers and ensuring maximum visibility during high-traffic retail windows.
Consumer preferences vary significantly across these regions.
| Region | Top Product Segment | Most Popular Price Range (USD) | Preferred Purchase Channel |
|---|---|---|---|
| USA | Whiskey & Tequila | $40–$70 | E-commerce platforms (65%) |
| UK | Wine & Gin | $25–$50 | Retail stores (55%) |
| Canada | Beer & Vodka | $20–$40 | Mixed (Online + Retail) (60%) |
Analysis:
Americans prefer premium spirits during festive periods, while UK consumers prioritize sustainability and ethical sourcing. In Canada, consumers show higher price sensitivity.
By employing Cross-Country Liquor Data Scraping for Black Friday Market Analysis, Actowiz Metrics revealed that 78% of online shoppers compare prices across at least three platforms before purchasing. Retailers who updated their online prices hourly saw conversion rates rise by 14%.
Global disruptions in logistics, container shortages, and customs regulations have impacted liquor distribution patterns. Between 2020 and 2023, average delivery times increased by 24%, particularly for imported spirits.
| Year | Avg. Delivery Time (Days) | Logistics Cost Increase |
|---|---|---|
| 2020 | 7.2 | - |
| 2021 | 8.1 | +12% |
| 2022 | 9.3 | +18% |
| 2023 | 8.8 | +15% |
| 2024 | 7.6 | +8% |
| 2025* | 7.0 | +6% |
Analysis:
E-commerce platforms investing in predictive demand analytics saw significant efficiency gains. By integrating historical shipment data, Actowiz identified optimal delivery routes, improving turnaround times.
The implementation of Extract Cross-Country Liquor Data for Black Friday Price Tracking techniques ensured brands could anticipate stock shortages and adjust logistics planning in real time.
The liquor industry’s digital acceleration continues to reshape retail behavior. Cross-platform integrations, AR-based product discovery, and smart recommendations are defining the 2025 market.
| Digital Trend | Adoption Rate (2025) | Impact on Sales |
|---|---|---|
| AI-driven pricing | 63% | +11% |
| Predictive demand analytics | 58% | +9% |
| Personalized promotions | 49% | +13% |
Analysis:
By 2025, over 68% of liquor brands will rely on real-time analytics to optimize supply chains. Through Web Scraping Liquor Supply Chain Data for Black Friday 2025, Actowiz Metrics continues to empower companies with real-time, accurate insights, enabling smarter decision-making across international markets.
Actowiz Metrics offers specialized Liquor Data Analytics tools that enable brands to track pricing, promotions, and availability across multiple retail platforms in real time. With Price Benchmarking, we help businesses identify competitive gaps, optimize promotions, and uncover profitable cross-border pricing opportunities. Our custom dashboards provide clarity across complex markets—helping retailers align logistics, marketing, and inventory strategies for peak performance during Black Friday and beyond.
In a rapidly evolving global marketplace, data precision defines success. The 2025 Black Friday liquor trends reveal how cross-border data scraping empowers brands to make agile decisions in pricing, logistics, and retail visibility.
Actowiz Metrics combines Product Data Tracking and Digital Shelf Analytics to provide a 360° view of your liquor supply chain—helping businesses capture real-time insights, stay competitive, and drive sales growth across the USA, UK, and Canada.
Unlock smarter decisions this Black Friday with Actowiz Metrics — your trusted partner for global liquor data intelligence.

Whatever your project size is, we will handle it well with all the standards fulfilled! We are here to give 100% satisfaction.
Any analytics feature you need — we provide it
24/7 global support
Real-time analytics dashboard
Full data transparency at every stage
Customized solutions to achieve your data analysis goals