Create your own


The global luxury fashion industry has demonstrated strong resilience and expansion between 2020 and 2026, driven by digital acceleration, emerging markets, and premium brand equity. Within this evolving ecosystem, Dior Luxury Fashion Market Analysis reveals how the brand continues to dominate through innovation, exclusivity, and strategic expansion across regions and product categories. From haute couture to leather goods and beauty, Dior’s diversified portfolio strengthens its competitive positioning worldwide.
Post-pandemic digital transformation has reshaped luxury consumption, with online luxury sales growing from 18% of total luxury revenue in 2020 to an estimated 30% by 2026. Strategic Price Benchmarking across global markets has become critical as brands respond to inflation, supply chain disruptions, and currency fluctuations. Dior has effectively maintained premium pricing while reinforcing brand desirability and scarcity value.
This research report by Actowiz Metrics delivers a comprehensive view of Dior’s market positioning, product dynamics, pricing strategies, competitive benchmarks, and forward-looking growth outlook from 2020 to 2026. Through structured data insights, analytics models, and intelligence frameworks, the report outlines how Dior sustains leadership in a highly competitive luxury environment.
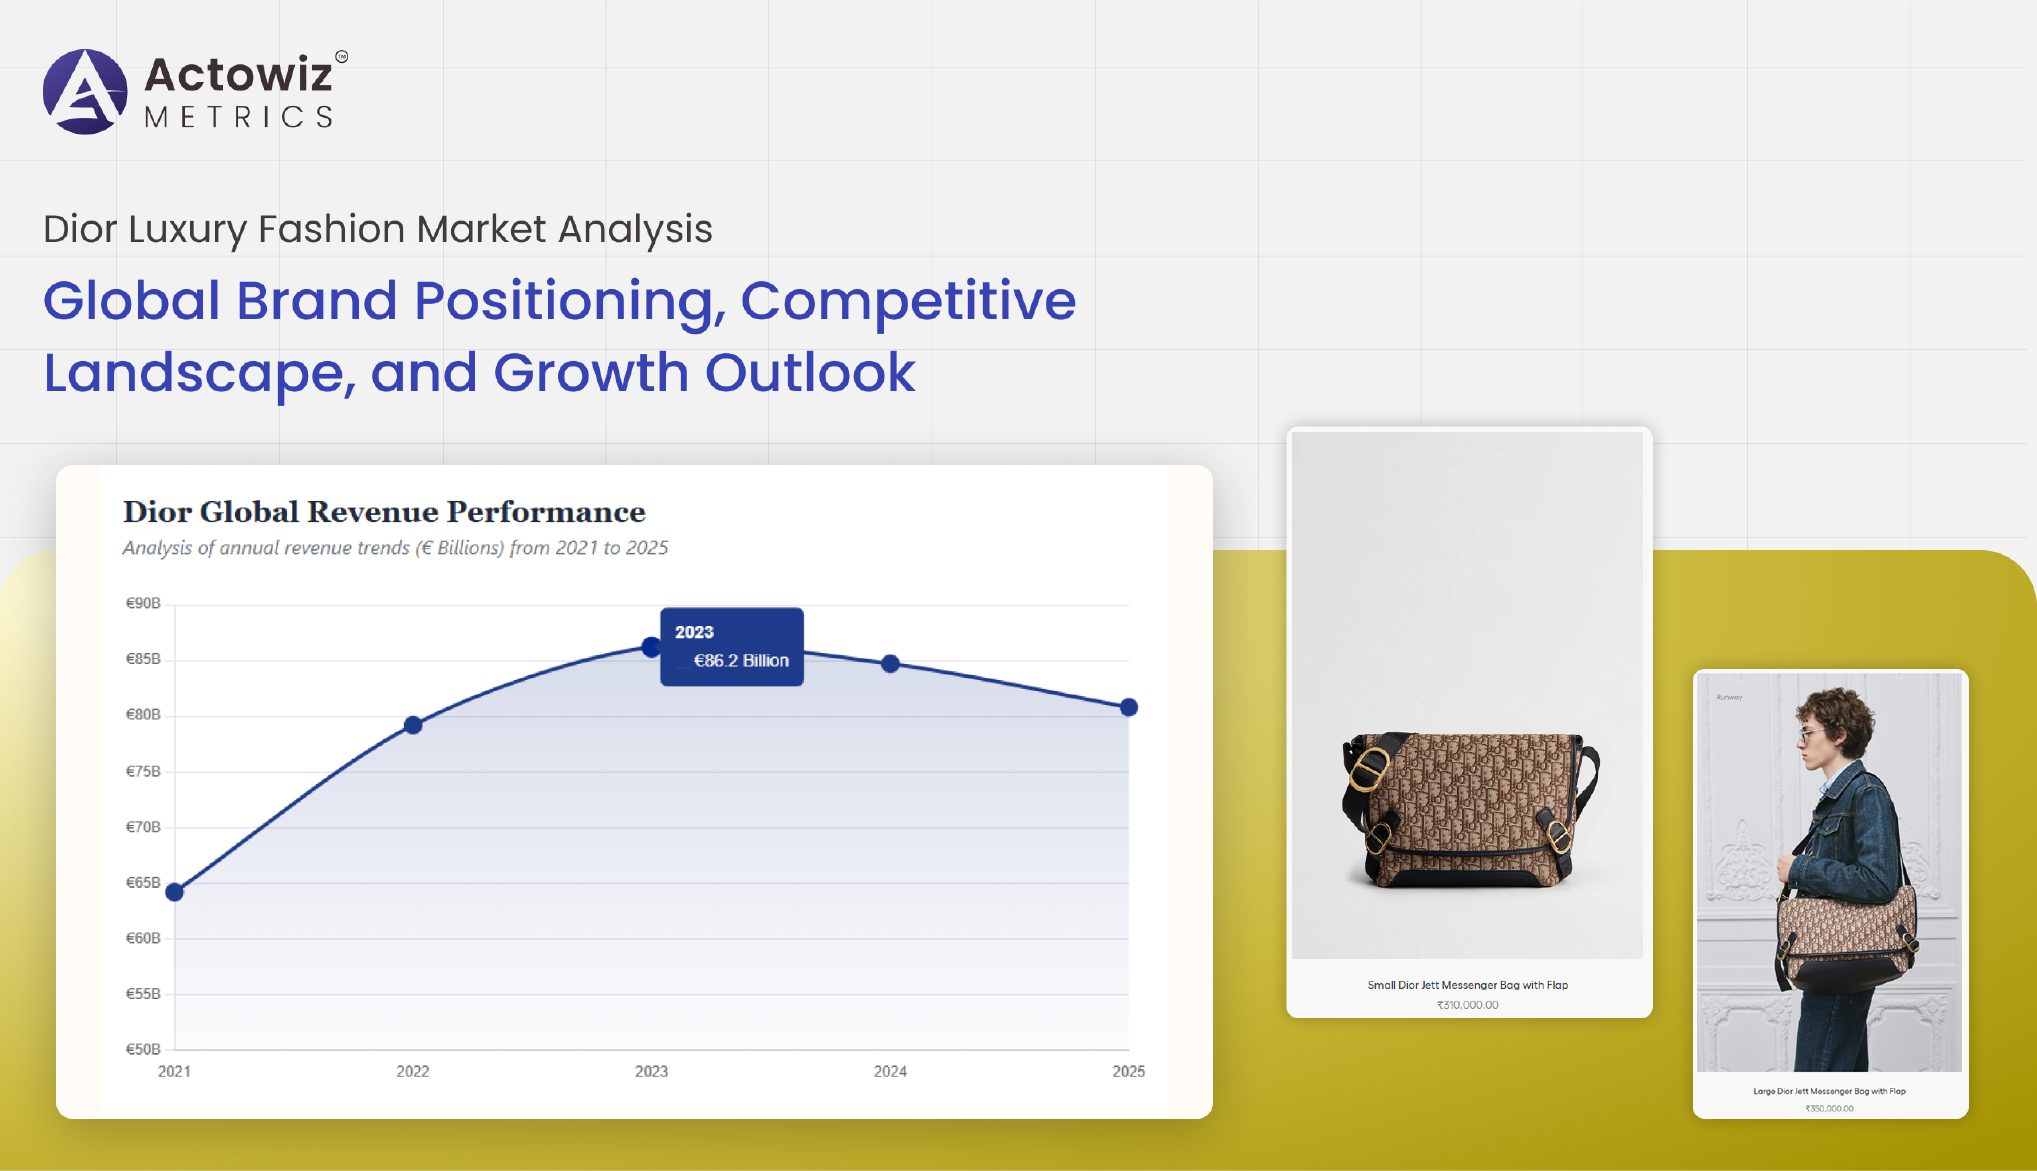
The luxury fashion market experienced steady recovery after 2020, with global revenue rising from approximately $260 billion in 2020 to a projected $380 billion by 2026. Dior’s strategic investments in omnichannel expansion, AI-driven personalization, and experiential retail significantly contributed to its growth trajectory.
Advanced Dior Fashion Data Analytics enables brands to assess product demand, category performance, and geographic trends. Through structured Brand Competition Analysis, Dior’s positioning against competitors such as Chanel, Gucci, and Louis Vuitton highlights its strength in leather goods and couture collections.
| Year | Global Luxury Market ($B) | Dior Estimated Revenue ($B) | Online Share (%) |
|---|---|---|---|
| 2020 | 260 | 49 | 18 |
| 2021 | 290 | 55 | 22 |
| 2022 | 310 | 60 | 24 |
| 2023 | 335 | 66 | 26 |
| 2024 | 350 | 70 | 28 |
| 2025 | 365 | 74 | 29 |
| 2026 | 380 | 78 | 30 |
Dior’s share in Asia-Pacific grew significantly, accounting for nearly 40% of luxury sales by 2026. Competitive benchmarking shows Dior maintaining higher average price realization compared to several competitors, reinforcing premium perception and brand loyalty.
Between 2020 and 2026, :contentReference[oaicite:0]{index=0} expanded its portfolio with limited editions, capsule collaborations, and seasonal launches. Efficient Dior Luxury Fashion Product Data Scraping enables tracking of SKU expansion, product availability, and assortment diversification across global e-commerce platforms.
Dior’s product count grew steadily, particularly in bags, ready-to-wear, and accessories. Leather goods contributed nearly 45% of total revenue by 2026, followed by apparel and footwear.
| Year | Total SKUs | Apparel (%) | Bags (%) | Accessories (%) |
|---|---|---|---|---|
| 2020 | 4,200 | 40 | 35 | 25 |
| 2021 | 4,600 | 39 | 37 | 24 |
| 2022 | 5,000 | 38 | 39 | 23 |
| 2023 | 5,400 | 37 | 41 | 22 |
| 2024 | 5,800 | 36 | 42 | 22 |
| 2025 | 6,200 | 35 | 44 | 21 |
| 2026 | 6,500 | 34 | 45 | 21 |
Data indicates Dior’s strategic shift toward high-margin leather goods. SKU rationalization and limited drops enhanced exclusivity while maximizing conversion rates across digital channels.
Tracking detailed performance across categories is critical for demand forecasting. Brands leveraging tools to Scrape Dior Apparel, Bags & Accessories Data gain visibility into new arrivals, stockouts, and replenishment cycles. Combined with Product Data Tracking, businesses can analyze demand spikes, seasonal shifts, and promotional timing.
Between 2020 and 2026, :contentReference[oaicite:0]{index=0}’s handbag segment experienced the highest growth rate, with an average CAGR of 8.5%. Apparel showed moderate but steady growth driven by fashion week launches and influencer marketing.
| Category | CAGR (%) | 2026 Revenue Share (%) |
|---|---|---|
| Bags | 8.5 | 45 |
| Apparel | 6.2 | 30 |
| Accessories | 5.4 | 15 |
| Footwear | 7.0 | 10 |
Data-driven monitoring allows companies to anticipate demand fluctuations and optimize inventory decisions. Dior’s stock rotation efficiency improved significantly post-2022, reducing overstock risks and improving sell-through rates globally.
Luxury pricing strategies vary across regions due to taxation, currency exchange, and import duties. Through systematic Dior Luxury Product Price Tracking, brands assess regional price disparities and cross-border arbitrage risks.
Between 2020 and 2026, :contentReference[oaicite:0]{index=0} implemented moderate annual price increases ranging between 4–7% globally. European markets maintained relatively stable pricing, while Asia-Pacific saw higher adjustments.
| Year | Europe | USA | Asia |
|---|---|---|---|
| 2020 | 3,200 | 3,400 | 3,600 |
| 2021 | 3,350 | 3,550 | 3,750 |
| 2022 | 3,550 | 3,750 | 3,950 |
| 2023 | 3,750 | 3,950 | 4,200 |
| 2024 | 3,950 | 4,150 | 4,450 |
| 2025 | 4,150 | 4,350 | 4,650 |
| 2026 | 4,350 | 4,550 | 4,850 |
Strategic price harmonization strengthened Dior’s margin protection while preserving brand prestige and perceived exclusivity.
Advanced Dior Luxury Fashion Product Intelligence frameworks analyze consumer reviews, sentiment analysis, and demand heatmaps. Social commerce and influencer-driven campaigns contributed to a 12% uplift in online engagement between 2022 and 2025.
By leveraging predictive models, brands identify high-performing SKUs and discontinue underperforming lines. :contentReference[oaicite:0]{index=0}’s digital engagement metrics improved consistently, supporting sustained brand relevance among Gen Z and Millennial consumers.
| Year | Online Traffic Growth (%) | Conversion Rate (%) |
|---|---|---|
| 2020 | 5 | 2.1 |
| 2021 | 8 | 2.4 |
| 2022 | 10 | 2.8 |
| 2023 | 12 | 3.1 |
| 2024 | 14 | 3.4 |
| 2025 | 15 | 3.7 |
| 2026 | 17 | 4.0 |
Consumer-centric insights enable faster go-to-market decisions and enhanced personalization strategies.
Understanding top-performing SKUs is essential for revenue maximization. Through Dior Best Selling Product Analytics, brands identify consistent high-demand collections such as Lady Dior bags and limited-edition releases.
Additionally, MAP Monitoring ensures price compliance across online marketplaces, protecting brand value and preventing unauthorized discounting.
| Category | Bestseller Share (%) | Avg. Sell-Through (%) |
|---|---|---|
| Bags | 38 | 85 |
| Apparel | 25 | 78 |
| Accessories | 20 | 75 |
| Footwear | 17 | 72 |
Data-driven bestseller identification supports targeted marketing and optimized restocking strategies. :contentReference[oaicite:0]{index=0}’s compliance monitoring reduced unauthorized pricing violations by an estimated 18% between 2023 and 2026.
Actowiz Metrics provides end-to-end E-commerce Analytics solutions designed to deliver actionable insights across luxury retail ecosystems. Our expertise in Dior Luxury Fashion Market Analysis ensures precise data collection, advanced modeling, and strategic interpretation tailored to competitive luxury markets.
We empower brands, retailers, and market intelligence teams with accurate product tracking, competitor benchmarking, pricing analytics, and predictive forecasting models. Our scalable solutions support global operations with real-time dashboards and custom data pipelines, enabling businesses to respond proactively to market shifts and emerging trends.
The global luxury fashion landscape is evolving rapidly, and Dior continues to maintain strong competitive positioning through pricing discipline, product innovation, and digital excellence. Leveraging structured analytics and intelligence frameworks is critical for brands aiming to sustain growth between 2020 and 2026.
With advanced Digital Shelf Analytics, businesses gain comprehensive visibility into pricing, availability, assortment, and competitor activity across online channels.
Partner with Actowiz Metrics today to transform luxury fashion data into strategic growth opportunities!

Whatever your project size is, we will handle it well with all the standards fulfilled! We are here to give 100% satisfaction.
Any analytics feature you need — we provide it
24/7 global support
Real-time analytics dashboard
Full data transparency at every stage
Customized solutions to achieve your data analysis goals