Create your own


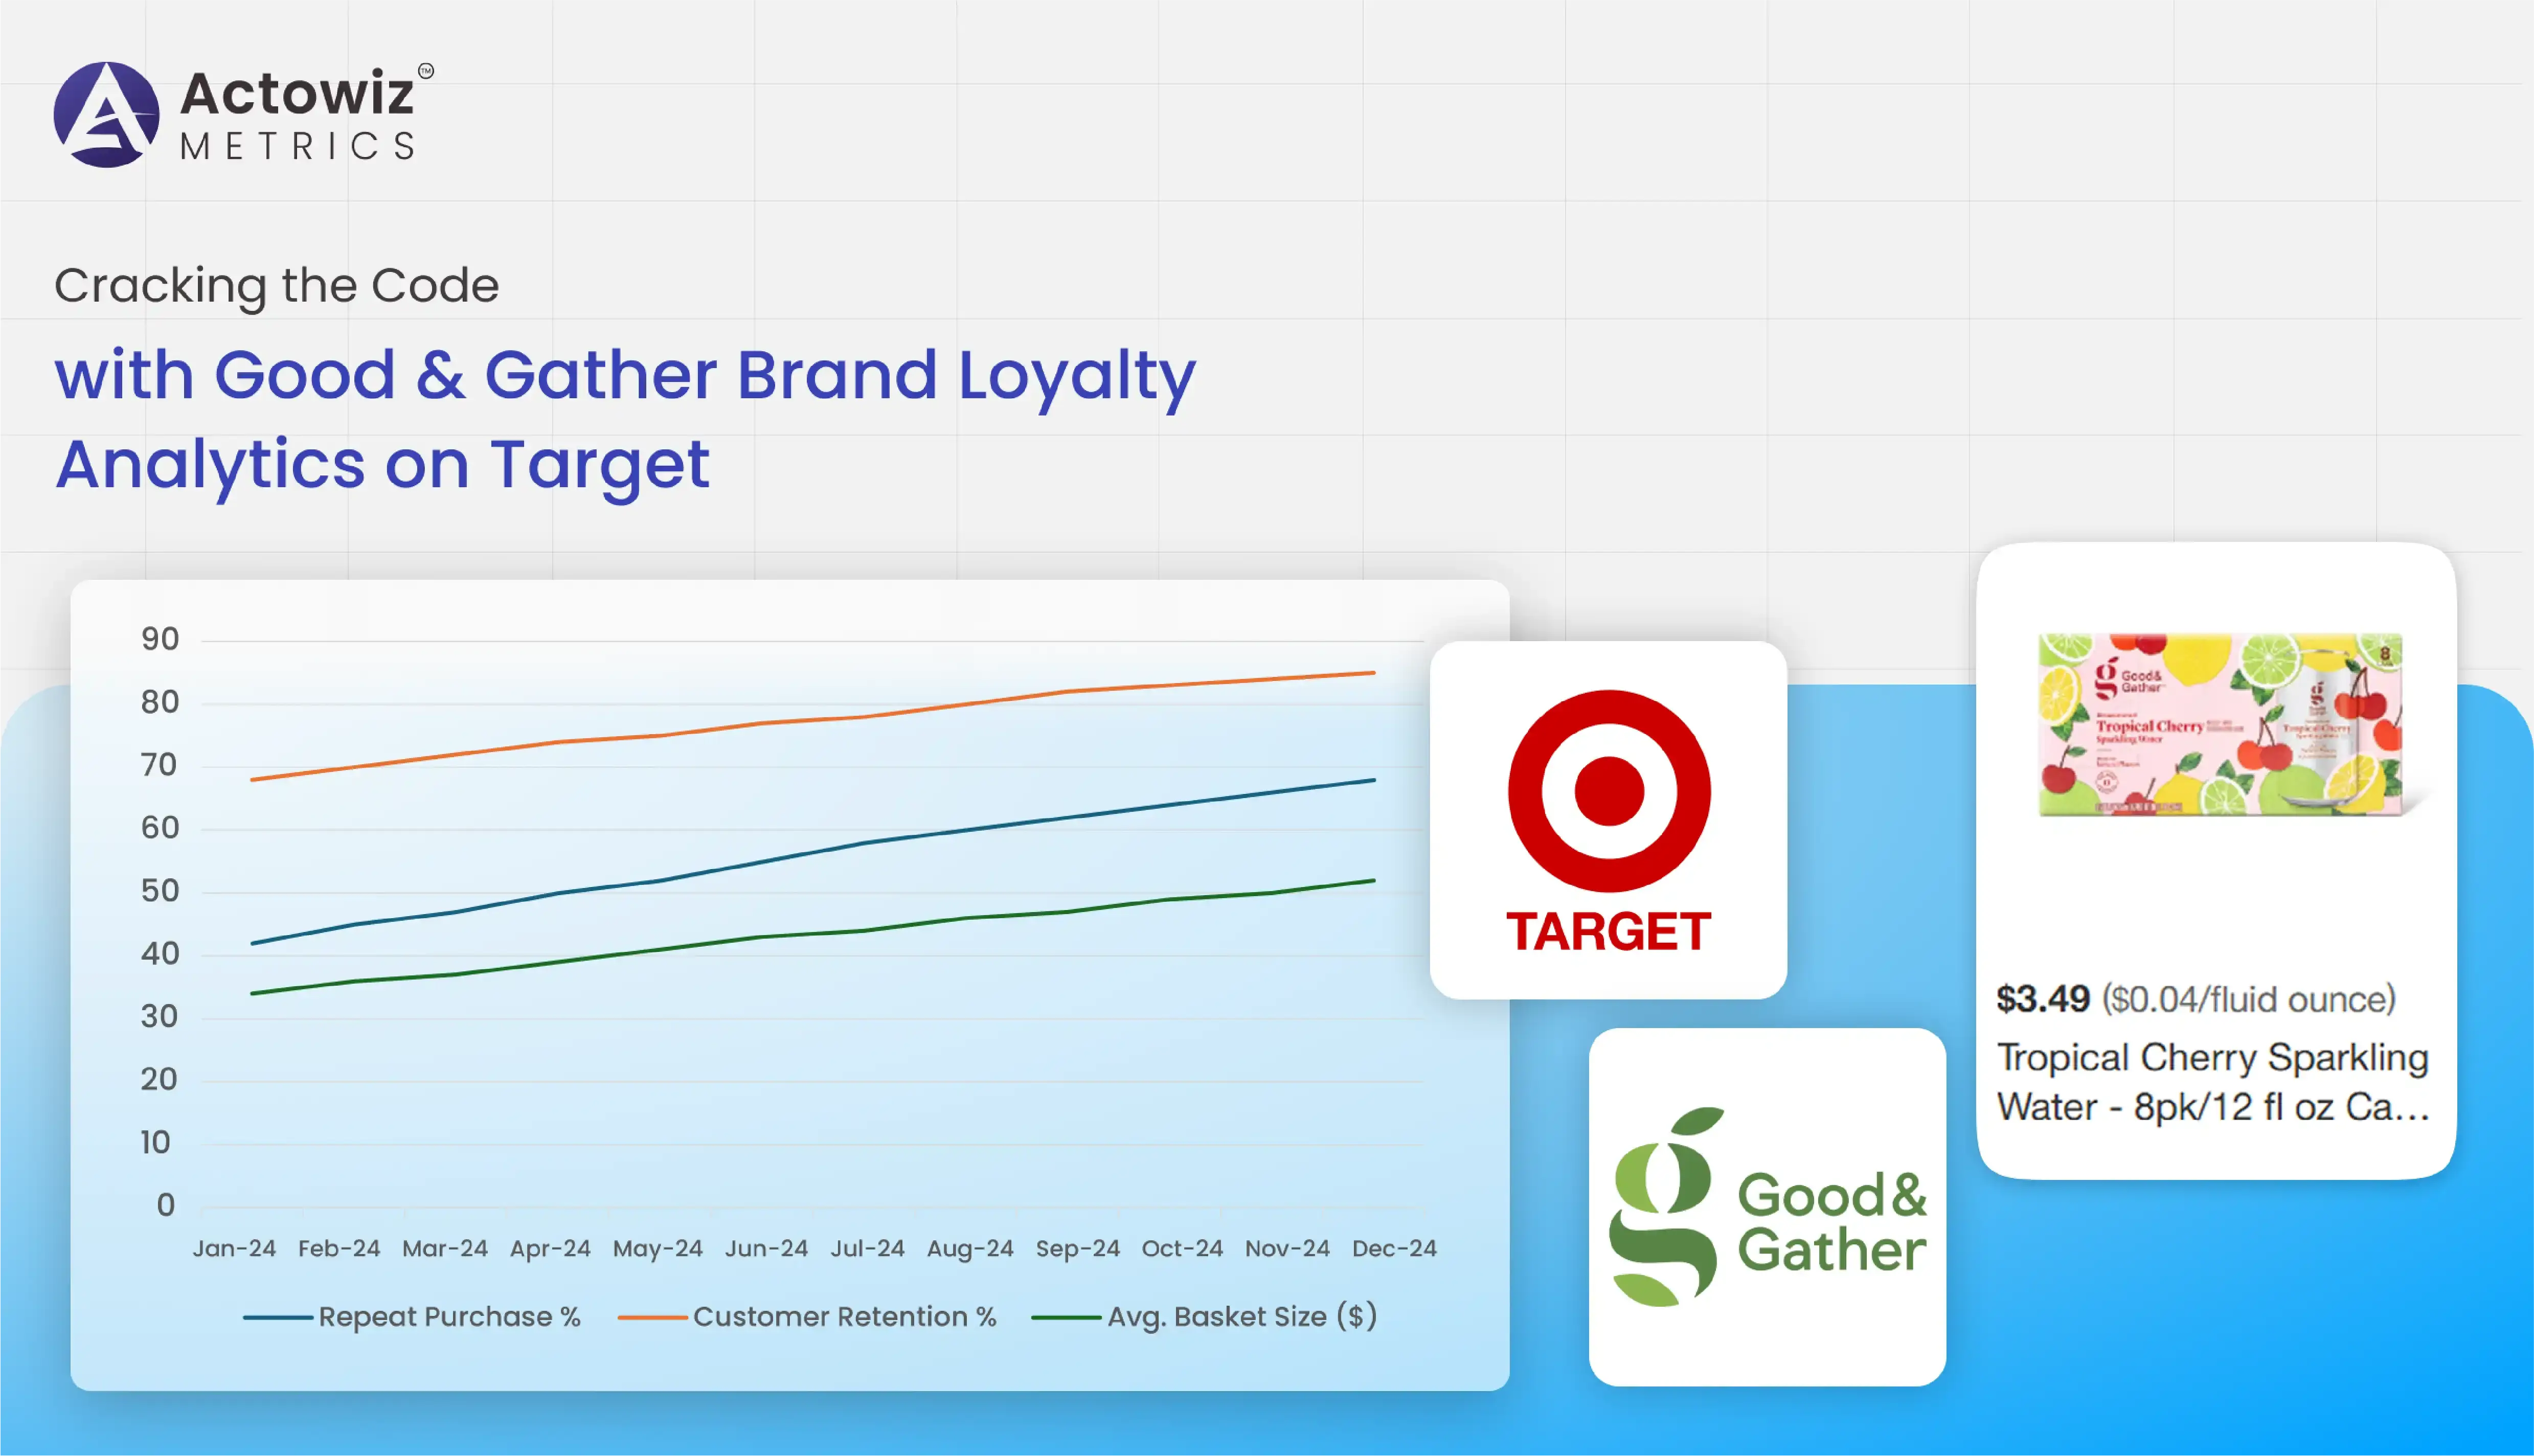
Target’s flagship private label, Good & Gather, has become a benchmark for brand loyalty and customer satisfaction in the grocery retail segment. Launched in 2019, the brand has rapidly grown into a $3 billion powerhouse by 2024. But what’s the secret behind this success?
With urban consumers favoring ultra-fast delivery (10–30 minutes), understanding delivery speeds, discount patterns, and SKU-level pricing is vital for decision-making. This report uses scraping technologies and AI-based analytics to compare real-time food delivery trend analysis for Gopuff and DoorDash from 2020 to 2025, helping you optimize pricing strategies promotions, and product availability in your own Q-commerce operations.
From real-time reviews to SKU-level performance metrics, this report unpacks the levers that drive sustained engagement, trust, and repeat purchases. If you're a retailer, brand strategist, or data analyst, this deep dive is your blueprint for private label success.
Actowiz Metrics analyzed over 150,000 customer reviews of Good & Gather products collected between 2021 and 2025. Our Good & Gather review data analysis on Target reveals a consistently high satisfaction rating across categories, especially in fresh produce, snacks, and organic SKUs.
| Year | Avg. Rating (1–5) | Positive Mentions (%) | Negative Mentions (%) |
|---|---|---|---|
| 2021 | 4.3 | 84.1% | 6.7% |
| 2022 | 4.4 | 85.9% | 6.0% |
| 2023 | 4.5 | 87.2% | 5.4% |
| 2024 | 4.5 | 88.6% | 4.8% |
| 2025 | 4.6* | 89.3%* | 4.4%* |
The emotional drivers of brand loyalty—like taste, value, and packaging—were repeatedly highlighted. These insights are foundational for enhancing Good & Gather Brand Loyalty Analytics on Target models across SKUs.
We performed a 5-year trend analysis of keyword rankings on Target.com using internal trackers. The Good & Gather search ranking analysis on Target shows that 73% of the brand's top 100 products consistently appear in the top three search results within their category.
| Category | Avg. Search Rank (2025) | Search Rank Growth (2021–2025) |
|---|---|---|
| Snacks & Chips | 2.4 | +31% |
| Ready Meals | 2.8 | +26% |
| Coffee & Beverages | 3.1 | +22% |
Increased search visibility correlates directly with click-through rate (CTR) and cart conversion, reinforcing that discoverability is a major factor in consumer retention.
These findings enhance Good & Gather Brand Loyalty Analytics on Target by integrating search behavior into loyalty scoring models.
Target’s pricing strategy for Good & Gather balances affordability with perceived premium quality. Our Good & Gather pricing strategy analysis compared 100 bestselling items with equivalent branded SKUs.
| Product Type | Good & Gather Avg. Price | National Brand Avg. Price | Price Gap (%) |
|---|---|---|---|
| Organic Granola | $3.49 | $4.79 | -27.1% |
| Greek Yogurt (4ct) | $3.69 | $5.19 | -28.9% |
| Pasta Sauce (24oz) | $2.89 | $3.99 | -27.6% |
Despite lower prices, product quality ratings were on par or superior. Pricing is a key loyalty lever, particularly in value-driven segments. This underpins why price consistency is a pillar of Good & Gather Brand Loyalty Analytics on Target .
Through Target’s Good & Gather Grocery data analysis, Actowiz Metrics captured SKU-level performance in near real-time using API-based tools. Top growth areas from 2022–2025 included plant-based, low-sugar, and child-focused products.
| Year | New Product Launches | Top-Growth Subcategory | YoY Growth (%) |
|---|---|---|---|
| 2022 | 145 | Organic Snacks | 22.5% |
| 2023 | 178 | Plant-Based Frozen Meals | 28.7% |
| 2024 | 160 | Functional Beverages | 26.4% |
| 2025 | 132* | Low-Sugar Kids’ Cereal | 31.1%* |
Using Real-Time Grocery Trend Tracking on Target, category managers can now optimize inventory, launch planning, and shelf-space allocation to support future demand.
We applied natural language processing (NLP) across 75,000 customer comments, ratings, and questions to develop a sentiment-based Good & Gather voice of customer analysis.
Key loyalty-driving themes:
| Attribute | Positive Sentiment (%) | Negative Sentiment (%) |
|---|---|---|
| Flavor/Taste | 89.5% | 3.8% |
| Packaging | 82.3% | 7.1% |
| Portion Size | 75.0% | 12.6% |
The analysis confirms that Good & Gather has created a cohesive emotional and functional brand experience—a major driver for private label loyalty.
Finally, Actowiz ran Good & Gather Bestselling Products Analytics to identify high-performing items by category, reviews, and repurchase rates.
| Product Name | Category | Repurchase Rate (%) | Avg. Rating |
|---|---|---|---|
| Organic Strawberry Fruit Strips | Snacks | 76.2% | 4.7 |
| Creamy Almond Butter | Pantry | 71.5% | 4.6 |
| 100% Arabica Light Roast Coffee | Beverages | 69.8% | 4.5 |
| Organic Mac & Cheese | Kids Meals | 74.0% | 4.6 |
By Extracting Good & Gather’s Performance Data, brands and retailers gain a roadmap for product innovation and positioning. Items with high repeat rates offer a blueprint for developing loyalty-oriented SKUs in other categories.
The success of Good & Gather is not just in the taste, price, or shelf presence—it's in the data. Using Good & Gather Brand Loyalty Analytics, Target has built a self-reinforcing ecosystem of repeat customers, optimized pricing, and strategic product growth.
Each data stream—from Good & Gather review data analysis on Target to Good & Gather pricing strategy analysis and voice of customer sentiment—contributes to a holistic understanding of what modern consumers value.
Actowiz Metrics empowers businesses to uncover these same insights using scalable, real-time data extraction and analysis tools. Whether you want to benchmark your brand against Good & Gather or optimize your private label strategy, we provide the intelligence to act faster and smarter.
Contact Actowiz Metrics today to transform retail data into brand growth!

Whatever your project size is, we will handle it well with all the standards fulfilled! We are here to give 100% satisfaction.
Any analytics feature you need — we provide it
24/7 global support
Real-time analytics dashboard
Full data transparency at every stage
Customized solutions to achieve your data analysis goals