Create your own


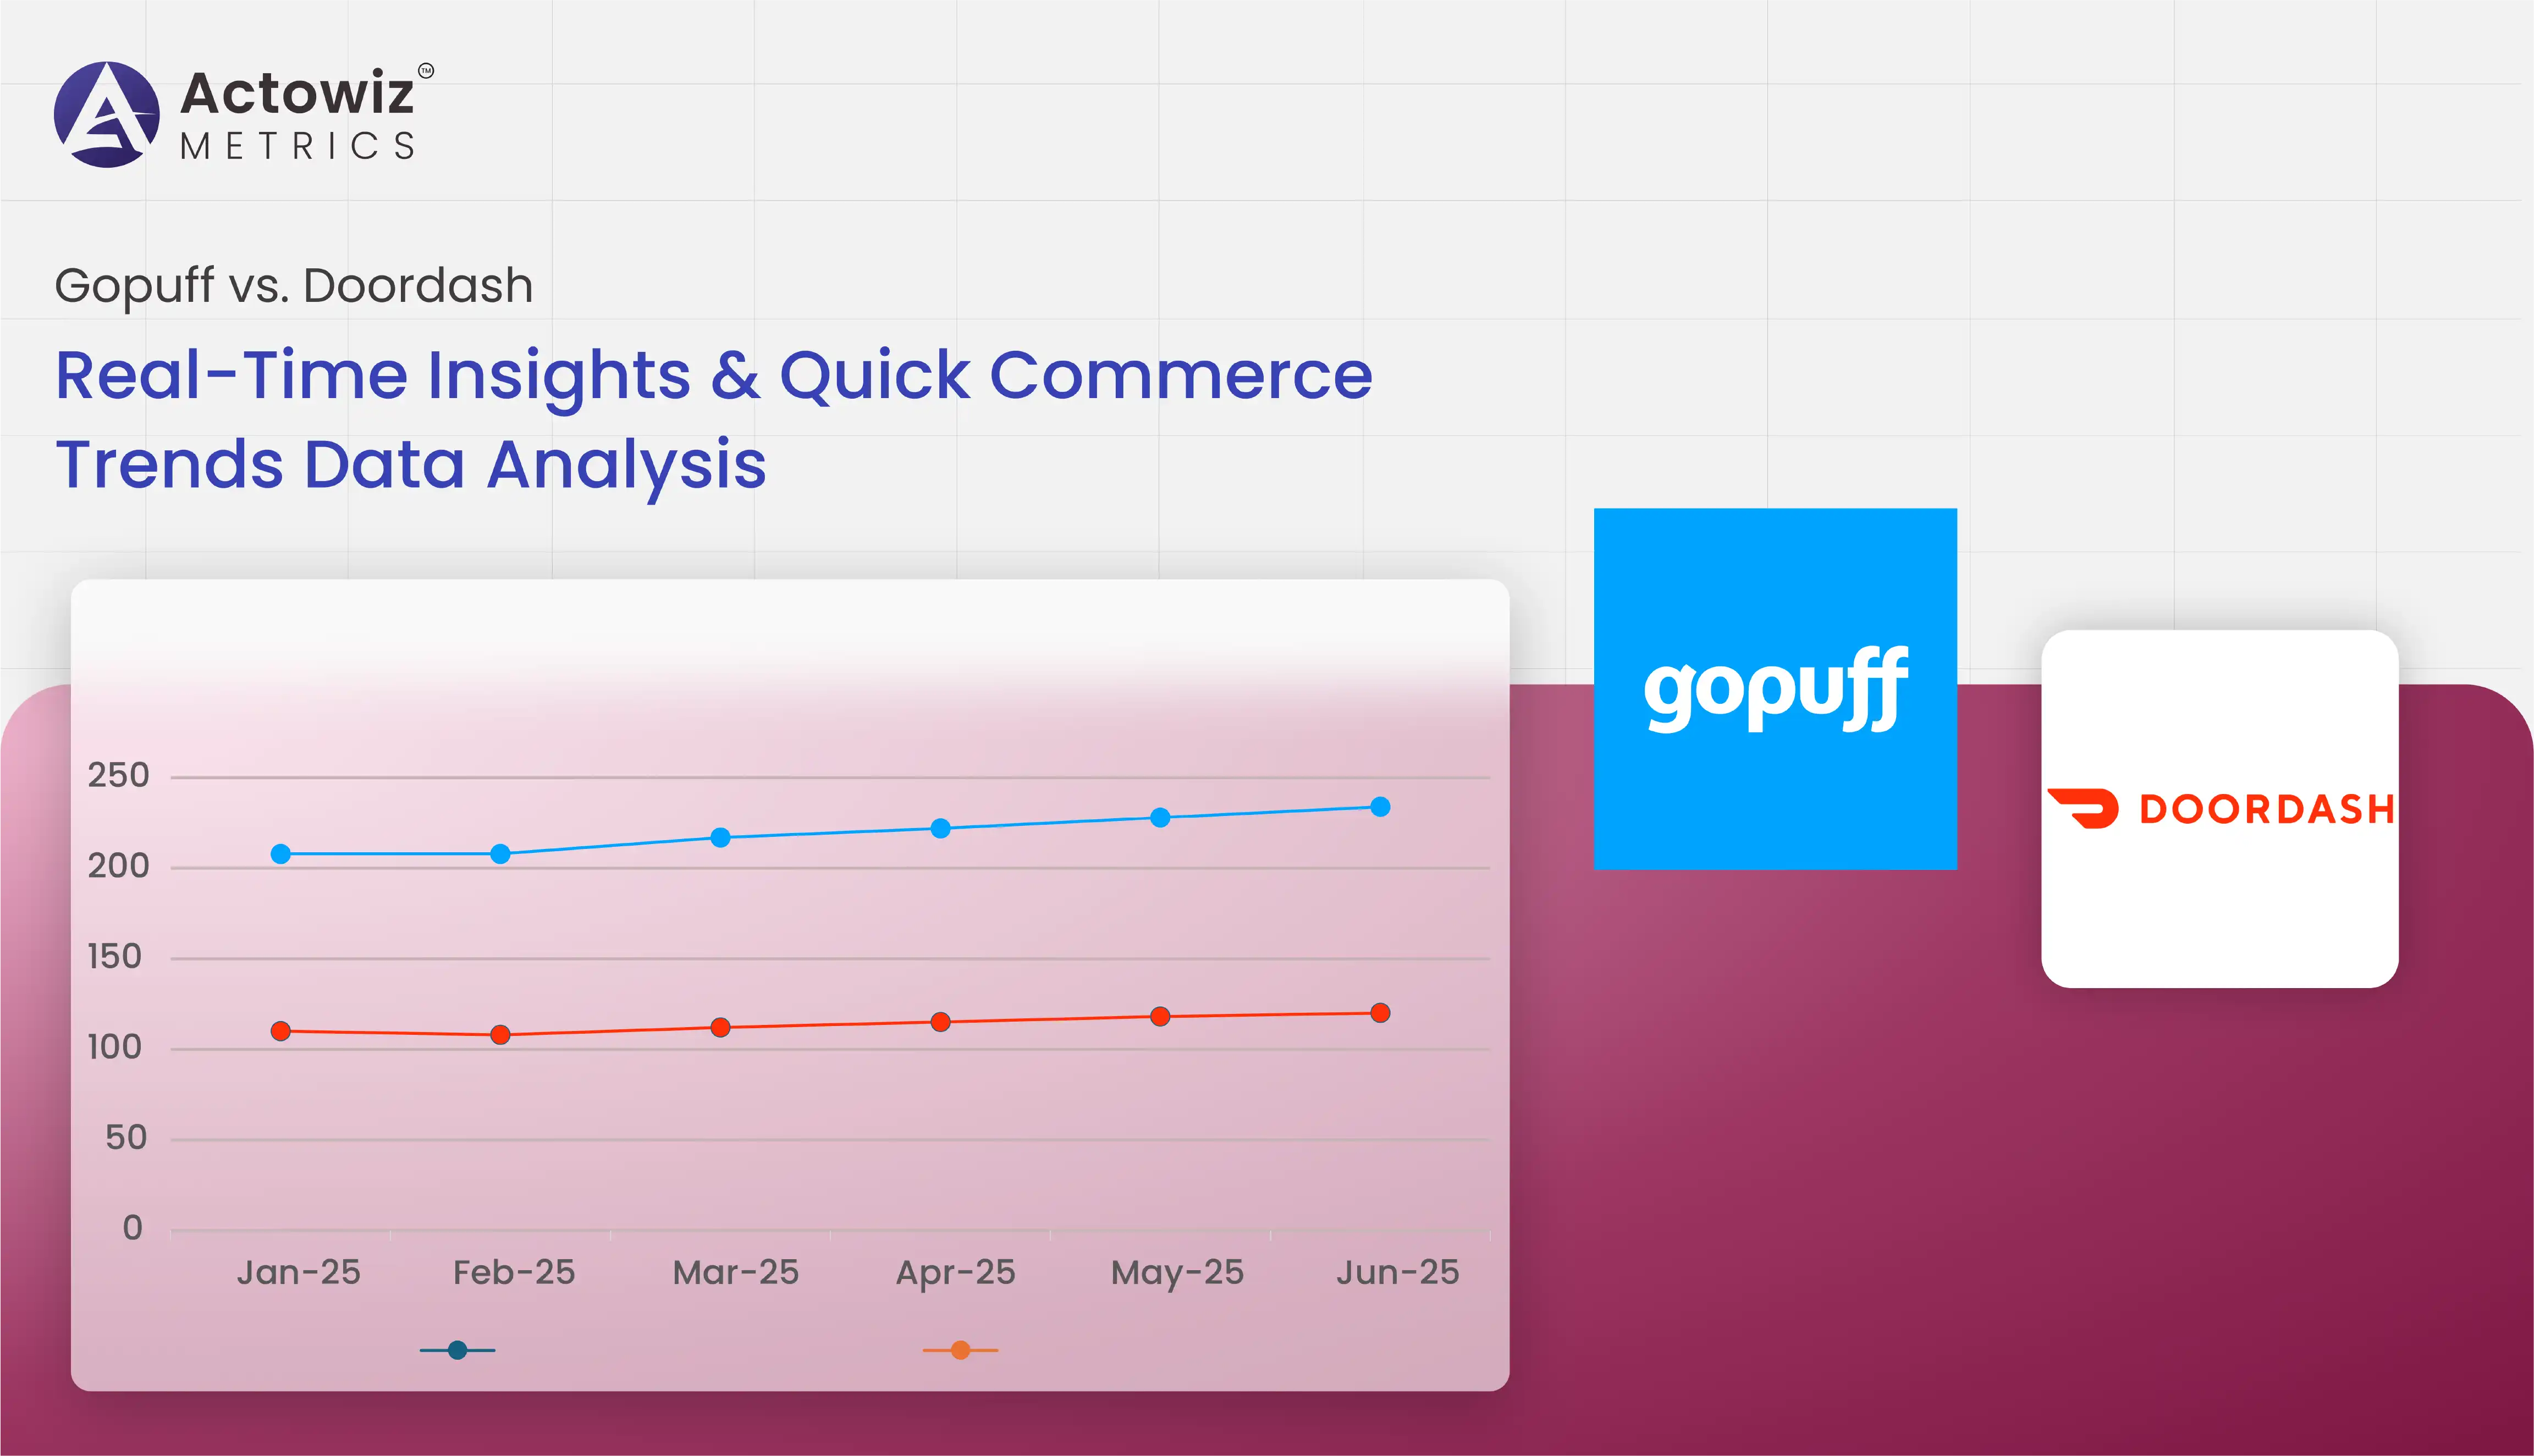
The explosive rise of hyperlocal delivery platforms has transformed the way consumers access groceries, meals, and daily essentials. Among the top competitors in this dynamic space are Gopuff and DoorDash, each shaping distinct user experiences in the U.S. market. This Quick commerce Trends Data Analysis explores real-time insights across pricing, availability, product assortment, and promotions on both platforms, offering retailers and data-driven brands a comparative edge.
With urban consumers favoring ultra-fast delivery (10–30 minutes), understanding delivery speeds, discount patterns, and SKU-level pricing is vital for decision-making. This report uses scraping technologies and AI-based analytics to compare real-time food delivery trend analysis for Gopuff and DoorDash from 2020 to 2025, helping you optimize pricing strategies, promotions, and product availability in your own Q-commerce operations.
In the quick commerce landscape, delivery time and service reliability are critical KPIs. Real-time Q-commerce analytics tracks average delivery speeds, order volumes, and active service zones.
| Year | Gopuff | DoorDash |
|---|---|---|
| 2020 | 29 | 35 |
| 2021 | 24 | 31 |
| 2022 | 21 | 29 |
| 2023 | 19 | 26 |
| 2024 | 18 | 24 |
| 2025 | 16 | 22 |
Gopuff has invested in micro-fulfillment centers, reducing delivery times by over 44% from 2020–2025. DoorDash has improved by 37% via third-party dark store integrations. These delivery insights form the backbone of competitive benchmarking.
Promotions are central to driving conversion and retention. Our DoorDash discount trend analysis observed a 22% rise in promo code usage year-over-year since 2020.
| Year | Avg. Discount (%) | Promo Usage Growth (%) |
|---|---|---|
| 2020 | 8.5 | - |
| 2021 | 10.1 | 18% |
| 2022 | 11.3 | 21% |
| 2023 | 13.7 | 25% |
| 2024 | 14.9 | 27% |
| 2025 | 15.8 | 29% |
Users in metro regions favored bulk discount offers and delivery fee waivers. Brands can use this data to align their own pricing engine via SKU-Level Pricing Analysis.
With scraping techniques, brands can scrape GoPuff delivery data for insights into price fluctuation, product bundling, and hyperlocal availability. For example, Gopuff’s beverage category saw a 34% sales increase during weekend evenings across 2023.
| Category | 2020 | 2021 | 2022 | 2023 | 2024 | 2025 (Proj.) |
|---|---|---|---|---|---|---|
| Snacks | 100 | 128 | 145 | 160 | 176 | 190 |
| Beverages | 100 | 134 | 155 | 180 | 198 | 210 |
| Personal Care | 100 | 115 | 130 | 142 | 158 | 172 |
Using GoPuff pricing data analysis, pricing strategies can be adjusted based on demand by category, day-part, or delivery zone.
Tracking urban vs. suburban demand reveals how convenience drives growth. We use advanced methods to monitor hyperlocal delivery trends in real time for both platforms.
| City | Gopuff Penetration (%) | DoorDash Penetration (%) |
|---|---|---|
| New York | 78 | 91 |
| Los Angeles | 65 | 86 |
| Chicago | 72 | 83 |
| Houston | 61 | 79 |
| Seattle | 55 | 77 |
Online grocery delivery trends show increasing weekend peaks and weekday lunch orders. Smart dashboards built using Quick Commerce Trends Data Scraping can surface these local shifts.
Out-of-stock rates significantly impact conversion. By deploying real-time DoorDash product availability tracking, we identified 11% fewer SKUs in stock during peak hours in 2024.
| Year | % SKUs In-Stock |
|---|---|
| 2020 | 87% |
| 2021 | 89% |
| 2022 | 85% |
| 2023 | 84% |
| 2024 | 82% |
| 2025 | 85% (Projected) |
Retailers can reduce missed sales by pairing this data with AI-Powered Grocery Data Analytics to pre-empt demand spikes and optimize last-mile inventory.
Comparative analytics helps brands benchmark their Q-commerce readiness. This Grocery Store Trends analysis considers delivery speed, SKU availability, discount usage, and user ratings.
| Metric | Gopuff (2025) | DoorDash (2025) |
|---|---|---|
| Delivery Speed | 9.2 | 8.7 |
| SKU Availability | 8.5 | 7.9 |
| Discount Usage Effect | 8.3 | 9.1 |
| User Retention | 8.8 | 9.3 |
Insights from this Quick commerce Trends Data Analysis can guide marketing, logistics, and tech teams in improving market share and retention.
This research underscores the competitive dynamics of the Q-commerce space, where speed, availability, and discounts converge to shape customer preferences. Gopuff and DoorDash have leveraged different strengths: Gopuff with its micro-fulfillment centers and niche assortment, and DoorDash through vast restaurant and convenience integrations.
Using Quick commerce Trends Data Analysis, brands can harness these insights to craft pricing, promotion, and inventory strategies at a hyperlocal level. From real-time Q-commerce analytics to DoorDash discount trend analysis, the data speaks clearly—growth lies in personalization, speed, and operational agility.
Let Actowiz Metrics help you stay ahead with customized Q-commerce data solutions, including GoPuff pricing data analysis, DoorDash product availability tracking, and Quick Commerce Trends Data Scraping.
Contact Actowiz Metrics today to get a competitive edge with real-time grocery delivery analytics tailored for your business.

Whatever your project size is, we will handle it well with all the standards fulfilled! We are here to give 100% satisfaction.
Any analytics feature you need — we provide it
24/7 global support
Real-time analytics dashboard
Full data transparency at every stage
Customized solutions to achieve your data analysis goals