Create your own


The global health and wellness industry has undergone an accelerated transformation over the past five years, driven by changing consumer habits, digital retail adoption, and rising demand for clean, sustainable, immunity-boosting, and personalized nutrition solutions. Brands entering this space face fierce competition, with success depending on strategic insights derived from marketplace intelligence. Modern category leaders rely heavily on Health & Wellness Product Trend Analytics to detect emerging brands, analyze pricing shifts, benchmark product performance, and identify category gaps before competitors exploit them. As online marketplaces become primary discovery engines, real-time analytics empower companies to evaluate innovation velocity across supplements, personal care, organic food, wellness beverages, and fitness wearables. This research report explores how systematic data monitoring helps brands anticipate buying behavior, measure product traction, uncover viral brand moments, and build informed go-to-market strategies.
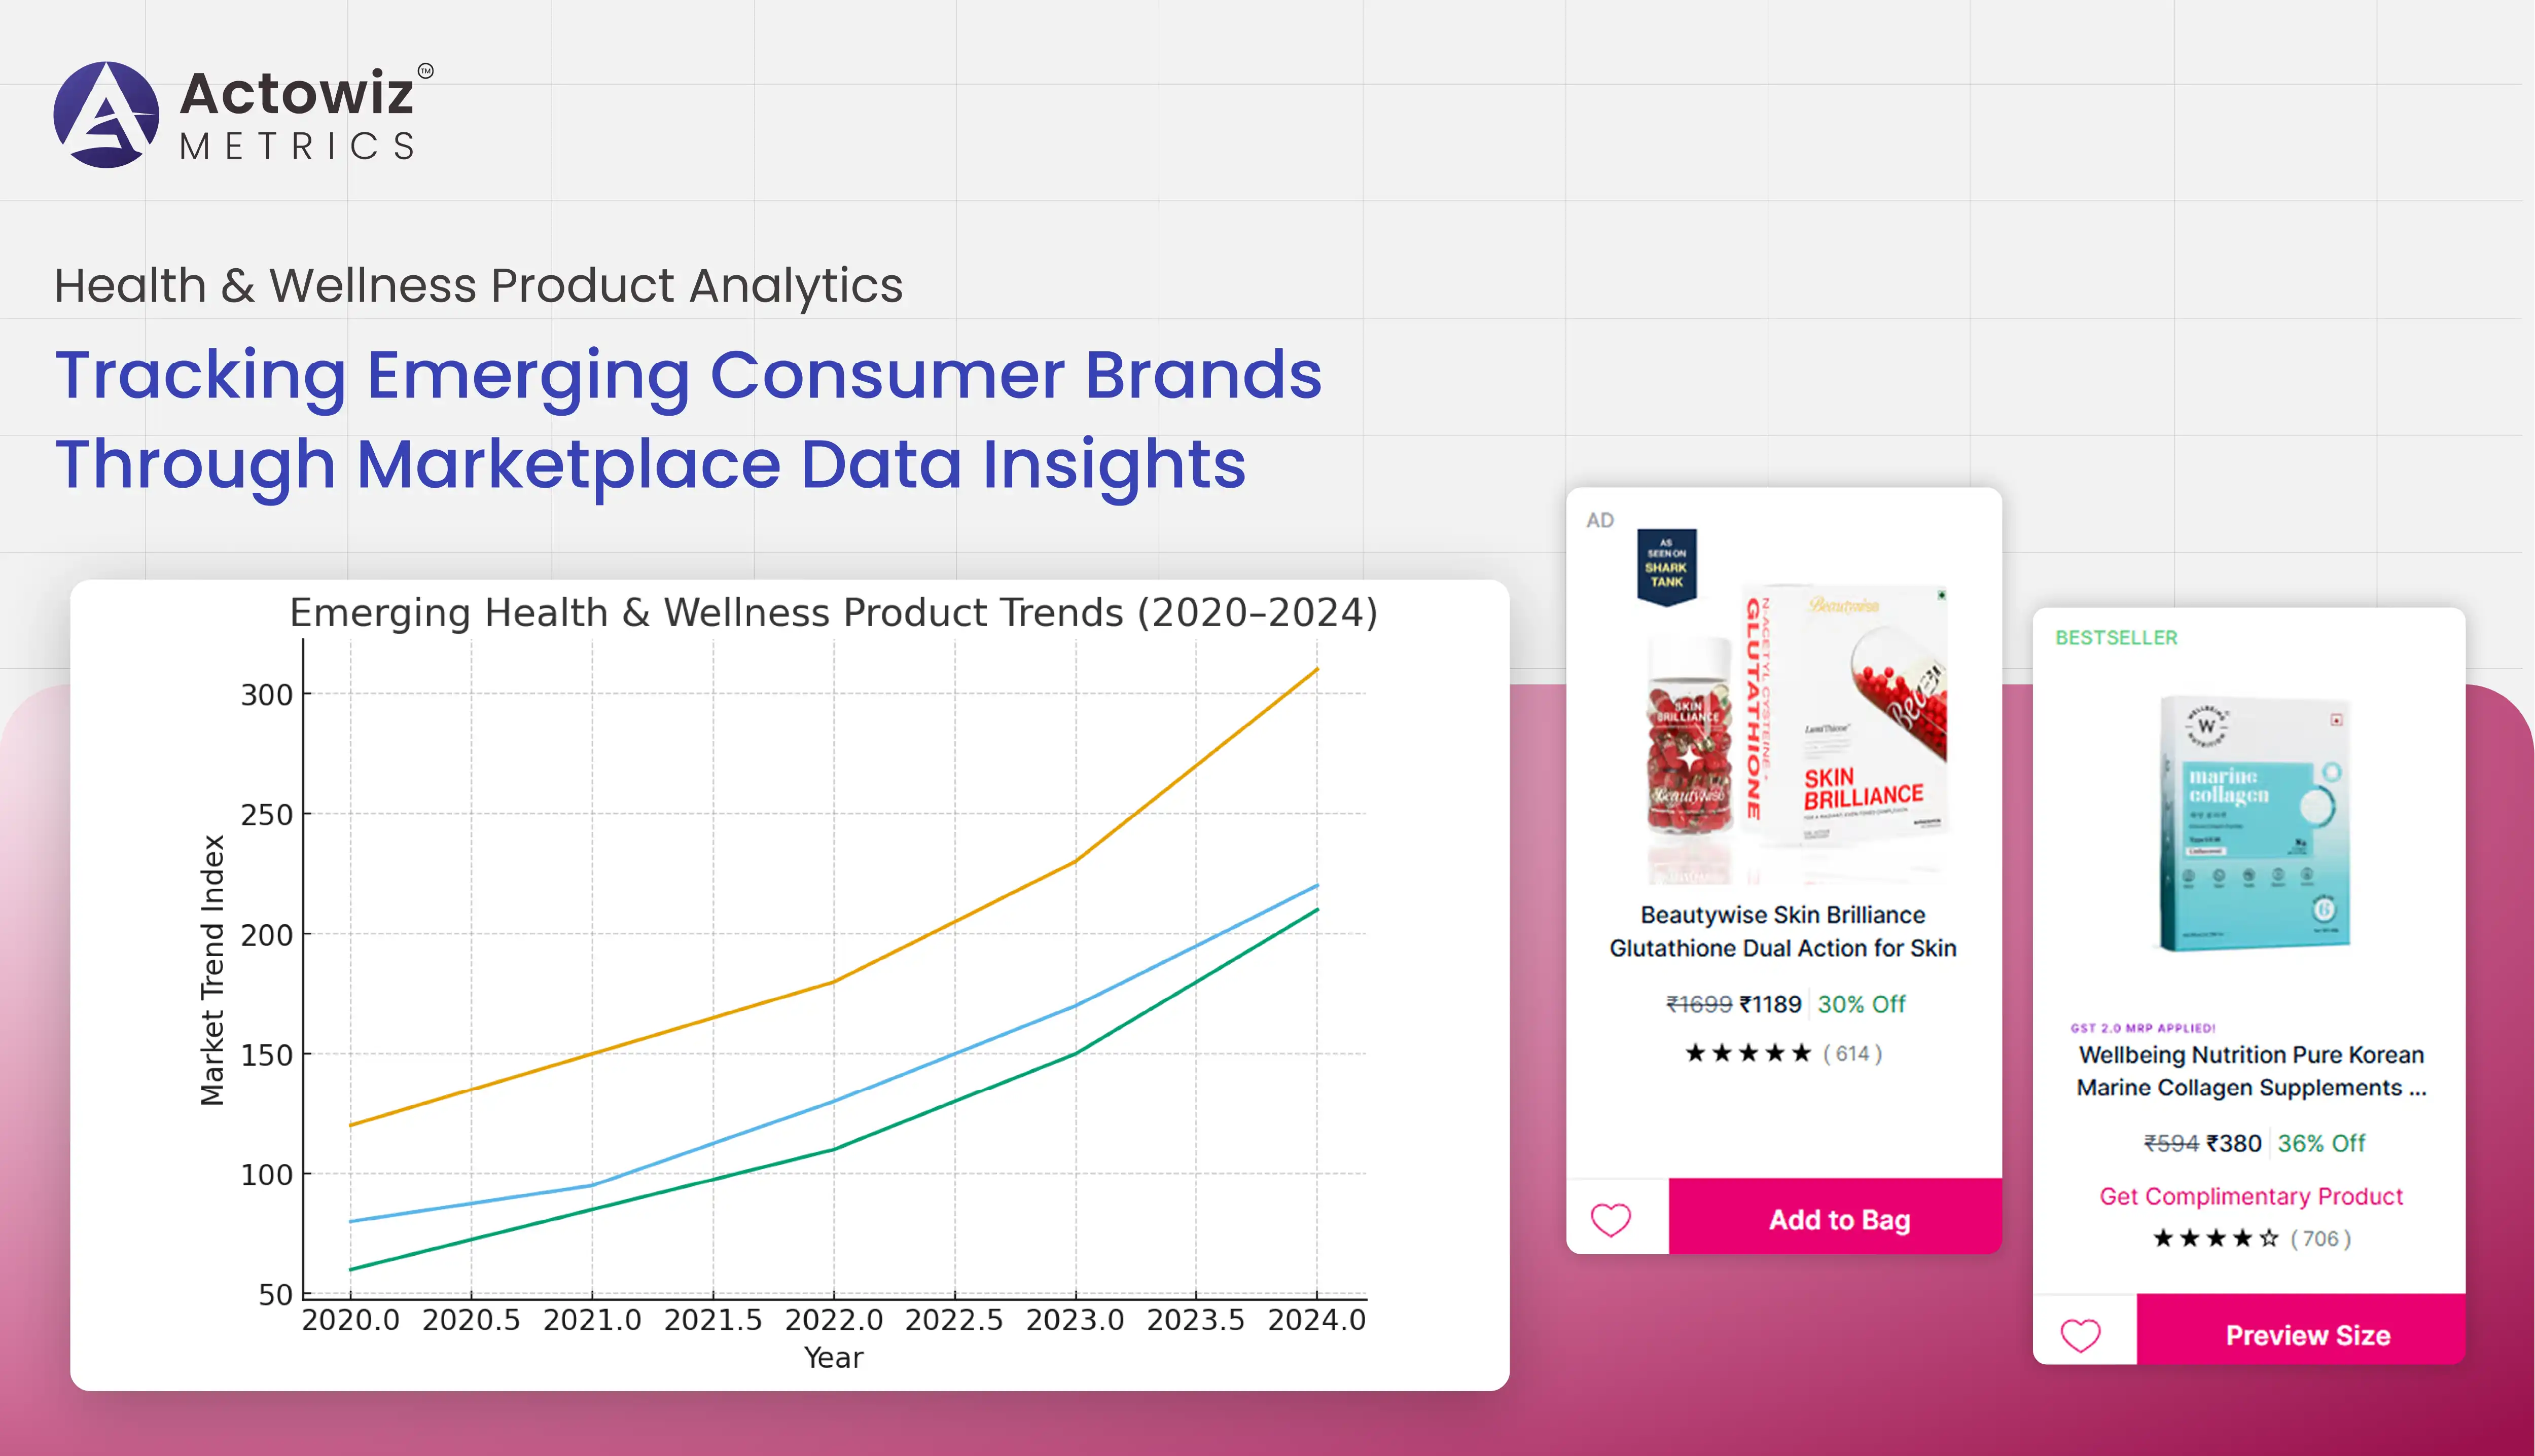
Marketplace ecosystems have become critical discovery channels for new brands. Platforms such as Amazon, Walmart, Flipkart, iHerb, and niche nutrition stores have witnessed a massive surge in wellness product listings, with new brands appearing at three times the rate observed in 2018. Businesses increasingly rely on the ability to Scrape Health & Wellness Product Data across categories such as immunity supplements, vegan snacks, adaptogenic beverages, fitness wearables, organic skincare, and clean-label personal care essentials. Accurate Product Data Tracking enables marketers to observe SKU lifecycle behavior, identify brands gaining traction, and distinguish between short-lived fads and long-term categories.
| Year | Listings Growth % | New Brands Added | Avg. SKU Expansion Rate |
|---|---|---|---|
| 2020 | 11% | 3,200 | 1.5x |
| 2021 | 18% | 5,600 | 2.1x |
| 2022 | 27% | 8,400 | 2.8x |
| 2023 | 34% | 11,900 | 3.2x |
| 2024 | 41% | 16,700 | 4.1x |
| 2025* | 47% (proj.) | 22,300 (proj.) | 5.0x (proj.) |
These trends highlight a market where data-driven intelligence is no longer optional—it is the only scalable method to identify rising competitors before they achieve brand saturation.
The rapid growth of wellness brands has intensified pricing competition, forcing manufacturers to optimize pricing strategies while maintaining margins. With hundreds of SKUs launching every month, monitoring prices manually is not feasible. Automated Health & Wellness Product Competitor Price Scraping allows brands to collect real-time pricing visibility across channels and examine promotional patterns, seasonal fluctuations, and price drops triggered by subscription models or influencer-driven spikes. This data often reveals gaps where premium products underperform due to poor positioning or where budget competitors gain traction through bundle pricing.
| Category | 2020 Avg Price | 2023 Avg Price | 2025 Projected | Change Trend |
|---|---|---|---|---|
| Supplement Powders | $26 | $33 | $41 | +58% |
| Vegan Snacks | $8 | $11 | $14 | +75% |
| Protein Bars | $12 | $15 | $20 | +67% |
| Organic Skincare | $19 | $26 | $35 | +84% |
| Smart Wearables | $69 | $112 | $169 | +145% |
Brands that monitor marketplace pricing signals consistently achieve higher conversions. Those lacking real-time tracking lose out during promotional shifts.
The exponential growth of digital commerce has elevated the role of accurate, competitive price visibility. With multiple global channels influencing consumer decisions, brands now rely on Health & Wellness Product Pricing Data Extraction to prevent margin dilution and understand the revenue threshold consumers tolerate for premium positioning. Data shows that consumers are willing to pay 20–45% more for ‘clean label,’ organic-certified, vegan, or functional wellness attributes.
| Attribute Type | Avg Premium Willingness | Conversion Increase When Highlighted |
|---|---|---|
| Organic-certified | +42% | +19% |
| Vegan-friendly | +33% | +23% |
| Gluten-free | +21% | +14% |
| Adaptogenic blends | +47% | +28% |
This dataset proves that optimized pricing is not solely cost-driven—it is perception-driven. Brands equipped with timely price extraction data outperform legacy competitors still operating without marketplace intelligence.
Consumer demand in health and wellness markets is evolving rapidly, driven by social media influence, microbiome research, longevity science, and functional nutrition. Brands now utilize Health & Wellness Product Trend Tracking to understand keyword surges, bestselling SKUs, ingredient adoption cycles, and consumer sentiment sentiment trajectories. Trend tracking reveals the golden-buying window—where demand rises before incumbents enter.
| Category | Trend Surge % | Top Growth Drivers |
|---|---|---|
| Probiotic Gummies | 311% | Gut health, TikTok virality |
| Mushroom Coffee | 489% | Adaptogens, performance culture |
| Collagen Peptides | 272% | Beauty-from-within demand |
| Nootropic Drinks | 562% | Cognitive performance narratives |
Brands ignoring trend analytics struggle while data-driven entrants dominate emerging categories.
High-growth brands leverage E-commerce Analytics to uncover SKU performance segmentation, inventory behaviors, cross-selling triggers, and the influence of product visuals and reviews on conversions. The online marketplace is now the world’s most measurable retail environment—one that rewards brands with intelligent execution frameworks.
| Year | % Online Purchases | Major Buying Driver |
|---|---|---|
| 2020 | 31% | Pandemic push |
| 2022 | 45% | Convenience, faster delivery |
| 2025* | 61% (proj.) | AI-driven discovery |
Brands that embrace analytics evolve. Brands that don’t, disappear.
The digital shelf is today’s storefront. Successful brands utilize Digital Shelf Analytics to evaluate share-of-search, visual consistency, brand placement, and keyword ranking speed. Performance on the digital shelf correlates more strongly with sales than legacy advertising.
| Metric | 2020 Impact | 2025 Projected Impact |
|---|---|---|
| SEO ranking | 42% | 63% |
| Reviews volume | 57% | 78% |
| Image quality | 36% | 55% |
Winning brands treat their product listings as revenue engines—not static catalogs.
Actowiz Metrics is a global data intelligence partner trusted by health and wellness leaders who rely on accurate pricing, category tracking, and brand movement insights. Our proprietary engines deliver unmatched Price Benchmarking capabilities, enabling brands to outmaneuver competitors using quantified signals, not instinct. Clients choose Actowiz Metrics because our frameworks transform raw marketplace signals into predictable growth strategies anchored in Health & Wellness Product Trend Analytics. From automated SKU-level insights to demand forecasting, discount detection, and retail shelf scoring, our solutions eliminate guesswork and empower evidence-driven decisions. Brands using Actowiz outperform competitors who still operate blindly.
The health and wellness marketplace is expanding faster than any traditional retail segment. Brands that harness real-time analytics, predictive intelligence, and SKU-level performance signals will dominate emerging niches, attract new-age consumers, and reshape industry benchmarks. As shown throughout this report, success now depends on real-time decision-making enabled by Health & Wellness Product Trend Analytics and quantifiable Brand Competition Analysis frameworks. Leaders are no longer waiting for retail feedback—they are analyzing it and reacting instantly. Ready to unlock marketplace dominance? Let Actowiz Metrics turn your wellness product visibility into measurable growth.

Whatever your project size is, we will handle it well with all the standards fulfilled! We are here to give 100% satisfaction.
Any analytics feature you need — we provide it
24/7 global support
Real-time analytics dashboard
Full data transparency at every stage
Customized solutions to achieve your data analysis goals