Create your own


Pizza is one of the UK’s most ordered foods, and platforms like Just Eat and Uber Eats are central to Londoners’ takeaway habits. But with rising delivery costs, service charges, and inconsistent offers, which app gives better value when it comes to pizza?
In this case study, Actowiz Metrics scrapes and compares live pizza prices, delivery fees, restaurant ratings, and discounted offers from Just Eat and Uber Eats in London.
To determine:
| Data Point | Description |
|---|---|
| Restaurant Name | Listed pizza vendor (e.g., Pizza Union, Firezza, Domino’s) |
| Pizza Item | Margherita, Pepperoni, Vegan Special, etc. |
| Base Price (£) | Pre-tax food price |
| Delivery Fee (£) | Fee based on distance or fixed by platform |
| Service Fee/Markup (£) | Platform markup/service charge |
| Discount % or Coupon | Flat %, cashback, delivery discount, loyalty offers |
| Total Checkout Price | Final payable price (food + delivery + fees – discounts) |
| Avg. Rating | Based on customer feedback |
| Estimated Delivery | Time range (e.g., 20–30 mins) |
| Time Scraped | Snapshot (evening hours – 7:00 PM typical order window) |
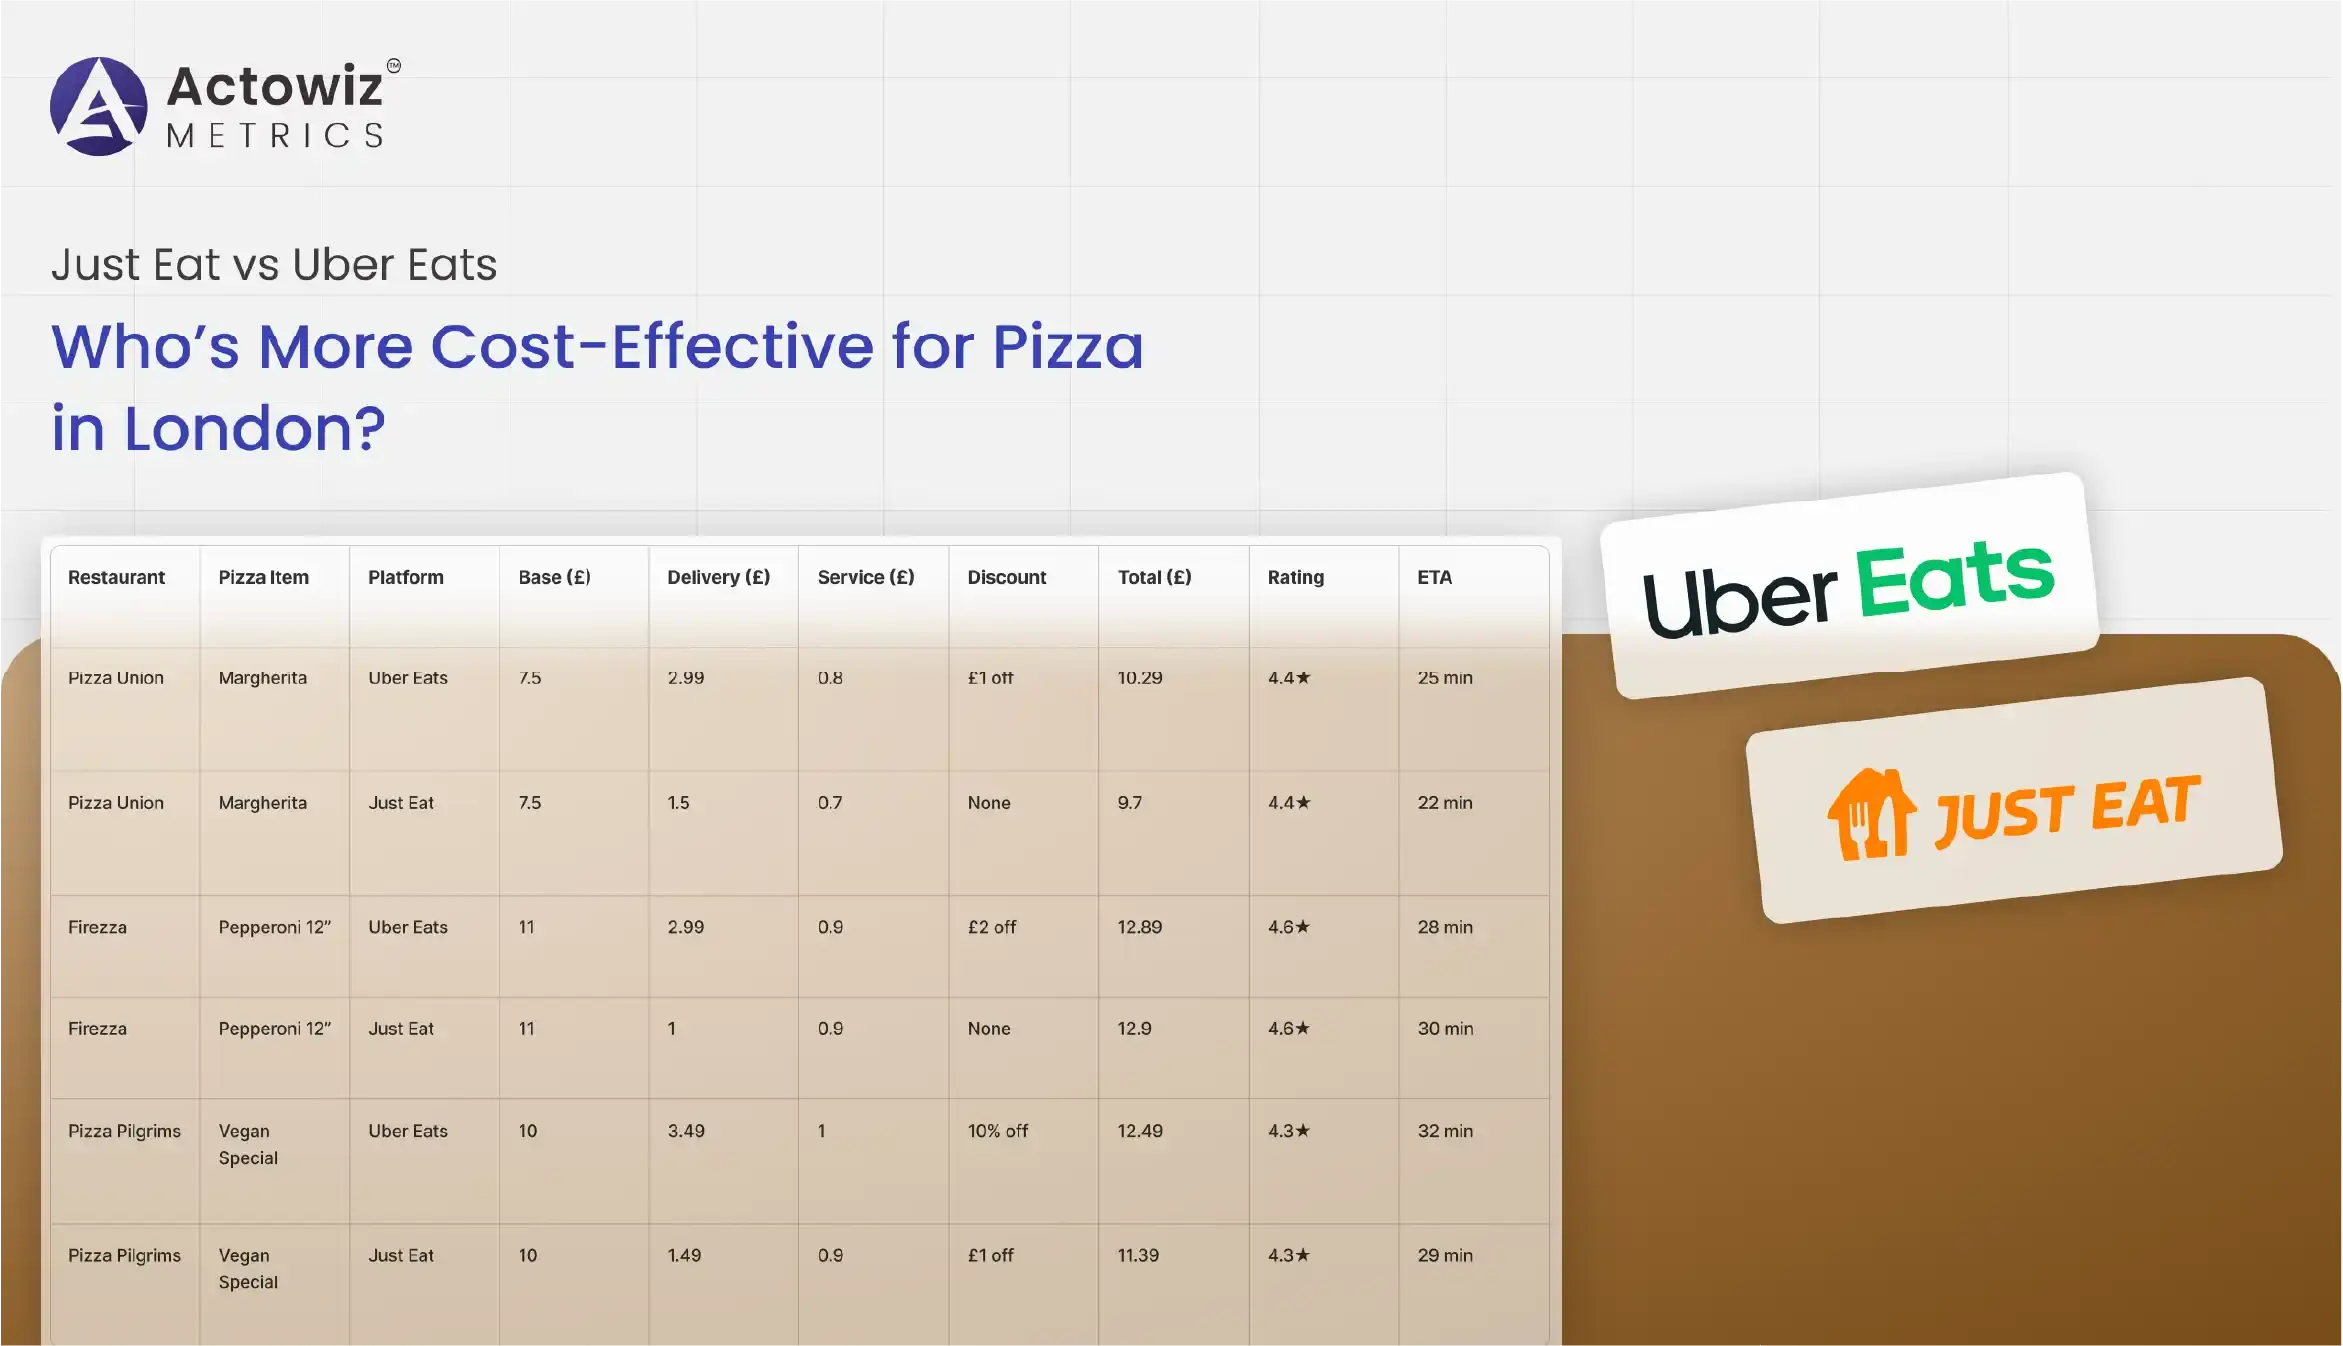
| Restaurant | Pizza Item | Platform | Base (£) | Delivery (£) | Service (£) | Discount | Total (£) | Rating | ETA |
|---|---|---|---|---|---|---|---|---|---|
| Pizza Union | Margherita | Uber Eats | 7.50 | 2.99 | 0.80 | £1 off | 10.29 | 4.4★ | 25 min |
| Pizza Union | Margherita | Just Eat | 7.50 | 1.50 | 0.70 | None | 9.70 | 4.4★ | 22 min |
| Firezza | Pepperoni 12” | Uber Eats | 11.00 | 2.99 | 0.90 | £2 off | 12.89 | 4.6★ | 28 min |
| Firezza | Pepperoni 12” | Just Eat | 11.00 | 1.00 | 0.90 | None | 12.90 | 4.6★ | 30 min |
| Pizza Pilgrims | Vegan Special | Uber Eats | 10.00 | 3.49 | 1.00 | 10% off | 12.49 | 4.3★ | 32 min |
| Pizza Pilgrims | Vegan Special | Just Eat | 10.00 | 1.49 | 0.90 | £1 off | 11.39 | 4.3★ | 29 min |
| Metric | Uber Eats (£) | Just Eat (£) |
|---|---|---|
| Avg. Base Pizza Price | 9.90 | 9.90 |
| Avg. Delivery Fee | 3.20 | 1.40 |
| Avg. Service Fee | 0.95 | 0.80 |
| Avg. Discount Gained | -1.50 | -0.80 |
| Avg. Total Price | 12.55 | 11.30 |
Scraping was done across:
Actowiz offers:
“Actowiz helped us identify high-margin pizza SKUs across apps in London. We restructured promo campaigns and increased app conversion by 18%.”
– Head of Growth, London Pizza Chain
While Uber Eats offers better promo codes, Just Eat is more consistently cost-effective for pizza orders in London. For frequent pizza lovers, Actowiz Metrics can help determine the smarter platform daily—based on scraped live data.
Brands, aggregators, and even end consumers can gain from pizza pricing intelligence powered by Actowiz.

Whatever your project size is, we will handle it well with all the standards fulfilled! We are here to give 100% satisfaction.
Any analytics feature you need — we provide it
24/7 global support
Real-time analytics dashboard
Full data transparency at every stage
Customized solutions to achieve your data analysis goals