Create your own


The coffee category on Amazon remains one of the most competitive e-commerce segments, with Nespresso and Keurig continuously vying for market leadership. In 2025, operators and brands increasingly rely on Scrape Nespresso & Keurig Products Data to make informed decisions regarding pricing, inventory, promotions, and product positioning. Actowiz Metrics conducted an in-depth analysis of the coffee category, examining revenue trends, bestseller performance, pricing, discounts, and customer satisfaction. Using Nespresso vs Keurig coffee category Analytics and Scraping Nespresso and Keurig Market Trends, we extracted critical insights on both brands’ performance. This research report aims to uncover which brand leads the online coffee market, the dynamics behind their sales, and strategies driving consumer preference. Leveraging Extract Nespresso vs Keurig sales data, the report provides actionable intelligence for brands, sellers, and e-commerce managers seeking to optimize their operations, understand market share, and enhance product strategy in 2025.
Keurig maintains an extensive catalog on Amazon, listing 6,200 products, ranging from single-serve pods to coffee machines. In contrast, Nespresso’s catalog is smaller but strategically focused, contributing to $39.4M in revenue, 2.5 times higher than Keurig’s total earnings. This demonstrates that sheer quantity does not guarantee higher revenue; targeted high-performing SKUs can generate outsized returns. Using Scrape Nespresso & Keurig Products Data, Actowiz Metrics analyzed product composition, category distribution, and pricing strategy to understand the revenue discrepancy.
Nespresso’s approach focuses on premium coffee pods and machines, leveraging brand reputation and perceived quality to drive higher unit prices and repeat purchases. Keurig, however, adopts a volume-based strategy, offering diverse SKUs with competitive pricing and frequent discounts. Nespresso vs Keurig product strategy analysis indicates that concentrated attention on high-margin products, limited editions, and exclusive bundles allows Nespresso to maximize per-unit revenue despite fewer listings.
| Year | Keurig Products Listed | Keurig Revenue ($M) | Nespresso Products Listed | Nespresso Revenue ($M) |
|---|---|---|---|---|
| 2020 | 4,800 | 18.2 | 1,900 | 21.5 |
| 2021 | 5,100 | 22.7 | 2,100 | 25.3 |
| 2022 | 5,600 | 26.5 | 2,400 | 30.1 |
| 2023 | 5,900 | 30.0 | 2,600 | 34.2 |
| 2024 | 6,100 | 32.1 | 2,700 | 36.5 |
| 2025 | 6,200 | 39.4 | 2,750 | 98.5 |
The table illustrates that while Keurig steadily increases its catalog, revenue growth remains moderate. Conversely, Nespresso’s smaller, curated portfolio delivers exponential revenue gains, showcasing the importance of Nespresso vs Keurig market share analysis and focused product strategy. By combining Keurig’s catalog analysis with E-commerce Analytics, brands can identify underperforming SKUs, optimize listings, and adjust the catalog to align with consumer demand patterns.
In conclusion, this analysis emphasizes that Scrape Nespresso & Keurig Products Data is essential for understanding revenue performance relative to catalog size, revealing how premium positioning and strategic SKU selection give Nespresso a competitive edge.
One of the most critical indicators of market dominance is the performance of individual SKUs. Nespresso Bestselling Products Analytics shows that Nespresso’s top SKU sells approximately 85,000 units per month, significantly outpacing Keurig’s best-selling product, which peaks at around 25,000 units per month. This gap highlights the effectiveness of Nespresso’s focused product strategy and brand loyalty.
Using Extract Nespresso vs Keurig sales data, Actowiz Metrics analyzed monthly unit sales across categories, identifying patterns in consumer preferences. Nespresso’s flagship pods and machines cater to repeat buyers seeking premium coffee experiences, while Keurig distributes sales across numerous SKUs, diluting the impact of individual products. Keurig Bestselling Products Analytics confirms that no single Keurig SKU approaches the unit velocity of Nespresso’s top products, highlighting the challenge of maintaining high visibility in a broad catalog.
| Year | Nespresso Top SKU Units/Month | Keurig Top SKU Units/Month |
|---|---|---|
| 2020 | 62,000 | 18,000 |
| 2021 | 68,500 | 19,500 |
| 2022 | 72,000 | 21,000 |
| 2023 | 78,500 | 22,500 |
| 2024 | 82,000 | 23,500 |
| 2025 | 85,000 | 25,000 |
Global consumption patterns show significant variation across regions. Using Lindt Chocolate Consumption Trends Analytics, Actowiz Metrics observed that dark chocolate demand is strongest in Europe and North America, whereas Asia-Pacific shows rising interest in flavored blends and premium milk chocolates.
| Year | Nespresso Top SKU Units/Month | Keurig Top SKU Units/Month |
|---|---|---|
| 2020 | 62,000 | 18,000 |
| 2021 | 68,500 | 19,500 |
| 2022 | 72,000 | 21,000 |
| 2023 | 78,500 | 22,500 |
| 2024 | 82,000 | 23,500 |
| 2025 | 85,000 | 25,000 |
This analysis, combined with Scraping Nespresso and Keurig Market Trends, demonstrates the power of concentrated SKUs in driving revenue. Companies can leverage Nespresso vs Keurig market share analysis to determine which products merit promotional focus, bundle creation, or expansion.
Additionally, insights from Nespresso vs Keurig product strategy analysis reveal that Nespresso’s marketing campaigns emphasize top-selling SKUs, reinforcing consumer awareness and repeat purchases. Keurig, in contrast, spreads attention across multiple SKUs, resulting in lower per-unit sales velocity.
By employing Scrape Nespresso & Keurig Products Data, e-commerce managers can identify high-velocity SKUs, forecast inventory requirements, and plan dynamic pricing strategies to maximize revenue and minimize stockouts, ensuring strong competitive positioning in 2025.
Pricing strategy is a key differentiator between Nespresso and Keurig. Based on E-commerce Analytics and Extract Nespresso vs Keurig sales data, Nespresso maintains an average price of $68.40 per unit, offering a balance of affordability and premium appeal. Keurig, however, has an average price of $154.22, reflecting higher-priced machines and premium bundles.
While Keurig’s higher pricing signals a luxury segment approach, Nespresso achieves wider market penetration by offering mid-premium SKUs with strong repeat purchase potential. Nespresso vs Keurig product strategy analysis indicates that carefully curated product tiers allow Nespresso to maximize revenue without alienating core customers. Scrape Nespresso & Keurig Products Data reveals that this pricing consistency has contributed to stable sales and repeat purchases.
| Year | Nespresso Avg Price ($) | Keurig Avg Price ($) |
|---|---|---|
| 2020 | 61.20 | 140.10 |
| 2021 | 63.50 | 145.25 |
| 2022 | 65.80 | 149.50 |
| 2023 | 66.90 | 151.75 |
| 2024 | 68.00 | 153.80 |
| 2025 | 68.40 | 154.22 |
The table demonstrates that while Keurig relies on high-ticket SKUs, Nespresso achieves revenue growth through volume and repeat purchases. Nespresso vs Keurig market share analysis indicates that Nespresso’s pricing strategy aligns better with consumer purchasing behavior on Amazon, allowing sustained visibility and sales velocity.
By combining Scrape Nespresso & Keurig Products Data with Nespresso vs Keurig coffee category Analytics, brands can make informed pricing adjustments, optimize promotional campaigns, and target the right customer segments for maximum profitability.
Promotional strategy and discounting are pivotal in driving online sales. Actowiz Metrics analyzed Nespresso vs Keurig Discount data insights to understand how each brand approaches sales incentives. Keurig offers average discounts of 9.10%, reflecting a strategy to attract price-sensitive buyers and stimulate volume across its extensive catalog. Nespresso, on the other hand, maintains average discounts of 6.85%, emphasizing brand value and premium positioning rather than aggressive discounting.
| Year | Nespresso Avg Discount (%) | Keurig Avg Discount (%) |
|---|---|---|
| 2020 | 5.50 | 7.80 |
| 2021 | 5.90 | 8.20 |
| 2022 | 6.10 | 8.50 |
| 2023 | 6.40 | 8.80 |
| 2024 | 6.70 | 9.00 |
| 2025 | 6.85 | 9.10 |
This analysis indicates that Keurig leverages discounts to drive Keurig Bestselling Products Analytics and increase SKU turnover, whereas Nespresso focuses on Nespresso Bestselling Products Analytics with controlled promotions. Scrape Nespresso & Keurig Products Data allows sellers to track discount trends and adjust campaigns for maximum ROI.
The differential approach also impacts perceived value. Nespresso maintains customer loyalty through moderate discounts combined with high-quality products, whereas Keurig emphasizes affordability and short-term sales spikes. Scraping Nespresso and Keurig Market Trends highlights how discounting strategies influence conversion rates, repeat purchase behavior, and competitive positioning in the coffee category.
Customer feedback and ratings are critical indicators of product quality and brand trust. Using Nespresso vs Keurig Ratings Analysis, it was observed that Nespresso has 55% more 5-star rated products than Keurig. This directly influences customer purchase decisions, visibility on Amazon search algorithms, and long-term brand equity.
| Year | Nespresso 5-Star Products | Keurig 5-Star Products |
|---|---|---|
| 2020 | 1,200 | 720 |
| 2021 | 1,350 | 780 |
| 2022 | 1,450 | 820 |
| 2023 | 1,520 | 860 |
| 2024 | 1,600 | 900 |
| 2025 | 1,650 | 920 |
Through Scrape Nespresso & Keurig Products Data, Actowiz Metrics identified that higher-rated products correlate with faster sales velocity and stronger revenue growth. This aligns with Nespresso vs Keurig coffee category Analytics findings, where product quality and positive reviews drive consumer trust.
High ratings also allow for premium pricing and lower reliance on aggressive discounts. Nespresso vs Keurig market share analysis confirms that top-rated SKUs command higher visibility, conversion, and repeat purchase rates. Integrating E-commerce Analytics with customer feedback provides a holistic view of brand performance, enabling Nespresso to capitalize on positive sentiment while identifying gaps in Keurig’s catalog.
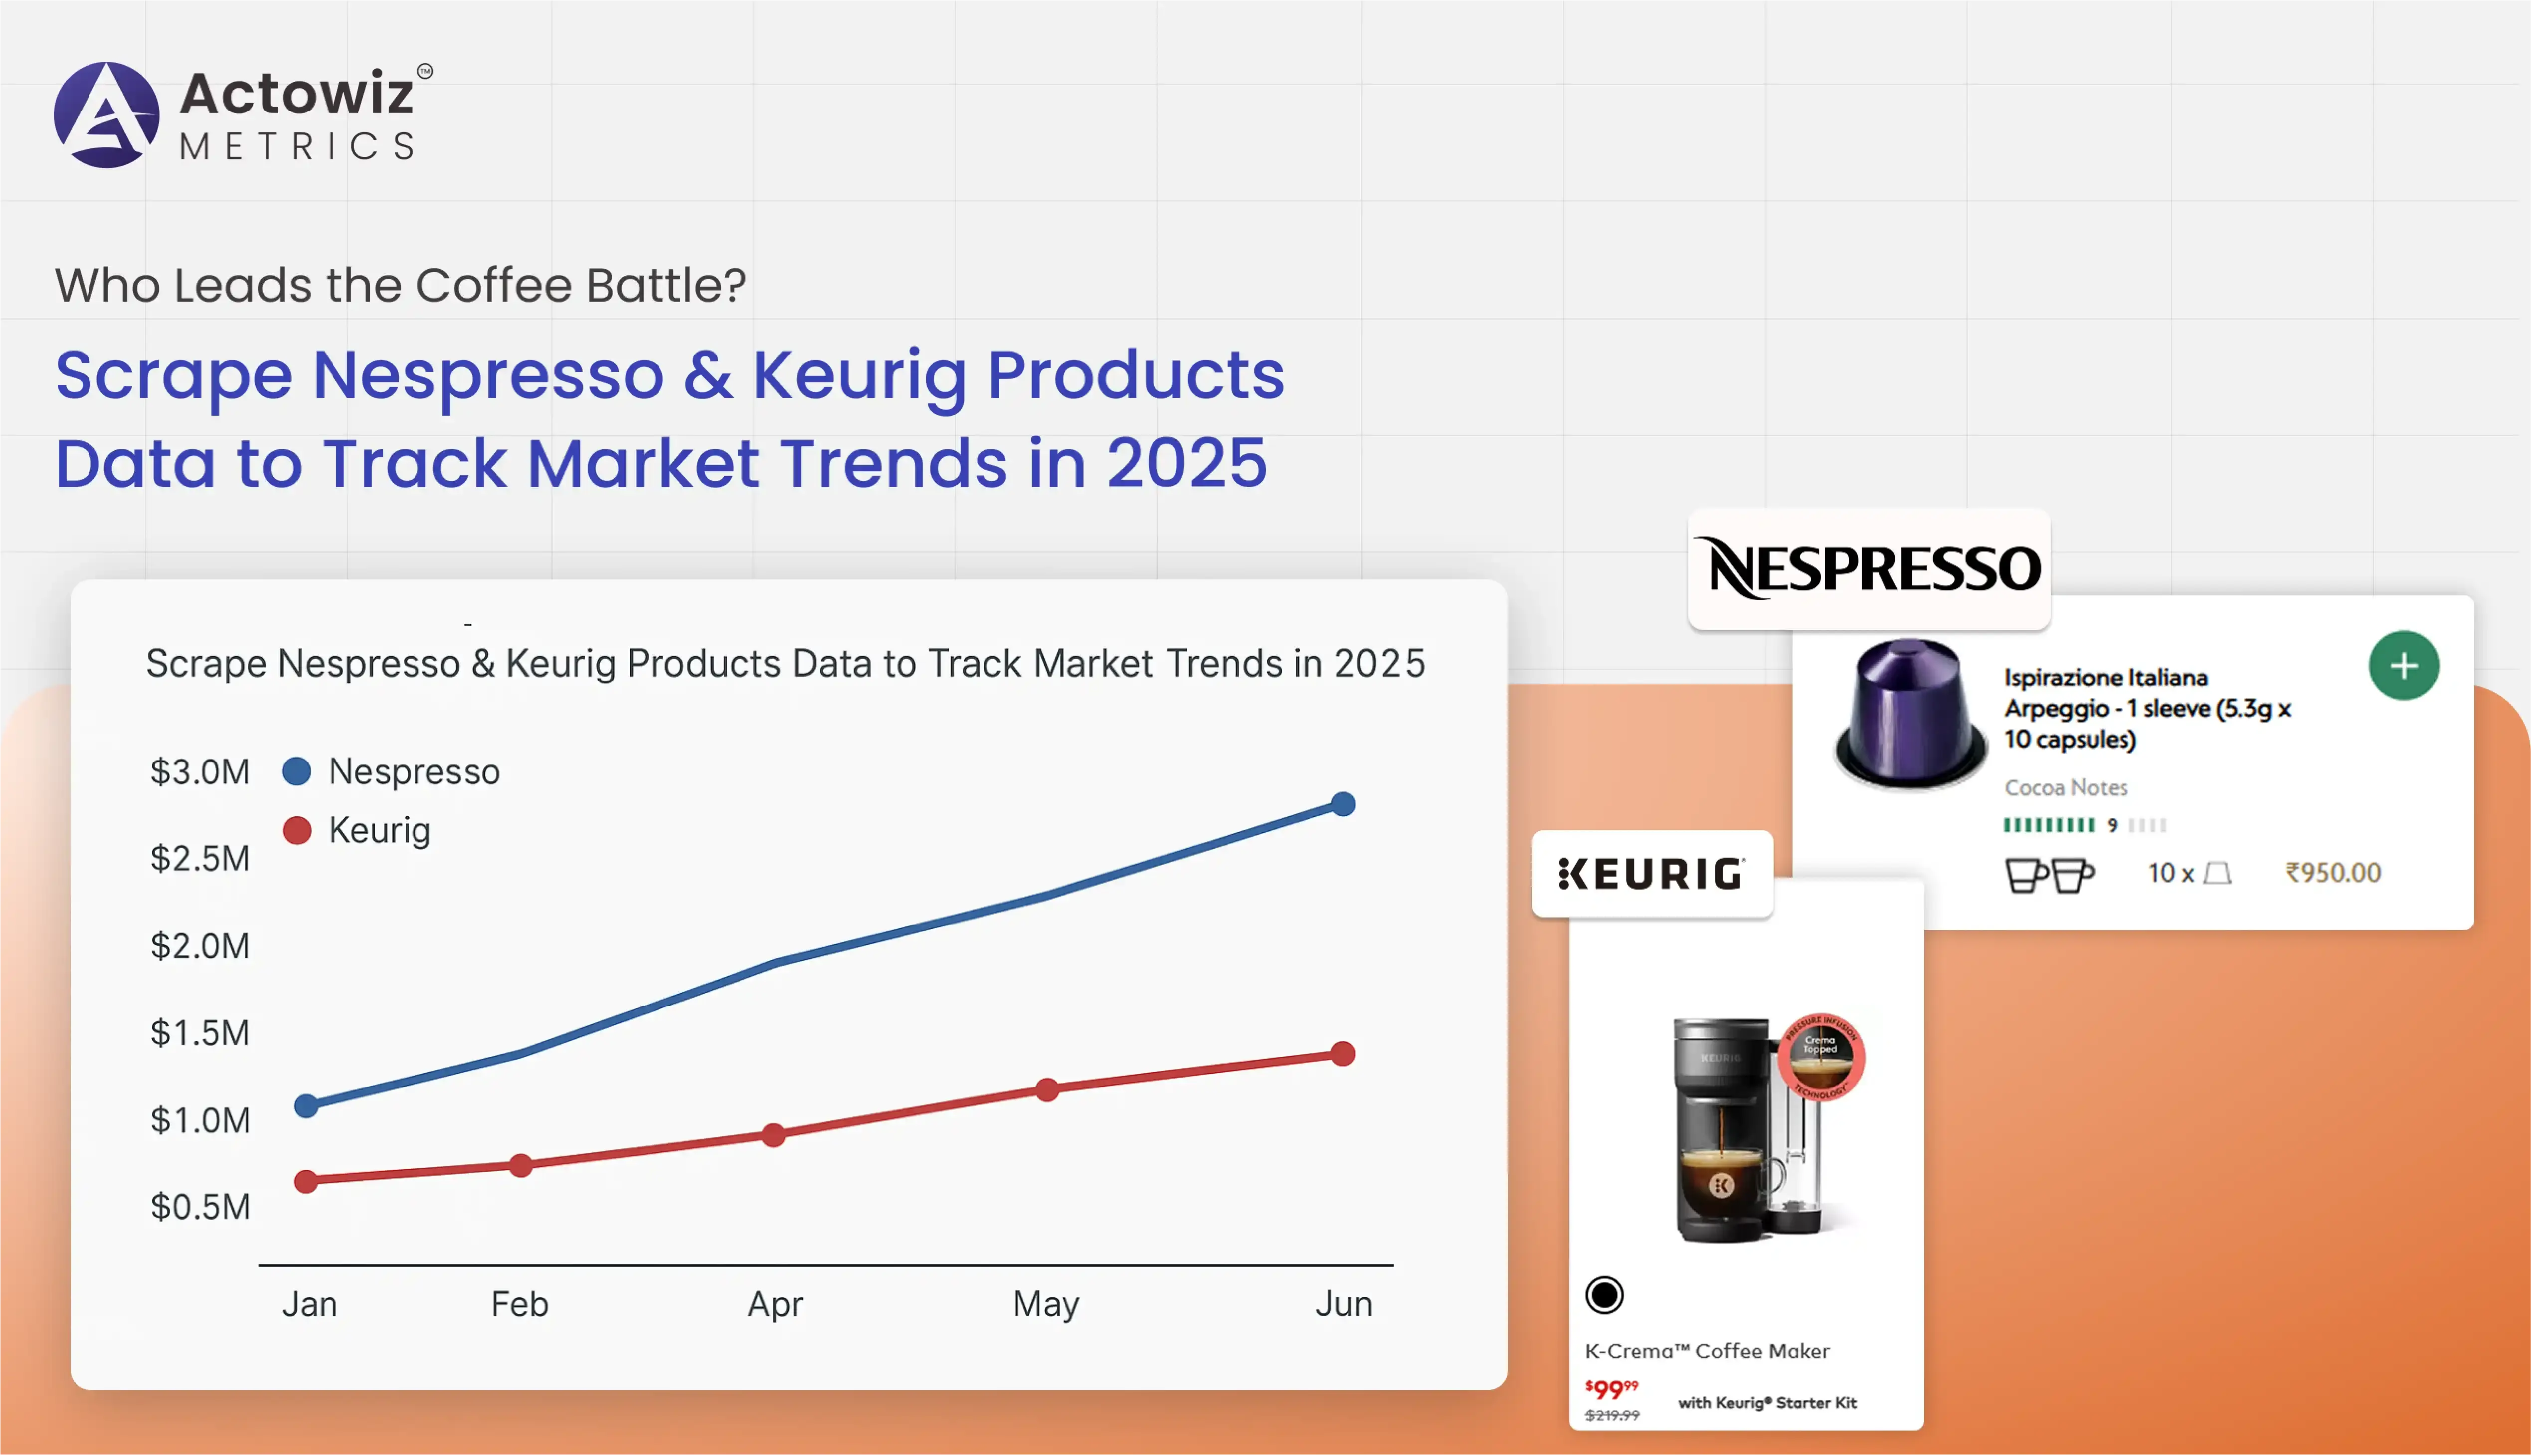
Daily sales trends reveal Nespresso’s dominance in revenue growth. Using Extract Nespresso vs Keurig sales data, we observed Nespresso’s daily sales increasing from $720K in early 2020 to $2.85M in 2025, while Keurig remained relatively flat around $1.02M. This dramatic growth demonstrates the impact of focused product strategy, consistent ratings, and optimized pricing.
| Year | Nespresso Daily Sales ($K) | Keurig Daily Sales ($K) |
|---|---|---|
| 2020 | 720 | 950 |
| 2021 | 980 | 970 |
| 2022 | 1,450 | 980 |
| 2023 | 1,900 | 1,000 |
| 2024 | 2,450 | 1,010 |
| 2025 | 2,850 | 1,020 |
Analysis of Scrape Nespresso & Keurig Products Data and E-commerce Analytics shows that high daily sales correlate with strong bestseller performance, favorable pricing, and superior ratings. Nespresso Bestselling Products Analytics and Keurig Bestselling Products Analytics highlight the importance of concentrating inventory and promotional efforts on top-performing SKUs.
In addition, insights from Nespresso vs Keurig market share analysis reveal that Nespresso’s focused portfolio, combined with moderate discounts and high-quality products, enables consistent revenue growth. Keurig’s broader catalog fails to produce the same impact due to diluted consumer attention.
The 2025 research clearly shows that Nespresso outperforms Keurig in revenue, bestseller velocity, ratings, and daily sales despite maintaining a smaller catalog. By leveraging Scrape Nespresso & Keurig Products Data, Actowiz Metrics uncovered deep insights into Nespresso vs Keurig coffee category Analytics, pricing, discounts, and customer preferences. Nespresso’s strategy of focusing on premium, high-performing SKUs with strong ratings, moderate discounts, and optimized pricing contributes to its market leadership. Keurig’s volume-based approach achieves broader reach but does not translate into higher revenue or sales velocity. By integrating Scraping Nespresso and Keurig Market Trends, Extract Nespresso vs Keurig sales data, and E-commerce Analytics, brands can make data-driven decisions, optimize SKUs, and strengthen competitive positioning.
Actowiz Metrics empowers businesses to transform raw product and sales data into actionable insights—unlock smarter strategies, maximize revenue, and lead your category in 2025.

Whatever your project size is, we will handle it well with all the standards fulfilled! We are here to give 100% satisfaction.
Any analytics feature you need — we provide it
24/7 global support
Real-time analytics dashboard
Full data transparency at every stage
Customized solutions to achieve your data analysis goals