Create your own


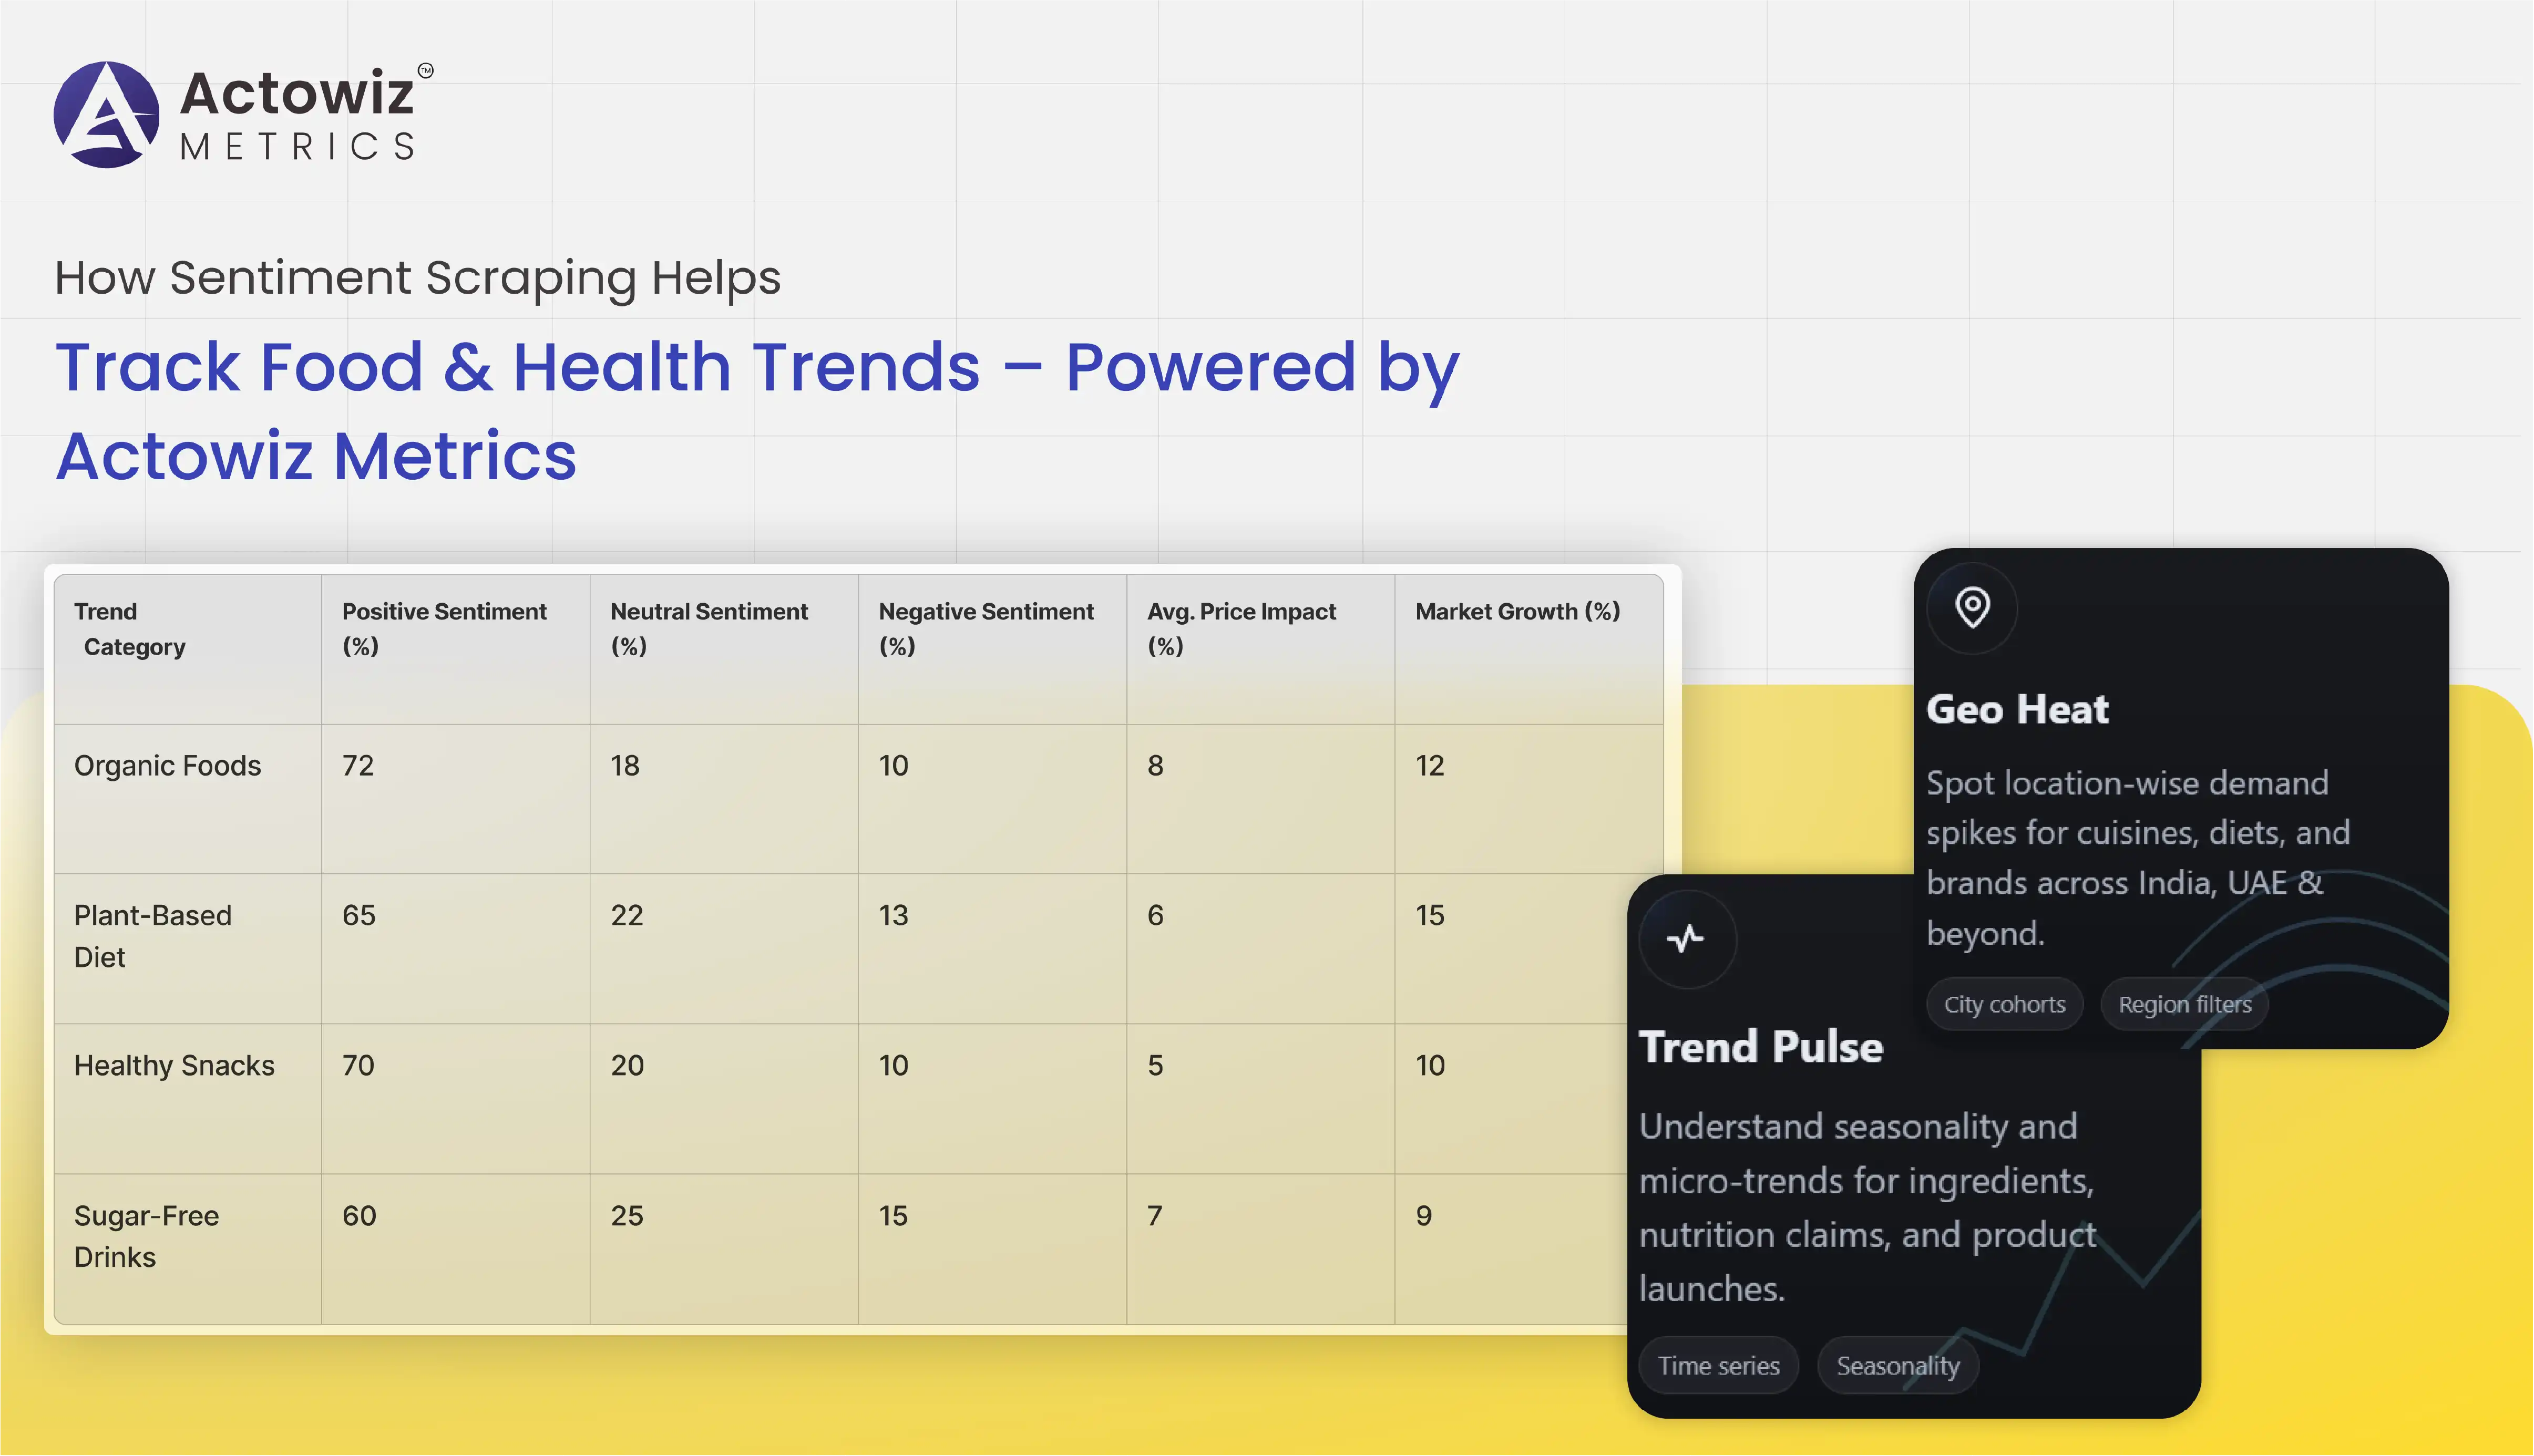
The food and healthcare industries are evolving at breakneck speed, fueled by shifting consumer preferences, rising health awareness, and the explosive growth of digital platforms. Businesses can no longer rely solely on sales numbers to understand what customers want — they need to know why customers feel the way they do.
That’s where customer sentiment data scraping comes in.
Actowiz Metrics has pioneered the use of web scraping for sentiment analysis, combining advanced AI-powered natural language processing (NLP) with high-volume data extraction from food delivery apps, e-commerce platforms, restaurant review sites, and healthcare marketplaces.
With the ability to track real-time sentiment trends and perform customer sentiment trends analysis, Actowiz Metrics enables:
In this case study, we focus on India and UAE — two rapidly growing digital markets — and explore how Actowiz Metrics helped clients increase revenue, optimize product offerings, and enhance customer satisfaction using sentiment scraping.
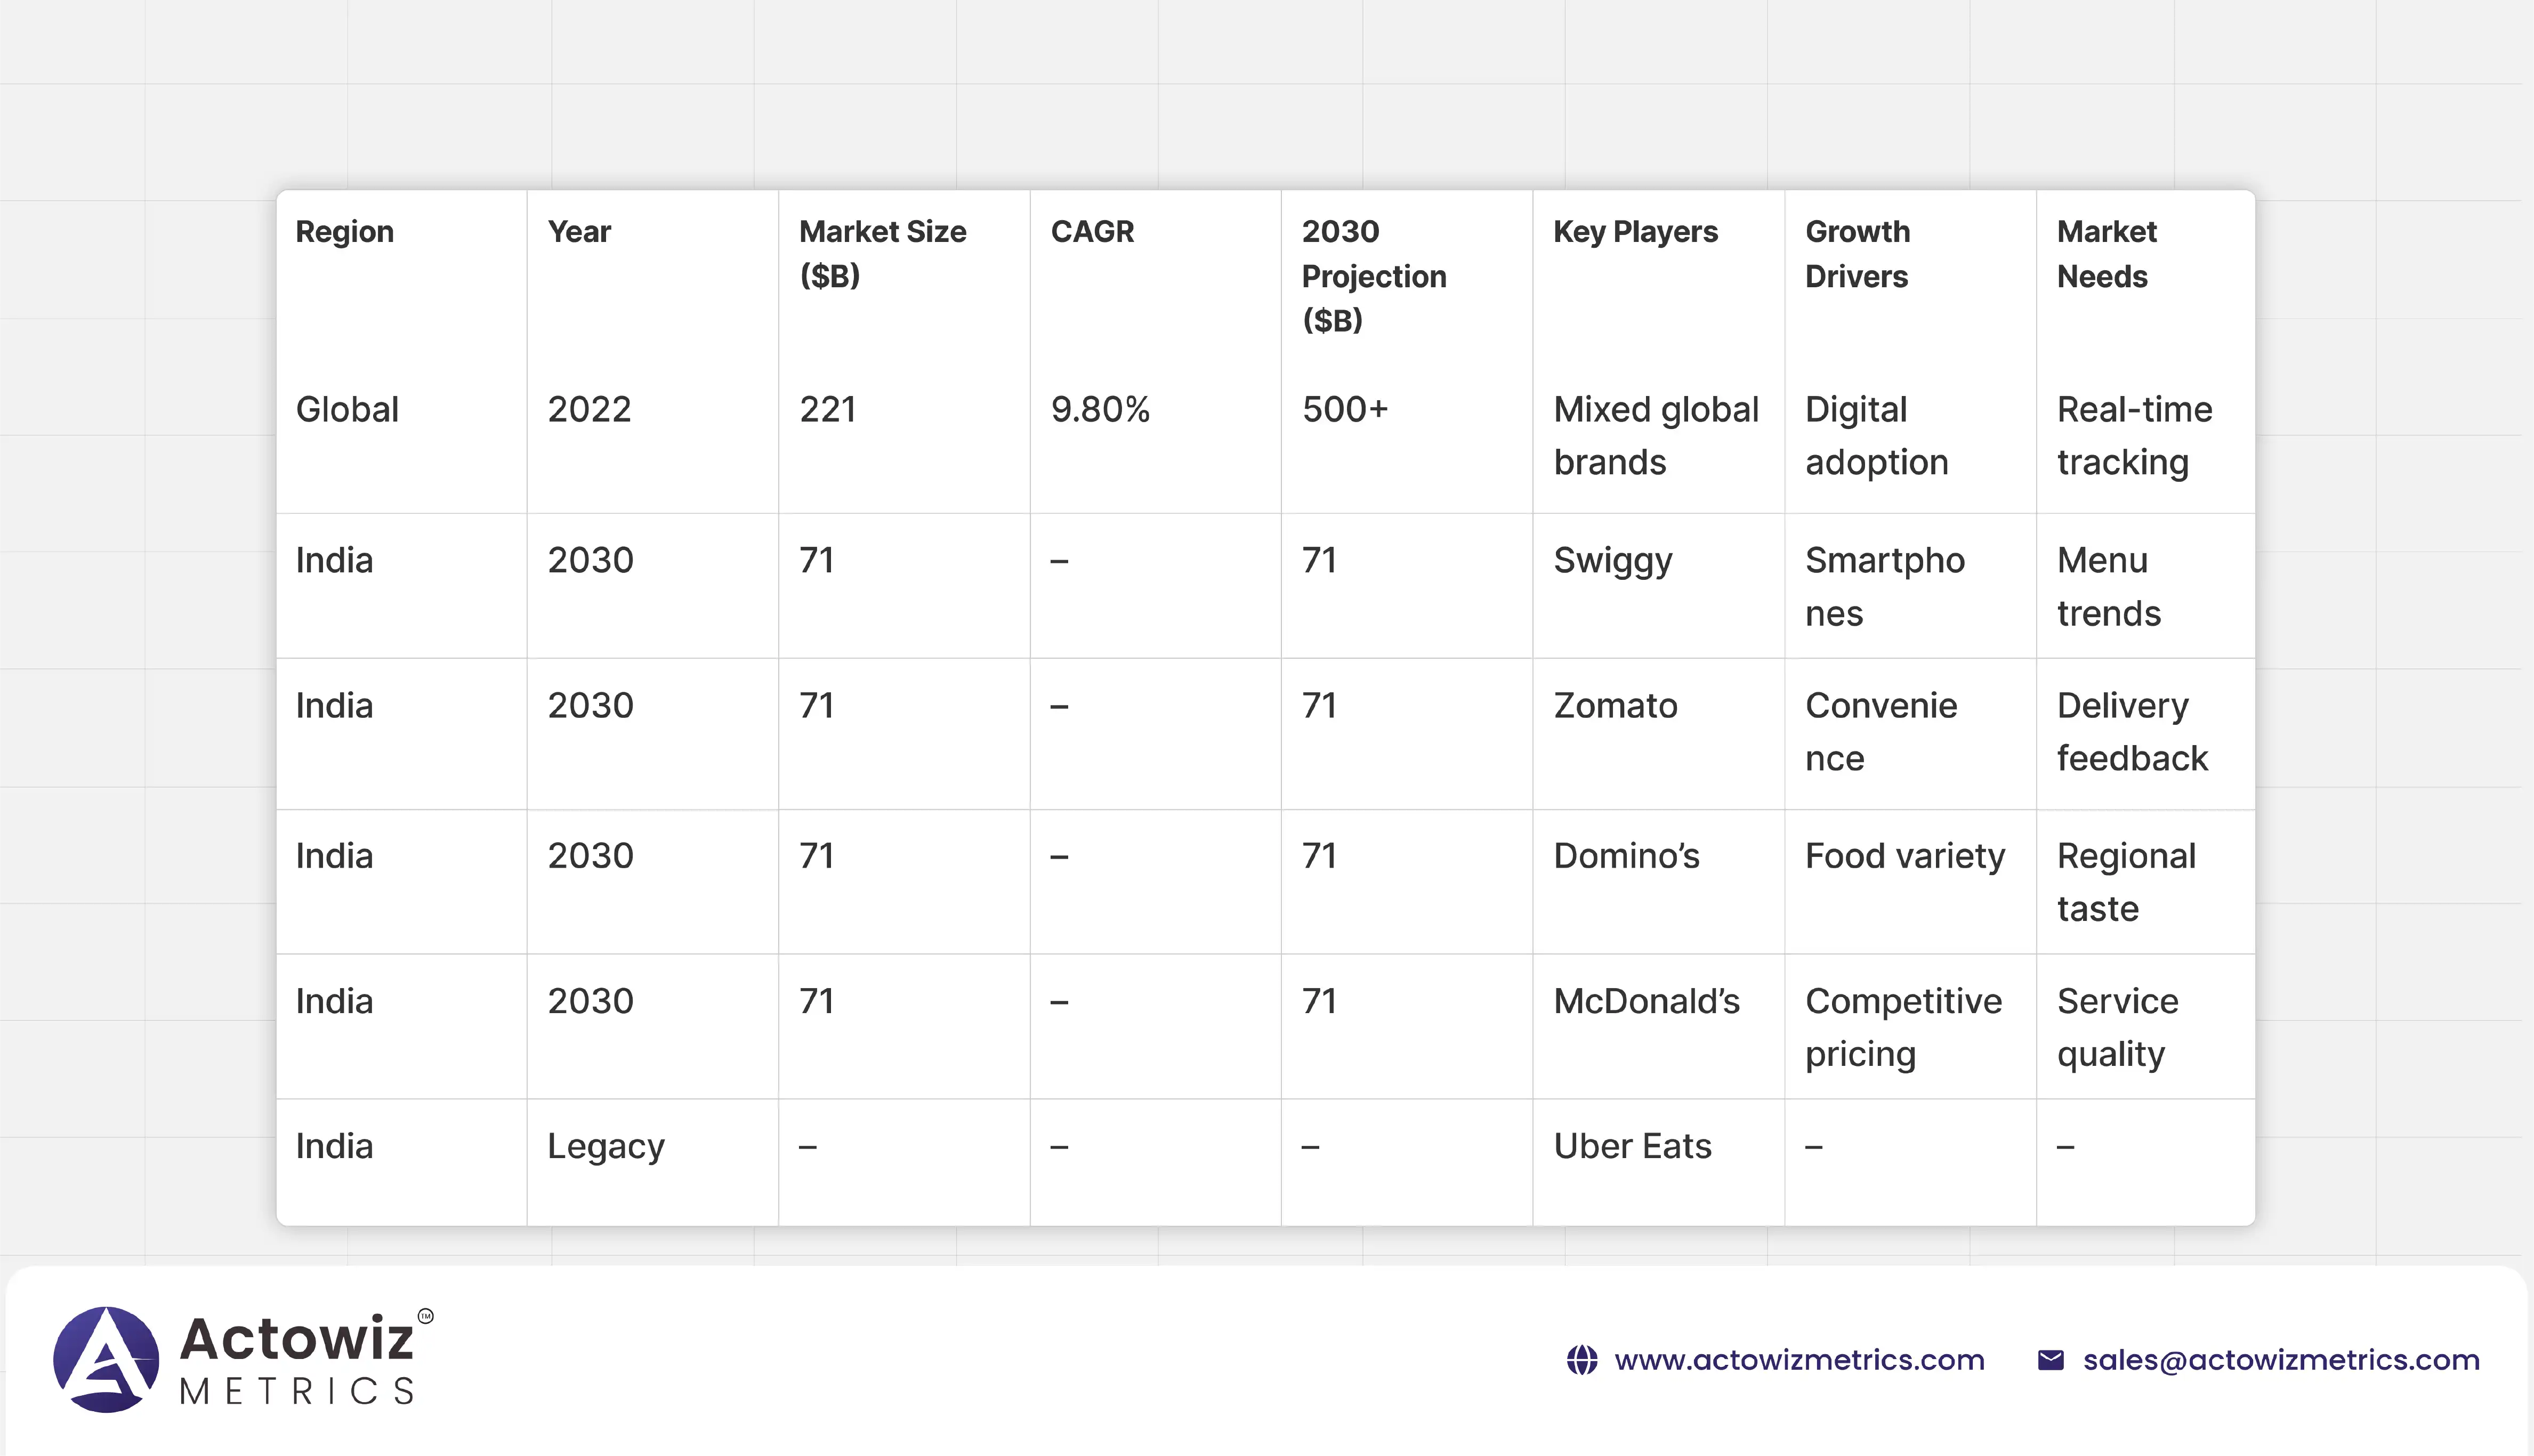
The global online food delivery industry was valued at over $221 billion in 2022 and is projected to grow at a CAGR of 9.8%, crossing $500 billion by 2030.
India:
UAE:
Market Needs:
The global digital health market is expected to surpass $550 billion by 2027, fueled by telemedicine adoption, health-conscious lifestyles, and the popularity of wellness products.
India:
UAE:
Market Needs:
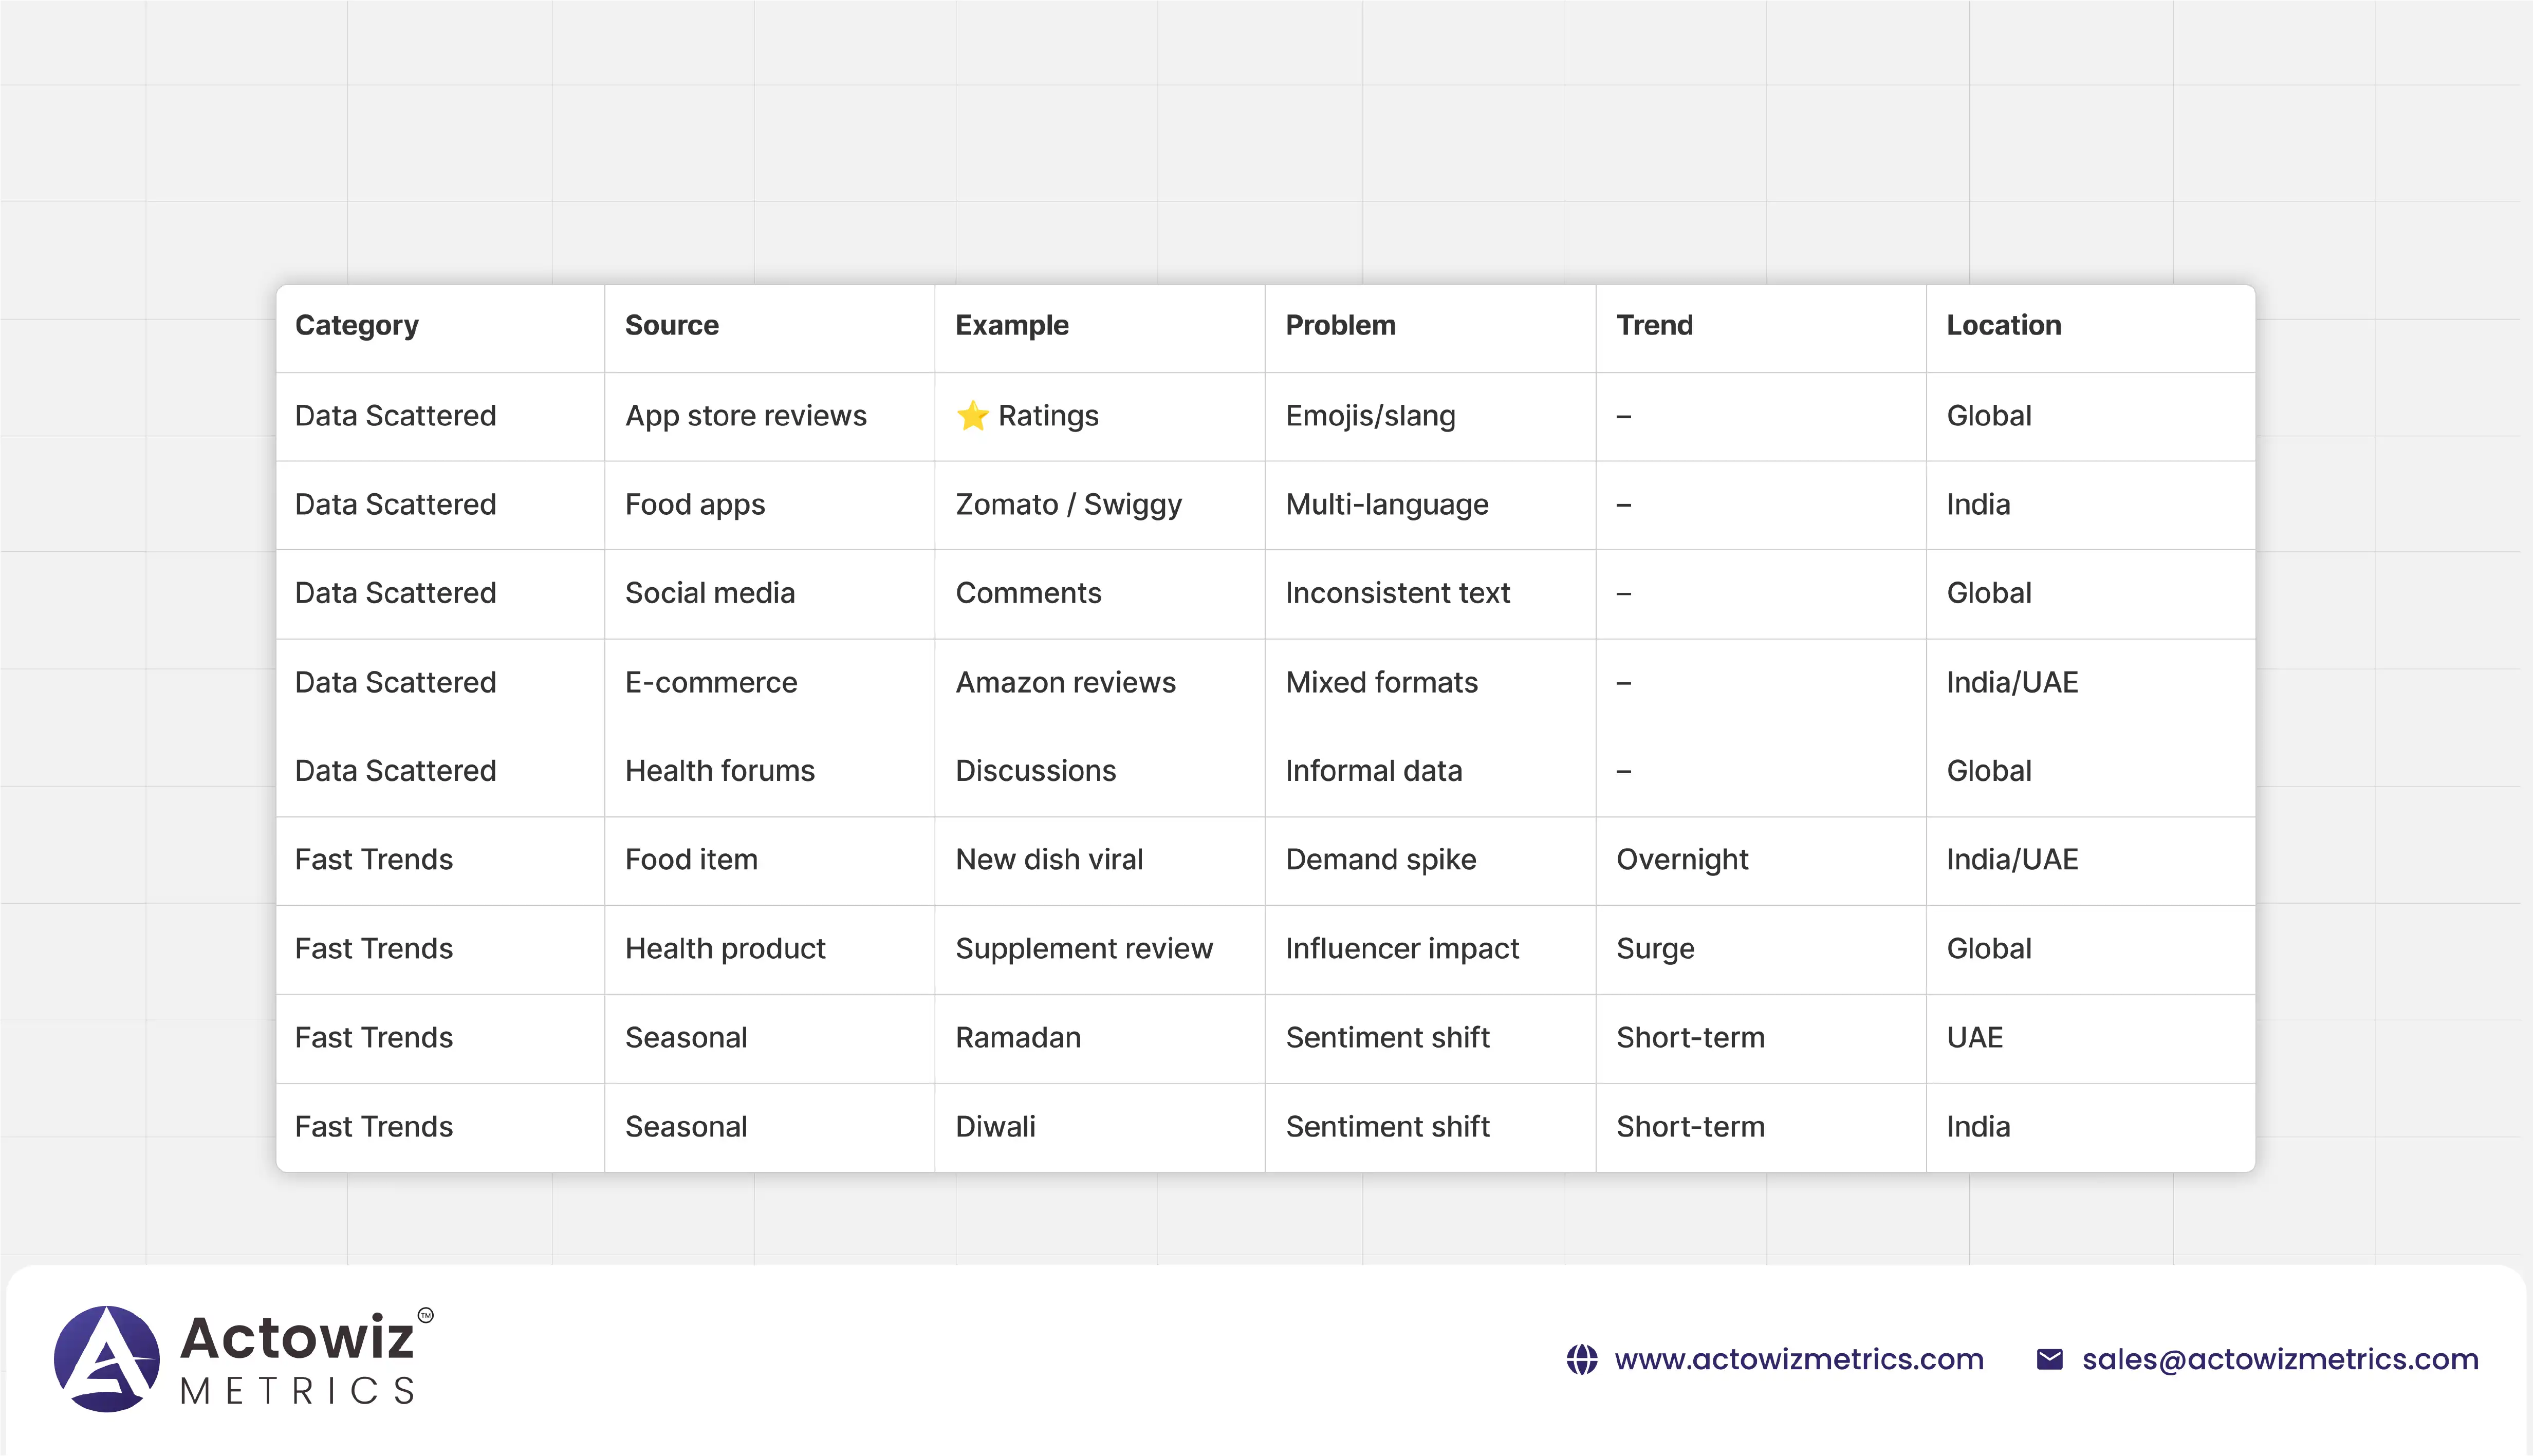
Customer feedback exists across:
This feedback is unstructured, often containing emojis, slang, multiple languages, and inconsistent formats.
A healthy smoothie may be popular in Dubai Marina but unpopular in Sharjah due to pricing differences. A spicy dish may be well-loved in Hyderabad but rated poorly in Chennai.
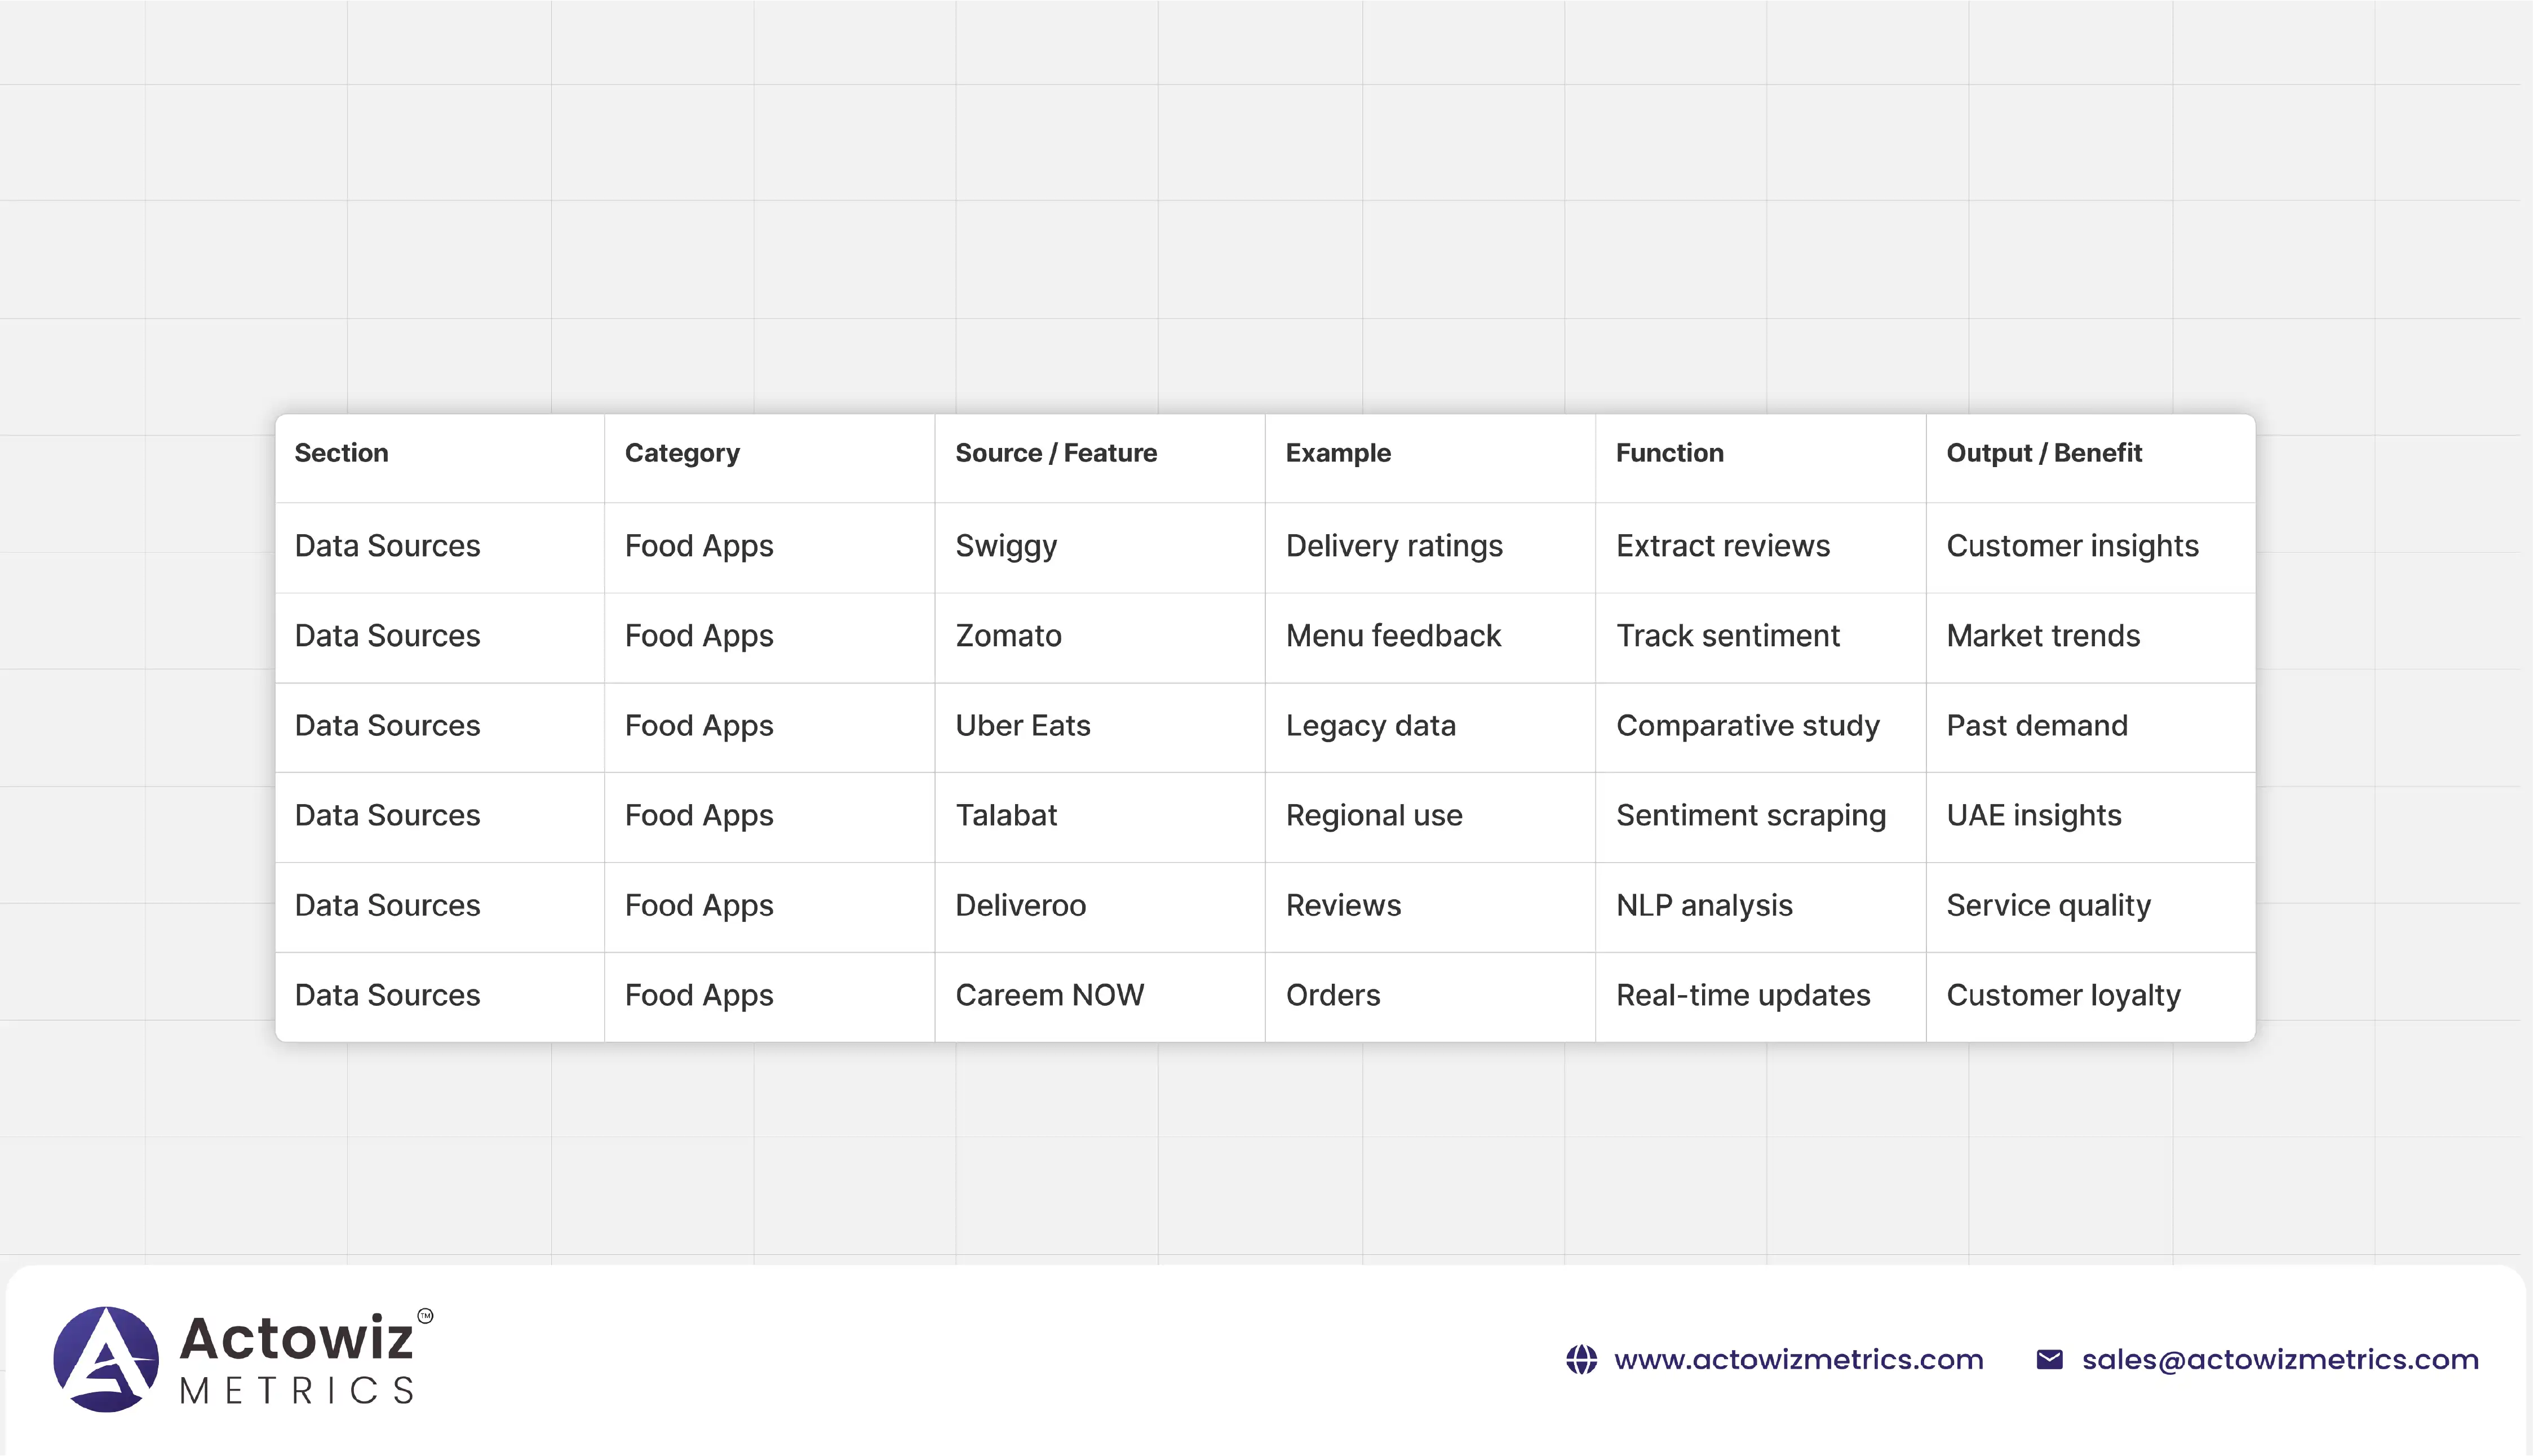
Actowiz Metrics designed a multi-layered sentiment analytics framework:
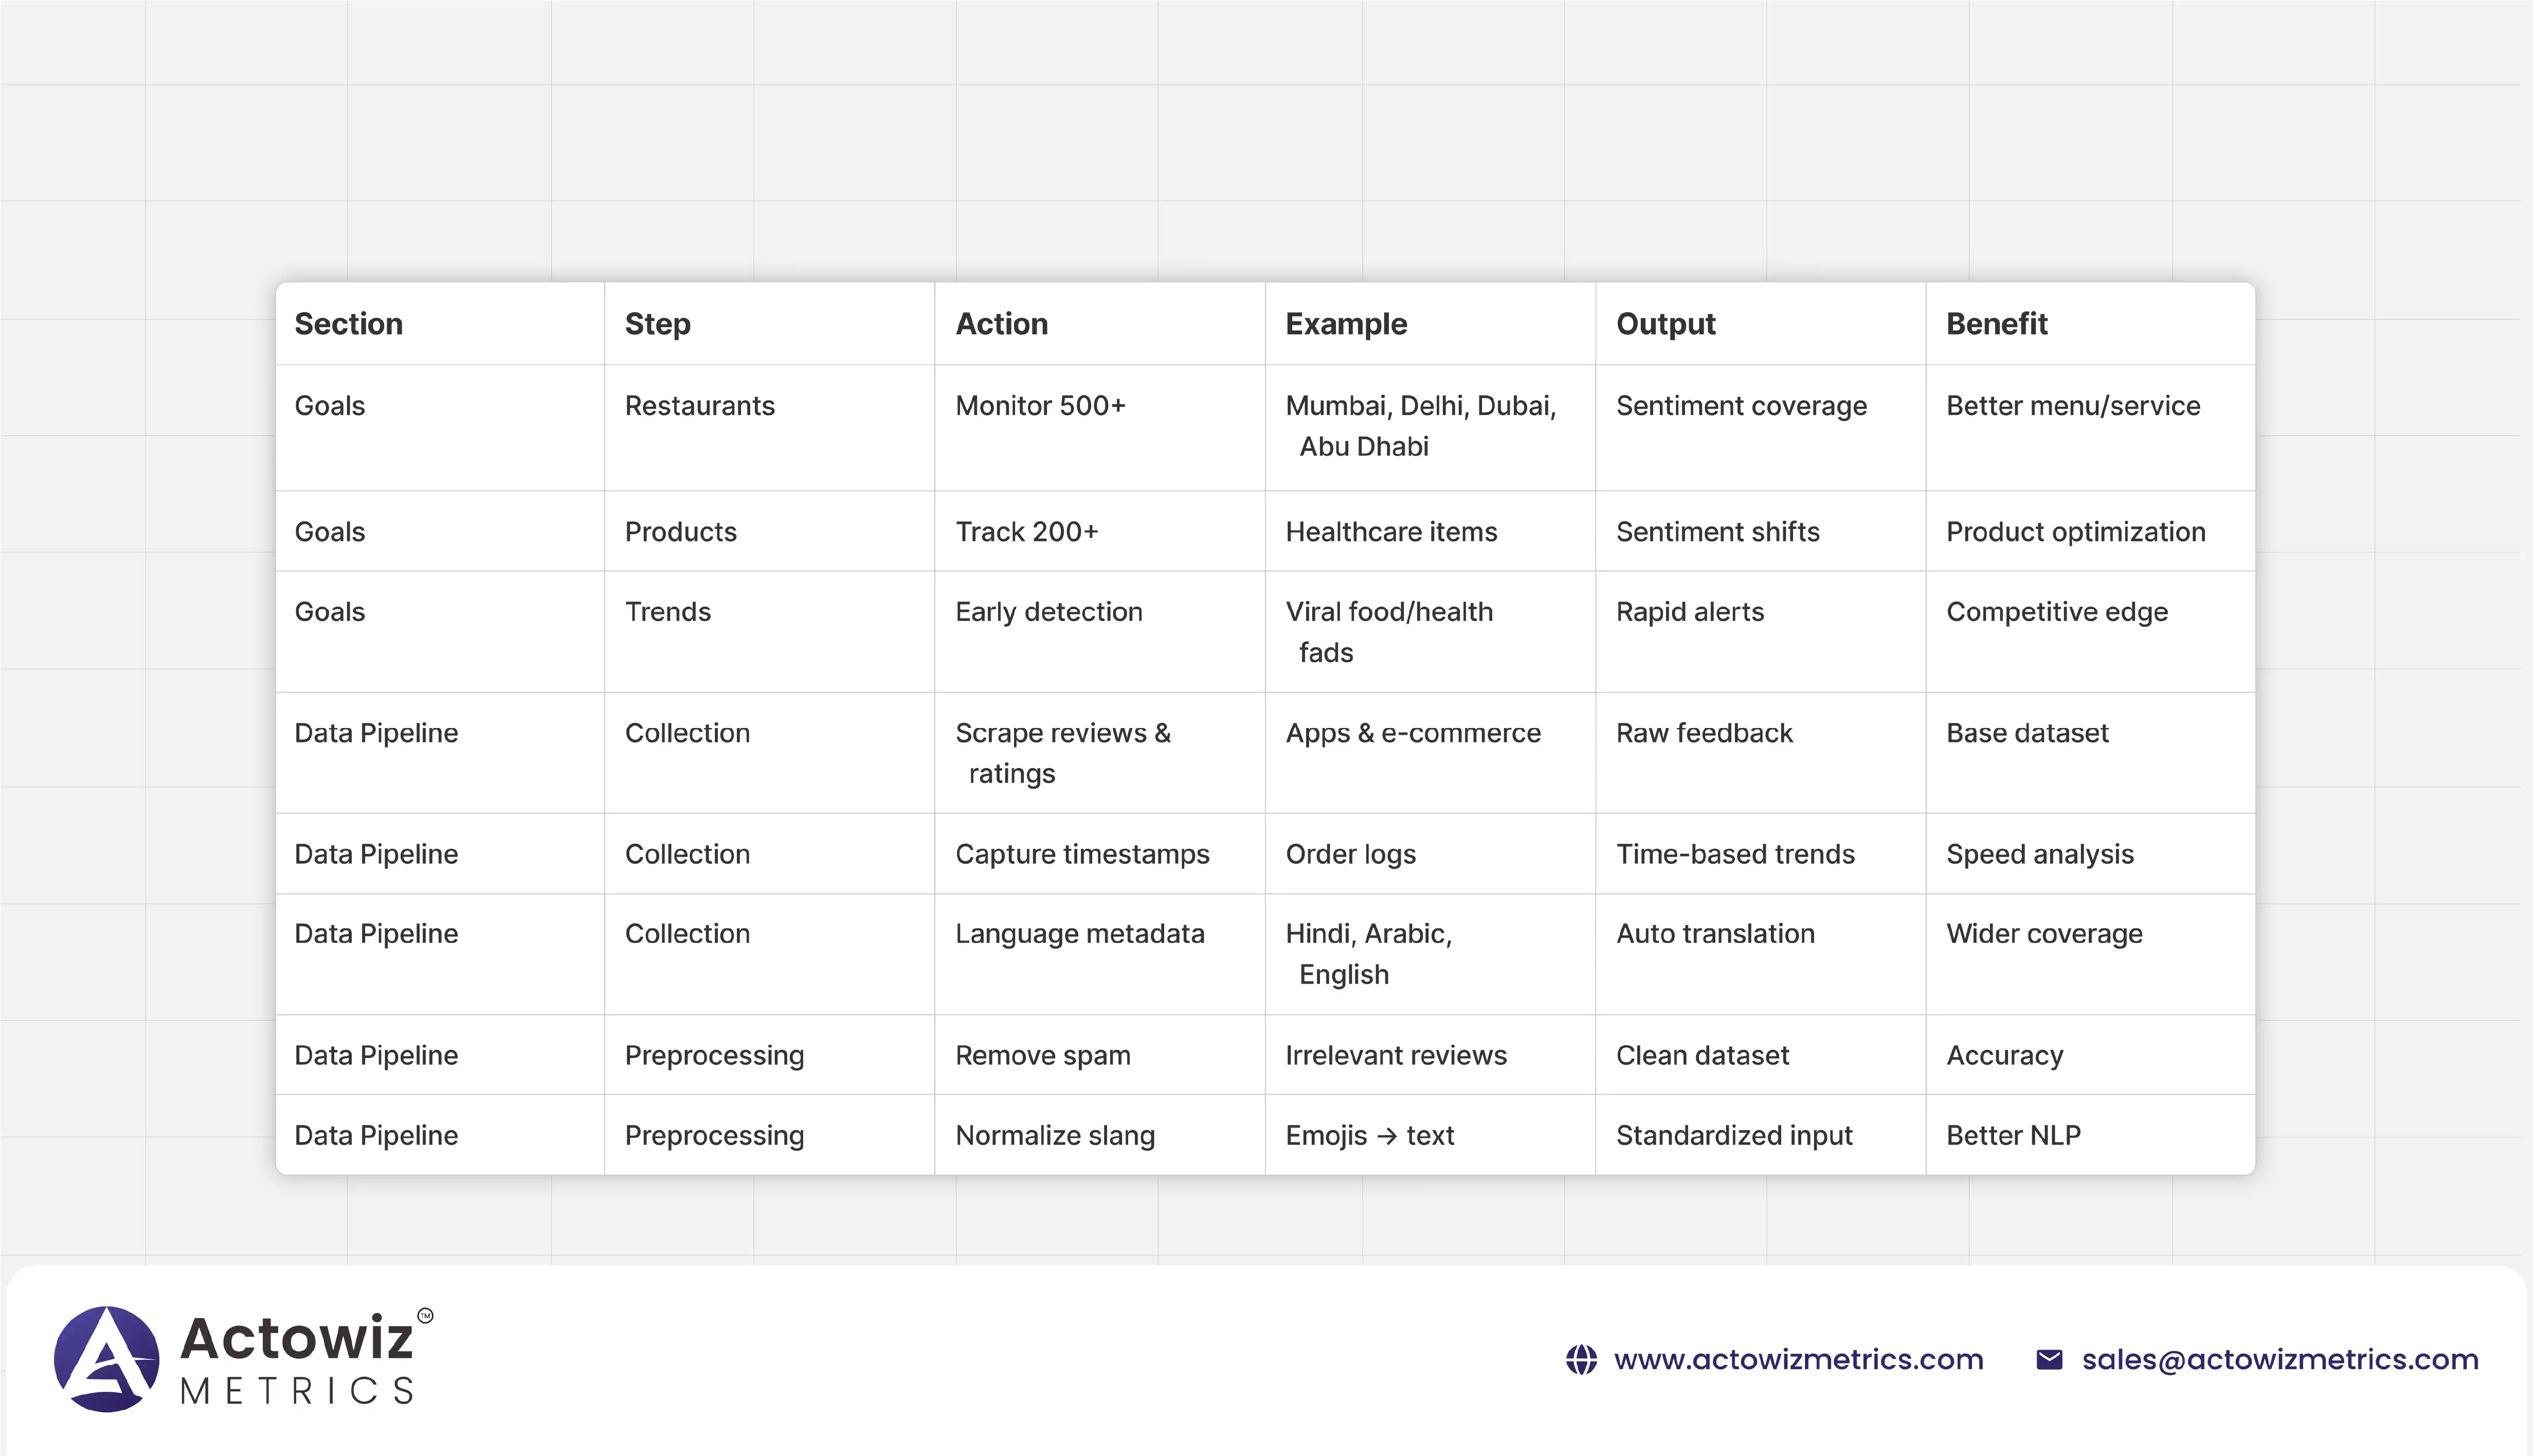
Step 1: Collection
Step 2: Preprocessing
Step 3: Analysis
Step 4: Delivery
| Restaurant | Location | Dish | Avg Rating | Positive % | Negative % | Trend |
|---|---|---|---|---|---|---|
| The Bombay Kitchen | Mumbai | Butter Chicken | 4.6 | 88% | 5% | High weekend demand |
| Delhi Tandoor | Delhi | Paneer Tikka | 4.4 | 85% | 7% | Strong festival sales |
| Café Hyderabad | Hyderabad | Chicken Biryani | 4.7 | 92% | 3% | Consistent all year |
| Product | Platform | Category | Avg Rating | Positive % | Negative % | Trend |
|---|---|---|---|---|---|---|
| Omega-3 Fish Oil | Noon | Supplement | 4.5 | 90% | 4% | Rising winter demand |
| Vitamin C Serum | Amazon UAE | Skincare | 4.2 | 82% | 9% | Surge in summer |
| Probiotic Capsules | Noon | Digestive Health | 4.6 | 88% | 5% | Steady growth |
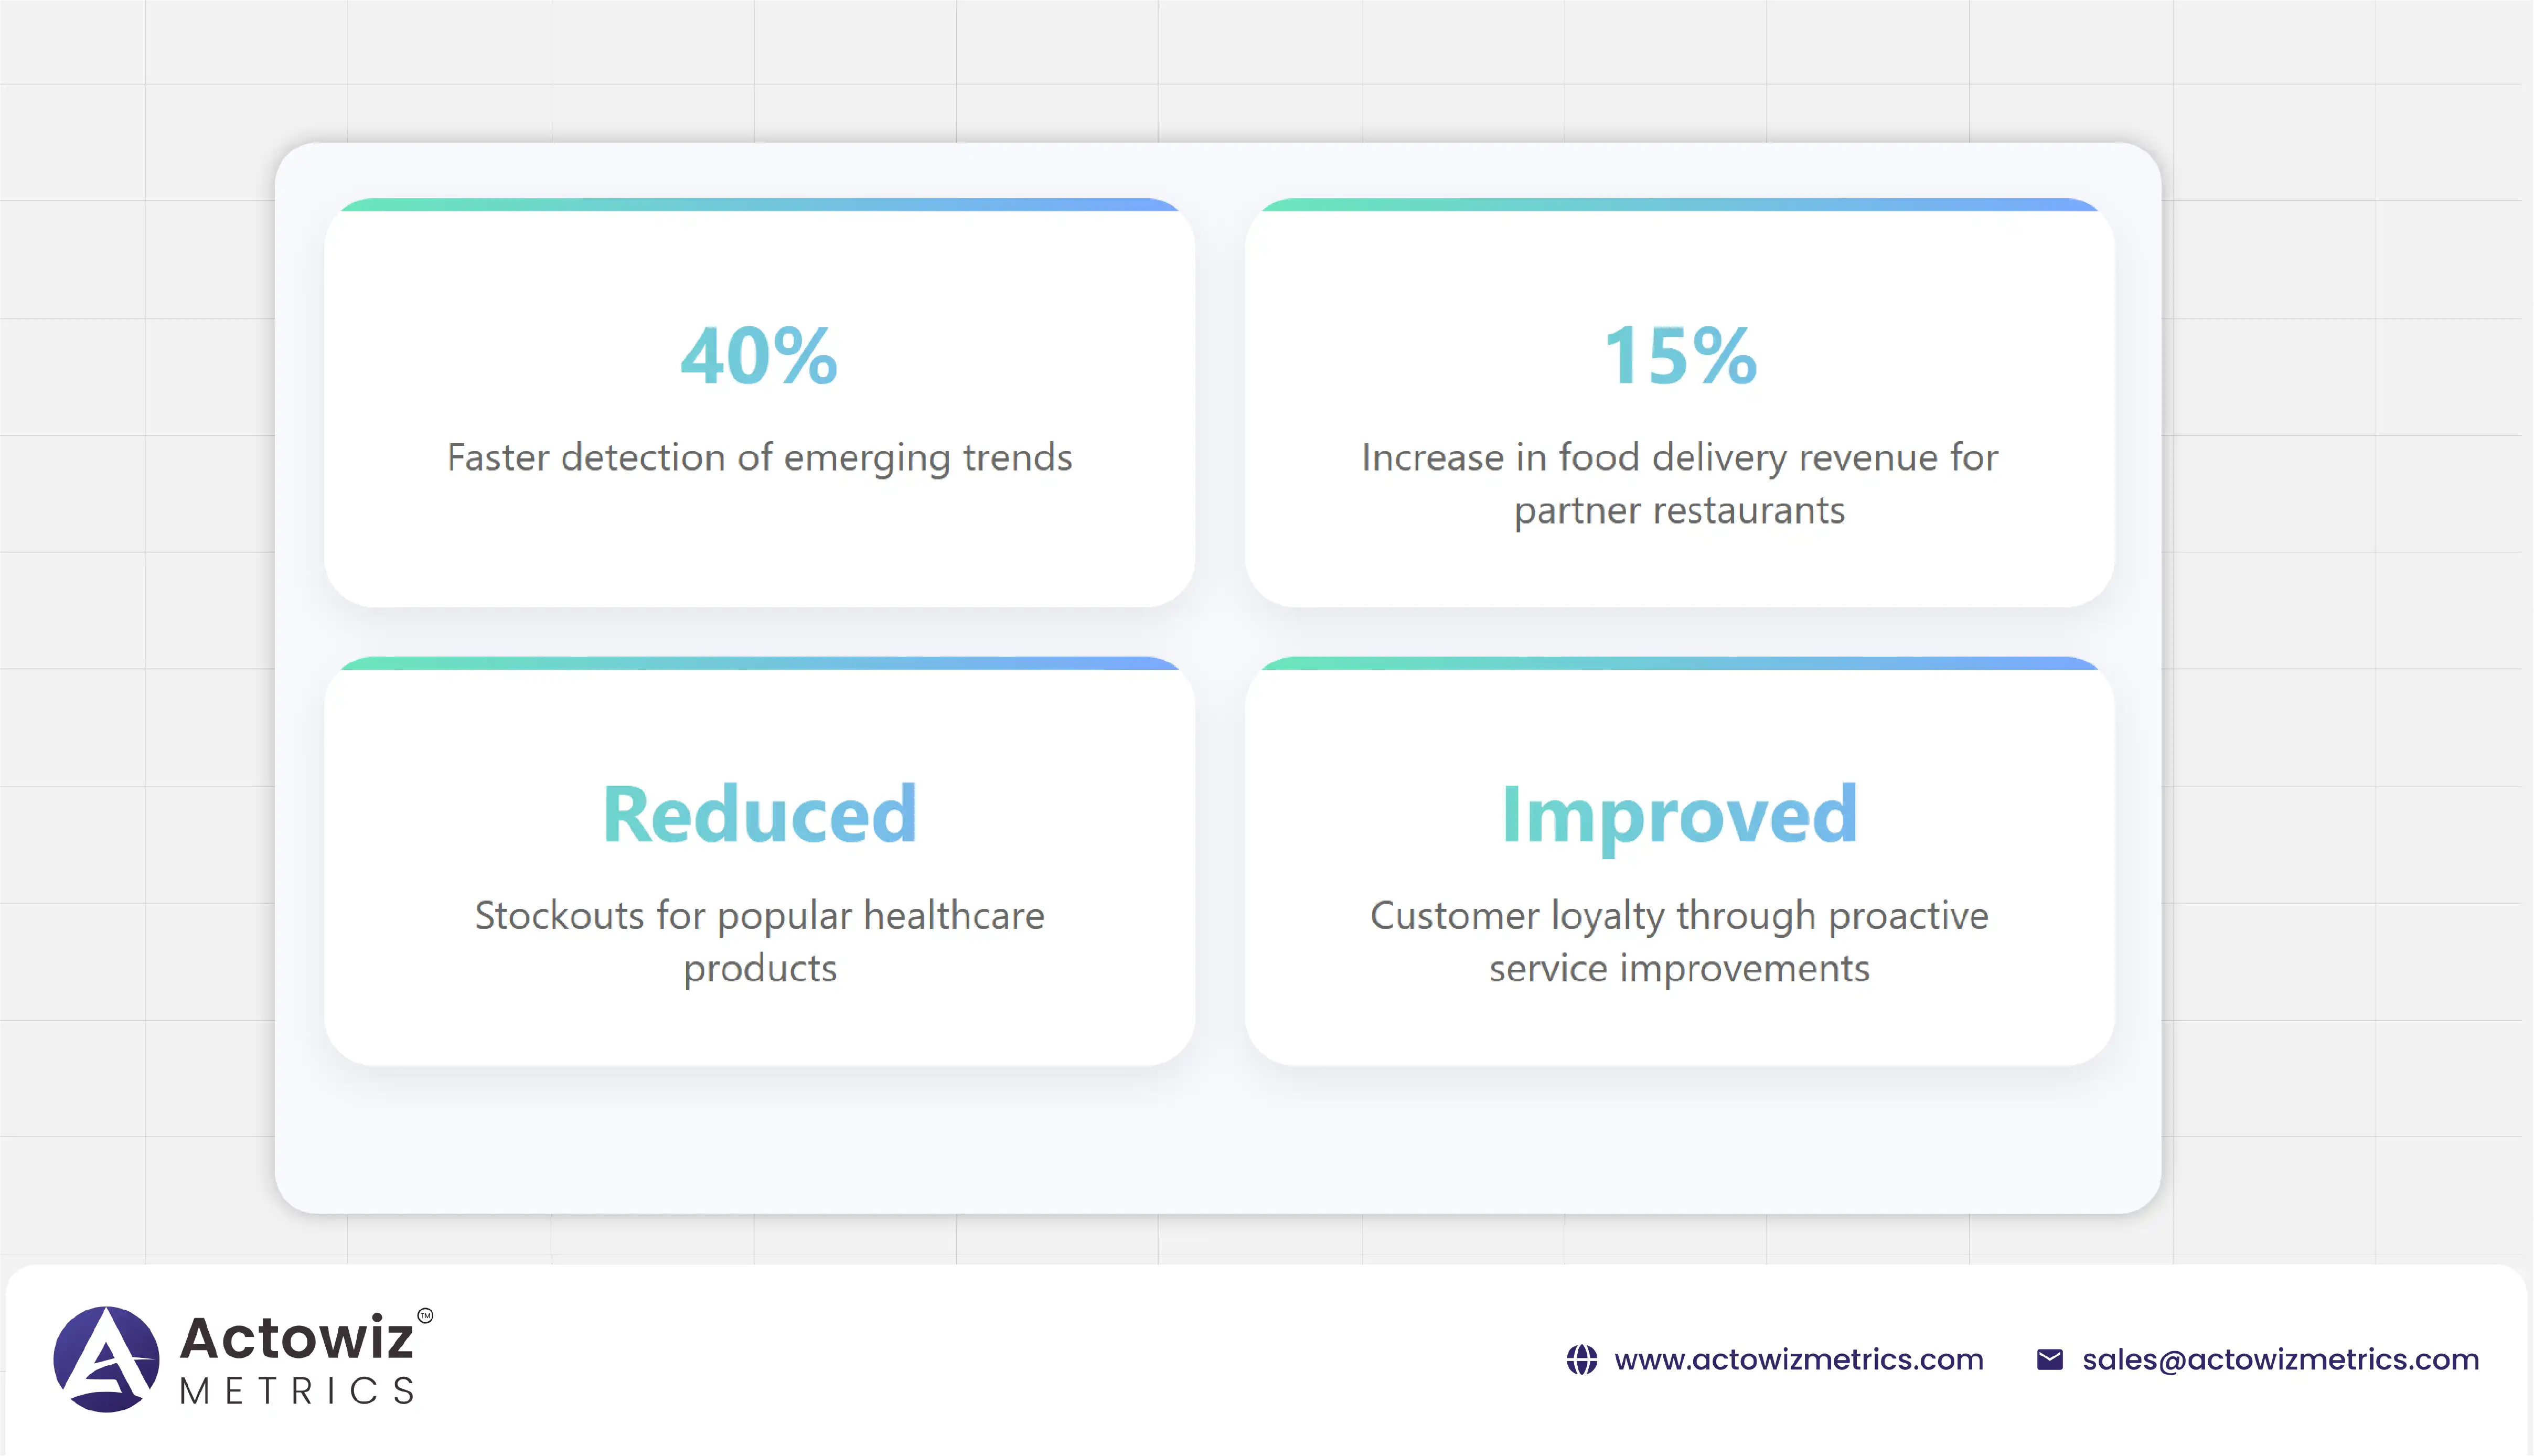
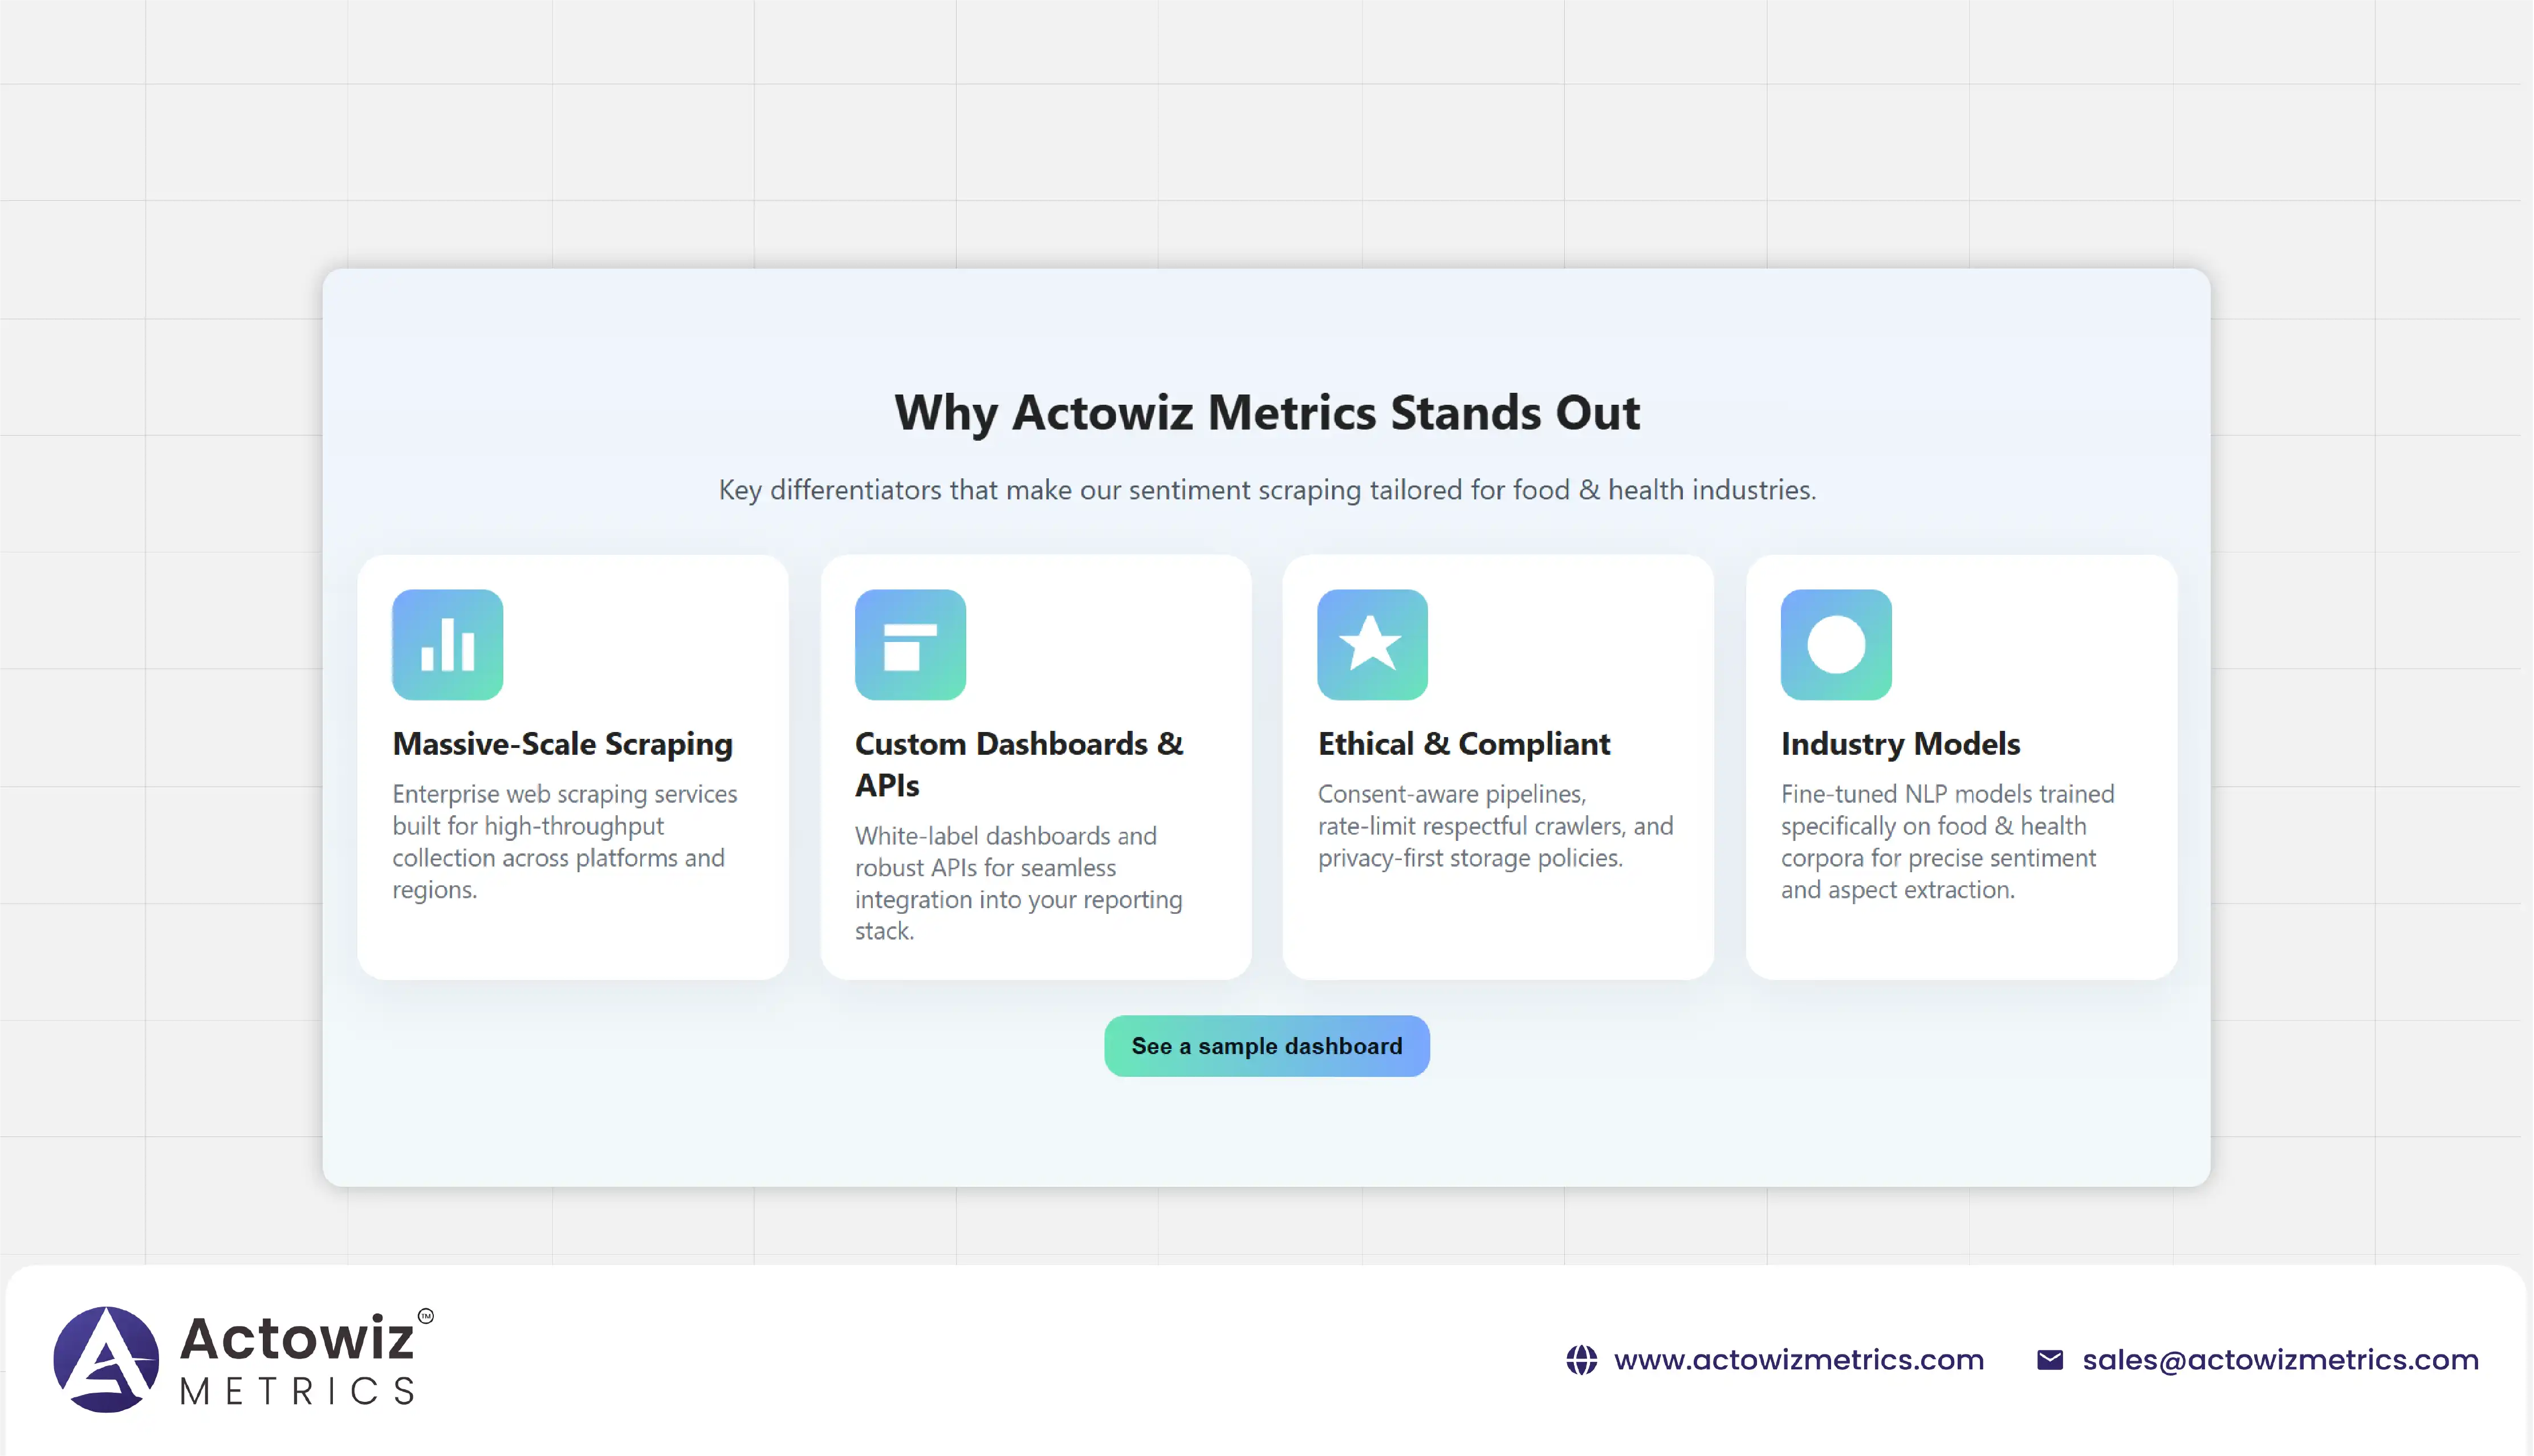
In competitive markets like India and UAE, real-time customer sentiment trends analysis isn’t optional — it’s a strategic necessity. Actowiz Metrics provides the technology, expertise, and scalability to ensure food & healthcare businesses stay ahead of consumer shifts.

Whatever your project size is, we will handle it well with all the standards fulfilled! We are here to give 100% satisfaction.
Any analytics feature you need — we provide it
24/7 global support
Real-time analytics dashboard
Full data transparency at every stage
Customized solutions to achieve your data analysis goals