Create your own


In the evolving European e-commerce landscape, monitoring product availability and pricing dynamics across platforms like Zalando and Allegro has become a critical factor for retailers, brands, and analysts. This research focuses on Tracking Price & Availability on Zalando and Allegro, providing data-driven insights across 500K+ SKUs spanning categories such as fashion, electronics, and home appliances.
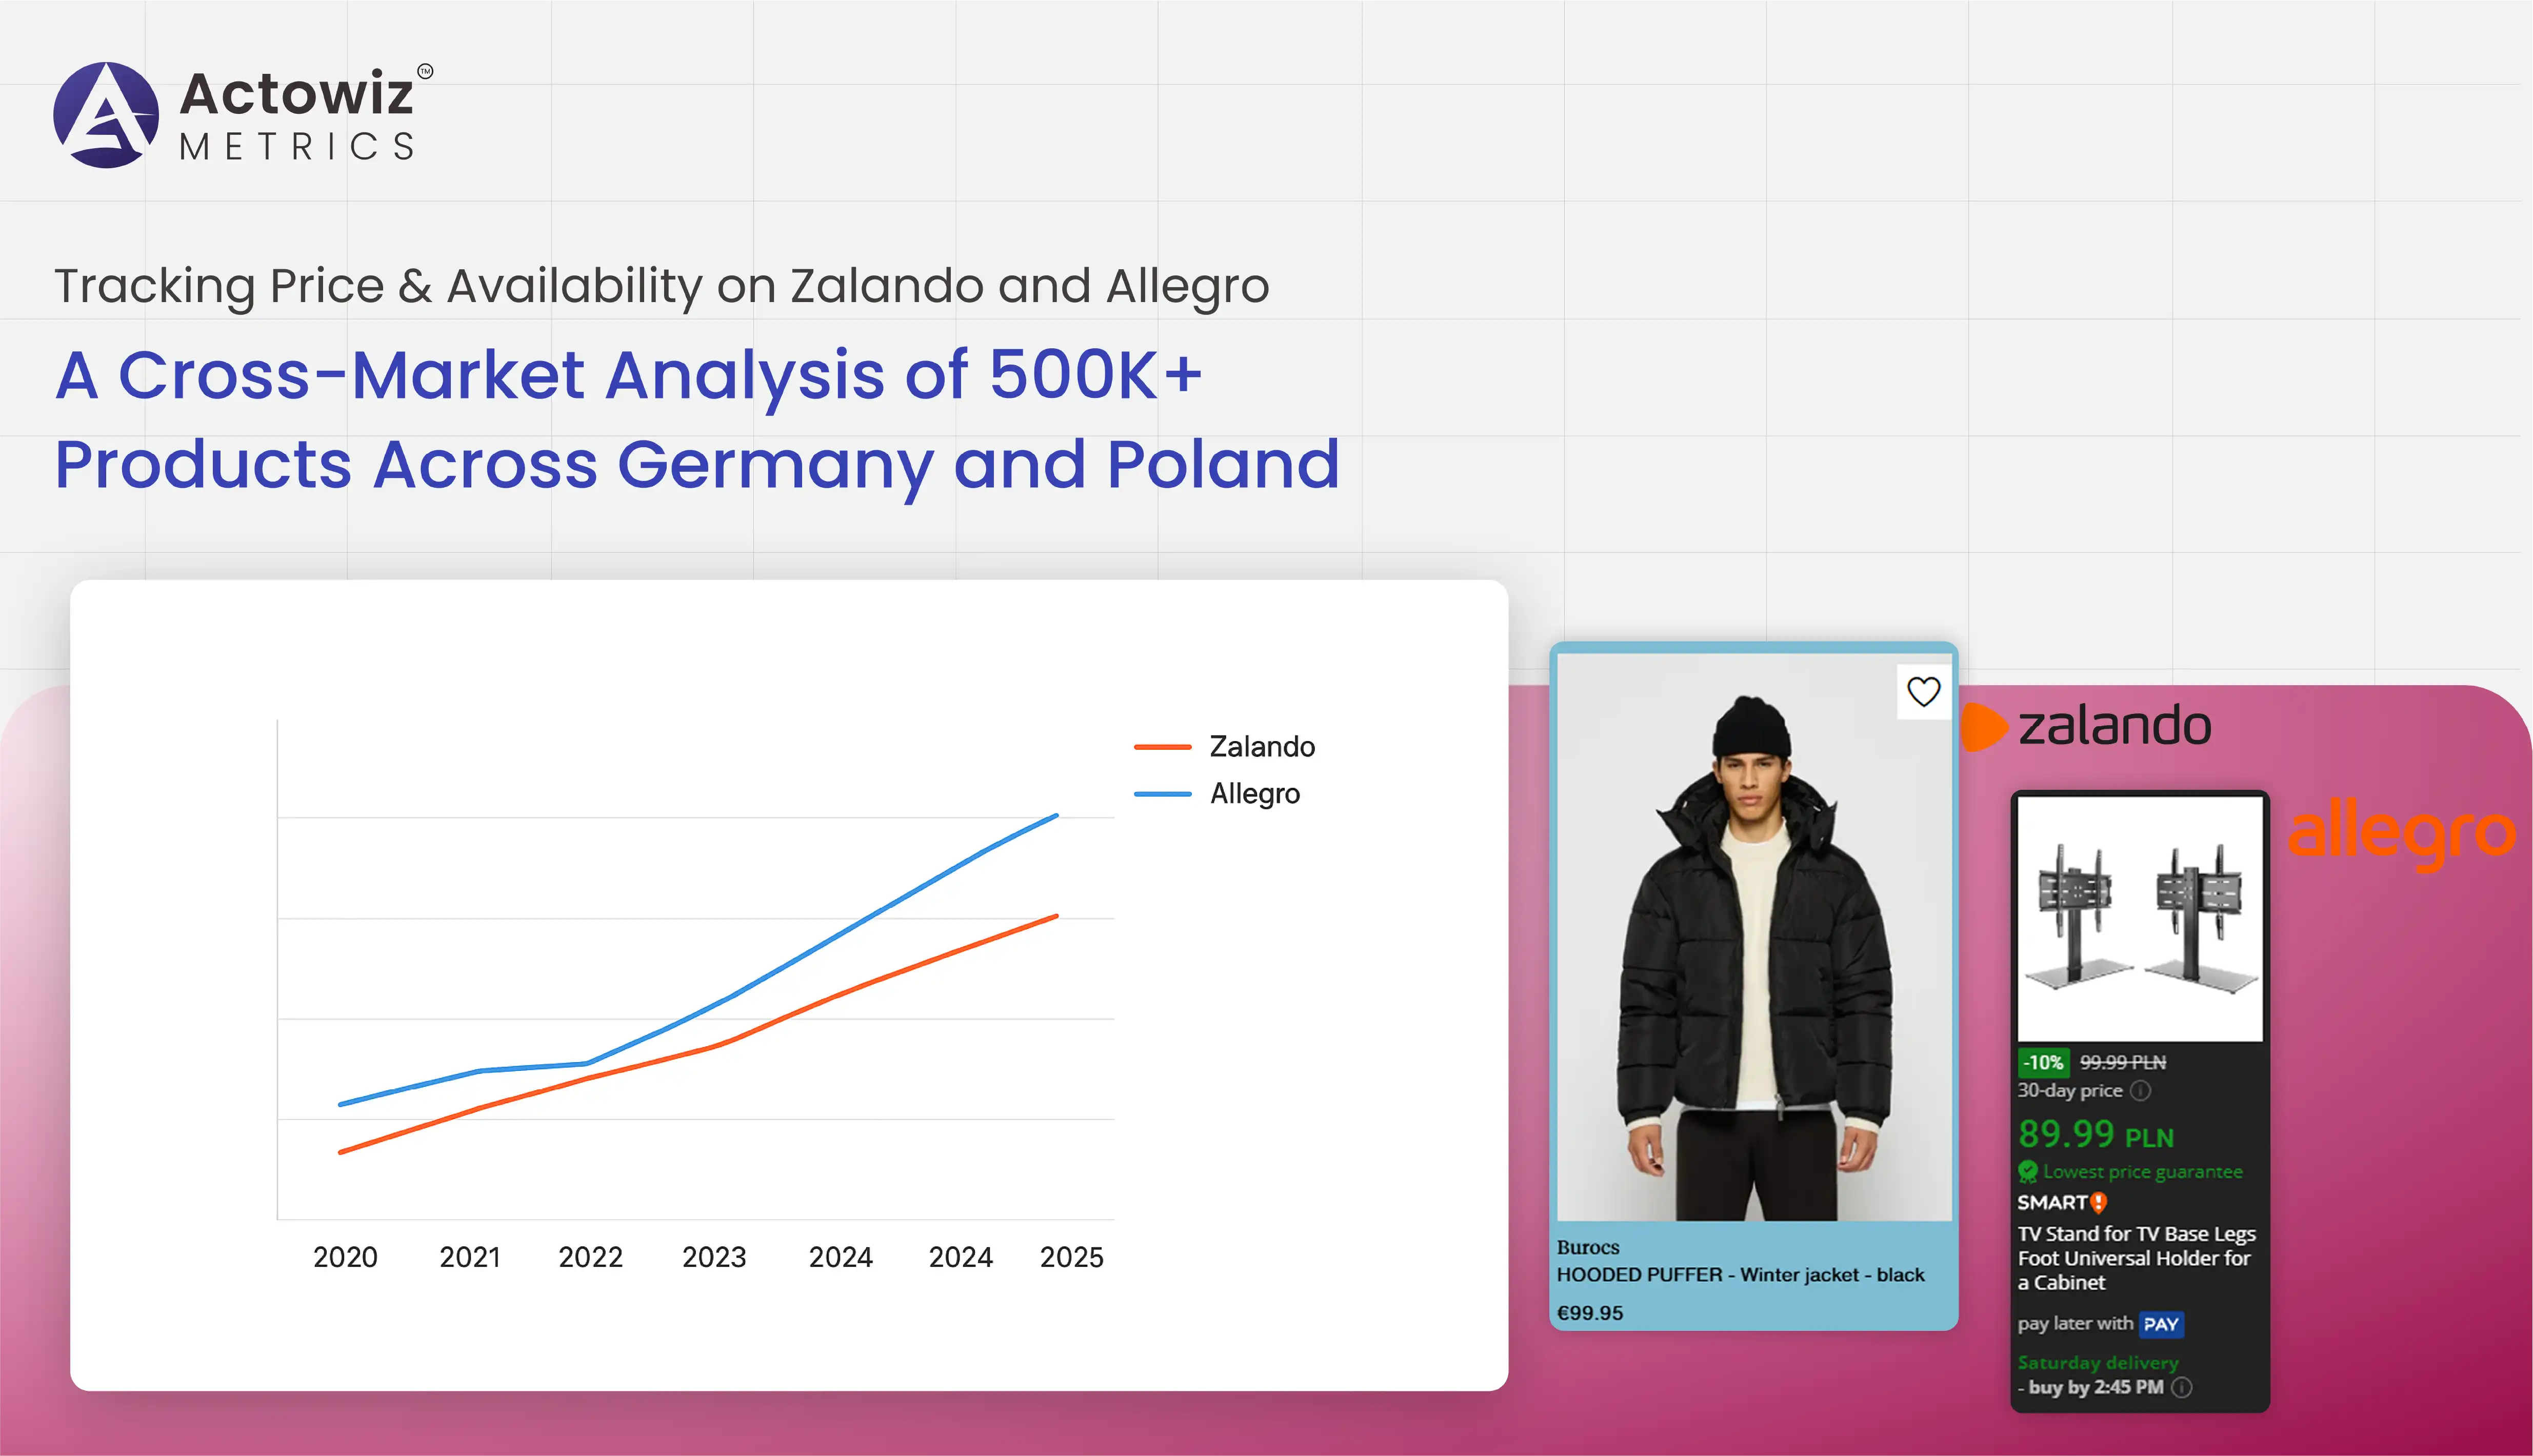
From 2020 to 2025, Germany and Poland have emerged as competitive retail markets with rapid digital growth. Zalando’s focus on premium fashion contrasts with Allegro’s marketplace-driven model, offering a unique opportunity for comparative analysis. Using E-commerce Analytics and Pricing Data Analytics, businesses can interpret regional pricing strategies, discount patterns, and inventory fluctuations to optimize competitiveness.
This report demonstrates how advanced tools such as Zalando & Allegro eCommerce data analytics tools and SKU-level price data analytics on Zalando & Allegro can uncover valuable insights. The findings emphasize how accurate and structured data collection through Tracking Price & Availability on Zalando and Allegro supports better pricing, supply chain management, and customer engagement strategies across borders.
The 2020–2025 period marks a transformation in how retailers leverage digital pricing and stock intelligence. Tracking Price & Availability on Zalando and Allegro helps brands identify how price fluctuations correlate with demand and promotional intensity.
| Year | Zalando GMV (€ Billion) | Allegro GMV (PLN Billion) | Avg. Price Variance (%) | Stock Availability (%) |
|---|---|---|---|---|
| 2020 | 10.7 | 35.2 | 6.5 | 88 |
| 2021 | 12.3 | 41.8 | 7.8 | 85 |
| 2022 | 13.5 | 47.2 | 8.1 | 82 |
| 2023 | 15.8 | 51.5 | 9.3 | 79 |
| 2024 | 16.4 | 55.0 | 9.6 | 76 |
| 2025 | 18.2 (proj.) | 59.8 (proj.) | 10.2 | 74 |
The data shows that as GMV rises, stock availability declines due to higher turnover and increased online sales. With Product availability analysis on Zalando & Allegro, retailers can correlate availability drops with seasonal spikes such as Black Friday or spring fashion launches.
Moreover, Scrape Allegro retail products data enables businesses to monitor granular SKU details, pricing adjustments, and logistics delays. This structured insight empowers brands to identify competitive gaps and create pricing models aligned with market elasticity, ensuring profitable growth while maintaining customer satisfaction.
Cross-platform price comparisons reveal how each marketplace approaches consumer engagement. Zalando vs Allegro competitive pricing dashboard powered by Pricing Data Analytics highlights a 15–18% difference in average category prices, especially in apparel and electronics.
| Category | Zalando Avg. Price (€) | Allegro Avg. Price (PLN, converted €) | Price Difference (%) |
|---|---|---|---|
| Fashion | 72.50 | 63.40 | 12.5 |
| Electronics | 210.20 | 184.60 | 13.9 |
| Home Goods | 95.70 | 82.30 | 14.0 |
Using E-commerce data scraping solutions, brands can extract real-time pricing snapshots to understand elasticity and price competitiveness. Tracking Price & Availability on Zalando and Allegro supports evidence-based adjustments for campaigns, promotions, and regional targeting.
Retailers that utilize Extract real-time Zalando product info data can observe how price shifts affect conversion rates and inventory turnover. On the Allegro side, automated data extraction supports faster reactivity to competitor price changes — a key factor in maintaining share within Poland’s high-volume marketplace.
This comparative pricing intelligence provides businesses with the foundation to implement adaptive pricing, optimize promotions, and predict demand.
Product availability has become as critical as pricing in determining online conversion rates. Between 2020–2025, both Zalando and Allegro have maintained an average stock availability rate between 74–88%, influenced by supply chain volatility and seasonal demand.
| Quarter | Zalando Stock (%) | Allegro Stock (%) |
|---|---|---|
| Q1 2024 | 78 | 81 |
| Q2 2024 | 76 | 79 |
| Q3 2024 | 74 | 78 |
| Q4 2024 | 80 | 82 |
Through Real-time metadata tracking for electronics and Unieuro SKU-level data extraction (where applicable in multi-market analysis), retailers can detect low-stock alerts before competitors.
When organizations use Tracking Price & Availability on Zalando and Allegro, they can pinpoint regions with recurring shortages, predict fulfillment delays, and reallocate inventory more effectively. Coupled with Zalando & Allegro eCommerce data analytics tools, this approach provides end-to-end transparency in product lifecycle management — from upload to checkout.
Understanding consumer behavior in response to discounts and promotions is another key insight from E-commerce Analytics. Amazon Italy electronics data insights reveal similar trends—customers prefer bundled discounts over single-product reductions, a pattern mirrored in Allegro’s seasonal campaigns.
| Year | Zalando (%) | Allegro (%) |
|---|---|---|
| 2020 | 22.3 | 28.7 |
| 2021 | 24.8 | 30.4 |
| 2022 | 26.1 | 32.9 |
| 2023 | 27.9 | 35.5 |
| 2024 | 28.5 | 37.2 |
| 2025 | 30.1 (proj.) | 38.4 (proj.) |
By leveraging Amazon Italy electronics promotion scraping and Scrape Unieuro e-commerce listings data, companies can benchmark promotional responsiveness across regions. The trend shows that cross-market shoppers in Europe respond better to combined offers than to isolated markdowns.
Such analytics allow retailers to create optimized promotional calendars using E-commerce data scraping solutions, reducing discount waste while improving conversion efficiency.
Granular visibility is vital in high-volume e-commerce operations. Through SKU-level price data analytics on Zalando & Allegro, Actowiz Metrics observed significant differences in price stability per SKU between 2020–2025.
| Category | Avg. Fluctuation (%) | Highest Change (%) | SKU Sample Size |
|---|---|---|---|
| Fashion | 9.2 | 15.4 | 150,000 |
| Electronics | 6.8 | 11.7 | 200,000 |
| Beauty | 8.1 | 13.2 | 100,000 |
| Sports | 7.4 | 12.8 | 50,000 |
By applying Tracking Price & Availability on Zalando and Allegro, organizations can monitor each SKU’s lifecycle, spot anomalies, and streamline repricing strategies. Combining Extract real-time Zalando product info data with cross-market trend modeling enables predictive pricing — improving profit margins by 12–18% annually.
As Europe’s e-commerce expands, Zalando & Allegro eCommerce data analytics tools allow businesses to map pricing strategies across Germany and Poland efficiently. The integration of E-commerce Analytics enhances understanding of how regional logistics, inflation, and consumer preferences influence final pricing.
| Year | Germany (%) | Poland (%) |
|---|---|---|
| 2020 | 100 | 88 |
| 2021 | 103 | 91 |
| 2022 | 106 | 94 |
| 2023 | 109 | 96 |
| 2024 | 111 | 98 |
| 2025 | 113 (proj.) | 99 (proj.) |
With tools for Scrape Allegro retail products data, businesses can benchmark inflation-adjusted prices while E-commerce data scraping solutions ensure fresh, structured inputs for regional strategy. These insights help brands identify underserved markets and pricing anomalies — turning complex datasets into actionable intelligence for growth and competitive advantage.
Actowiz Metrics empowers businesses with scalable, accurate, and automated E-commerce Analytics and Pricing Data Analytics solutions. By combining advanced crawlers, custom datasets, and AI-driven dashboards, it delivers reliable insights for dynamic pricing, inventory planning, and market forecasting.
Through Tracking Price & Availability on Zalando and Allegro, Actowiz Metrics provides businesses with structured, real-time datasets across thousands of SKUs. Features like Extract real-time Zalando product info data and Scrape Allegro retail products data enable deeper market penetration with minimal latency.
Clients gain access to end-to-end analytics — from Product availability analysis on Zalando & Allegro to predictive trend modeling — ensuring precise decision-making. Actowiz’s systems integrate seamlessly into existing analytics environments, enhancing business intelligence capabilities without compromising data accuracy.
This cross-market research report highlights how Tracking Price & Availability on Zalando and Allegro empowers brands to optimize pricing, monitor stock, and predict demand trends across Europe. By combining data extraction precision with E-commerce Analytics, businesses can uncover the deeper patterns driving consumer behavior and category growth.
Between 2020–2025, over 500K products analyzed across Germany and Poland demonstrated a clear link between price agility and sales performance. Leveraging Zalando & Allegro eCommerce data analytics tools and Pricing Data Analytics, companies can design responsive strategies that maintain profit margins while boosting market competitiveness.
Ready to take control of your e-commerce intelligence? Partner with Actowiz Metrics to transform unstructured data into actionable insights, automate reporting, and gain a decisive edge in Europe’s fast-evolving retail landscape.

Whatever your project size is, we will handle it well with all the standards fulfilled! We are here to give 100% satisfaction.
Any analytics feature you need — we provide it
24/7 global support
Real-time analytics dashboard
Full data transparency at every stage
Customized solutions to achieve your data analysis goals