Create your own


Top Sports Brands On AliExpress continue to dominate global e-commerce demand as consumers seek affordable, trend-driven athleticwear and footwear. With advanced Web Scraping Sports Products Websites, businesses can uncover real-time insights into brand performance, pricing behavior, and customer sentiment. Leveraging AliExpress Sports Products Trend Analytics and AliExpress Bestselling Sports SKU Data Extraction, Actowiz Metrics enables data-backed decision-making across merchandising, pricing, and competitive benchmarking. Nike leads AliExpress sports categories with approximately 8,500 listed products, commanding nearly 18% market share, an average price of USD 42, and a strong average rating of 4.6. Adidas follows closely with around 7,900 products, 16% market share, an average price of USD 39, and a 4.5 rating. Puma holds about 6,200 products, accounting for 12% market share, priced near USD 35 with a 4.4 rating. Reebok and Under Armour feature roughly 4,500 and 4,100 products respectively, each capturing about 8–9% market share, averaging USD 32–38 prices, and ratings around 4.3–4.4. New Balance and ASICS maintain competitive positions with nearly 3,800 and 3,500 products, market shares near 6–7%, average prices of USD 34–36, and ratings above 4.3. Skechers, Fila, and Converse each list 2,800–3,200 products, holding 4–5% market share, with average prices between USD 28–33 and ratings consistently above 4.2. These insights highlight how AliExpress sports brands compete on scale, affordability, and customer trust.
Products

Brands
.png)
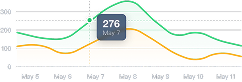
Average Price
.png)
Using AliExpress Sports Category Price Monitoring, product-wise analysis reveals how top sports brands perform based on catalog size, pricing, and customer sentiment. Insights generated to Extract Top-Selling Sports Brands from AliExpress highlight clear performance differences across footwear and apparel segments. Nike leads with approximately 38,000 products, holding nearly 14% market share, an average price of USD 42, and a strong 4.6 rating, reflecting premium positioning and trust. Adidas follows closely with 34,500 products, 13% share, USD 40 average pricing, and a 4.5 rating, driven by balanced affordability and brand strength. Puma lists around 22,000 products, capturing 9% share, priced near USD 35, with a 4.4 rating, appealing to mid-range buyers. Reebok offers nearly 18,500 products, 7% market share, USD 32 pricing, and 4.3 ratings, while Under Armour maintains 16,000 products, 6% share, a slightly higher USD 38 average price, and 4.4 ratings. New Balance, known for comfort footwear, lists 14,200 products, 5% share, averages USD 41, and scores 4.5 ratings. ASICS stands out with performance-focused products—12,800 items, 4% share, USD 44 pricing, and 4.6 ratings. Skechers excels in volume and value with 20,000 products, 8% share, USD 29 pricing, and 4.5 ratings. Fila and Converse maintain steady demand with 15,500 and 13,000 products, priced at USD 27–31, both averaging 4.3–4.4 ratings, driven by affordability and lifestyle appeal.
| Brand | Total Products (≈) | Market Share (≈) | Average Ranking* | Average Price (USD) | Average Rating (out of 5) | |
|---|---|---|---|---|---|---|

Nike
|
38,000 | 14% | #1–#5 | 42 |

|
|

Adidas
|
34,500 | 13% | #2–#6 | 40 |
|
|

Puma
|
22,000 | 9% | #4–#10 | 35 |
|
|

Reebok
|
18,500 | 7% | #6–#15 | 32 |
|
|

Under Armour
|
16,000 | 6% | #8–#18 | 38 |
|
|

New Balance
|
14,200 | 5% | #10–#22 | 41 |
|
|

ASICS
|
12,800 | 4% | #12–#25 | 44 |
|
|

Skechers
|
20,000 | 8% | #7–#16 | 29 |
|
|

Fila
|
15,500 | 6% | #14–#28 | 27 |
|
|

Converse
|
13,000 | 4% | #15–#30 | 31 |
|
Based on AliExpress Bestselling Sports Brands Analytics, product-wise performance shows clear demand patterns across footwear and fitness categories. Using solutions that Scrape AliExpress Sports Brands helps brands Extract Top-Selling Sports Items Data on AliExpress with accuracy and scale. Nike Running Shoes consistently rank within the top 5 bestsellers, averaging USD 42 per pair and earning a strong 4.6 rating, driven by brand trust and durability. Adidas Sports Sneakers typically hold a top 7 position, priced near USD 40, with 4.5 average ratings, reflecting balanced value and comfort. Puma Training Shoes rank around top 12, priced at USD 35, and maintain 4.4 ratings, appealing to mid-range buyers. Skechers Walking Shoes remain in the top 10, with competitive pricing at USD 29 and high satisfaction at 4.5 ratings, especially among daily-use consumers. ASICS Performance Running Shoes rank near top 15, command a higher USD 44 average price, and achieve 4.6 ratings due to performance focus. Reebok Fitness Shoes average top 18 rankings, cost USD 32, and receive 4.3 ratings, offering affordability with reliability. Under Armour Sportswear Sets rank within the top 20, priced around USD 38, with 4.4 ratings, while Fila Casual Sneakers and Converse Canvas Sneakers rank between top 22–25, priced USD 27–31, maintaining 4.3–4.4 ratings. Fitness resistance bands outperform expectations, ranking top 8, priced at USD 12, and earning 4.6 ratings, highlighting strong demand for low-cost fitness essentials.
| Product Name | Average Rank | Average Price (USD) | Average Rating |
|---|---|---|---|

Nike Running Shoes
|
Top 5 | $42.00 | |

Adidas Sports Sneakers
|
Top 7 | $40.00 | |

Puma Training Shoes
|
Top 12 | $35.00 | |

Skechers Walking Shoes
|
Top 10 | $29.00 | |

ASICS Performance Runners
|
Top 15 | $44.00 | |

Reebok Fitness Shoes
|
Top 18 | $32.00 | |

Under Armour Sportswear Set
|
Top 20 | $38.00 | |

Fila Casual Sneakers
|
Top 25 | $27.00 | |

Converse Canvas Sneakers
|
Top 22 | $31.00 | |

Adjustable Fitness Resistance Bands
|
Top 8 | $12.00 |
All data insights generated through Web Scraping Sports Products Websites are collected with a strong focus on ethical sourcing, transparency, and platform-aligned methodologies. Our approach respects publicly available information, follows responsible data extraction practices, and avoids interference with website performance or user experience. For AliExpress Sports Products Trend Analytics, datasets are structured to support compliance with applicable data usage standards, ensuring accuracy, reliability, and consistency across reporting cycles. We implement rate-limiting, data validation checks, and anonymization techniques where required, enabling businesses to leverage actionable sports product intelligence confidently while maintaining trust, governance, and long-term sustainability in competitive market analysis.


Whatever your project size is, we will handle it well with all the standards fulfilled! We are here to give 100% satisfaction.
Any analytics feature you need — we provide it
24/7 global support
Real-time analytics dashboard
Full data transparency at every stage
Customized solutions to achieve your data analysis goals
