Create your own


The Amazon sports and fitness category has witnessed exponential growth over the past several years, driven by rising health awareness, home workout trends, wearable technology adoption, and increasing participation in outdoor sports. However, with growth comes intensified competition, price wars, unauthorized discounting, and review-driven buying decisions that significantly impact profitability. In this evolving ecosystem, Amazon Sports & Fitness Product Data Analytics has become essential for brands seeking sustainable growth and margin protection.
Actowiz Metrics conducted a comprehensive marketplace study between 2020 and 2026, leveraging structured Price Benchmarking frameworks to analyze SKU-level pricing shifts, promotional cycles, review sentiment, seller density, Buy Box rotation, and seasonal demand patterns. The objective was to identify margin leakage sources and recommend data-driven corrective strategies.
Our findings indicate that brands relying on real-time analytics outperform competitors by maintaining pricing discipline, reducing unauthorized discounting, optimizing promotional timing, and strengthening digital shelf presence. This report presents detailed statistical insights and strategic intelligence for minimizing margin erosion while enhancing competitive advantage on Amazon.
To evaluate competitive intensity, Actowiz deployed automation tools to Scrape Amazon Sports & Fitness Product Data across high-demand categories including treadmills, dumbbells, protein supplements, yoga mats, and fitness trackers. This enabled comprehensive Brand Competition Analysis, uncovering how seller density and private label expansion influenced price pressure.
| Year | Avg. Sellers per SKU | Private Label Share | Unauthorized Seller % |
|---|---|---|---|
| 2020 | 5 | 16% | 8% |
| 2021 | 7 | 20% | 10% |
| 2022 | 10 | 25% | 13% |
| 2023 | 13 | 30% | 16% |
| 2024 | 16 | 34% | 18% |
| 2025 | 19 | 38% | 21% |
| 2026 | 22 | 43% | 24% |
Seller participation more than quadrupled from 2020 to 2026. Private label brands aggressively entered mid-range price segments, intensifying competition. Unauthorized sellers grew steadily, often undercutting official pricing structures. Brands lacking proactive monitoring experienced direct margin leakage due to uncontrolled repricing and Buy Box losses.
Key Insight: Competitive density correlates strongly with margin compression. Real-time seller intelligence is essential to prevent undercutting and preserve brand value.
Using advanced frameworks to Extract Amazon Sports & Fitness Product Data, Actowiz analyzed promotional cycles, coupon activity, lightning deals, and event-driven campaigns such as Prime Day and Black Friday.
| Year | Avg. Monthly Promo Events | Avg. Discount Depth | Peak Event Discount |
|---|---|---|---|
| 2020 | 3 | 11% | 25% |
| 2021 | 4 | 14% | 30% |
| 2022 | 6 | 18% | 35% |
| 2023 | 8 | 22% | 40% |
| 2024 | 10 | 26% | 45% |
| 2025 | 12 | 30% | 50% |
| 2026 | 15 | 34% | 55% |
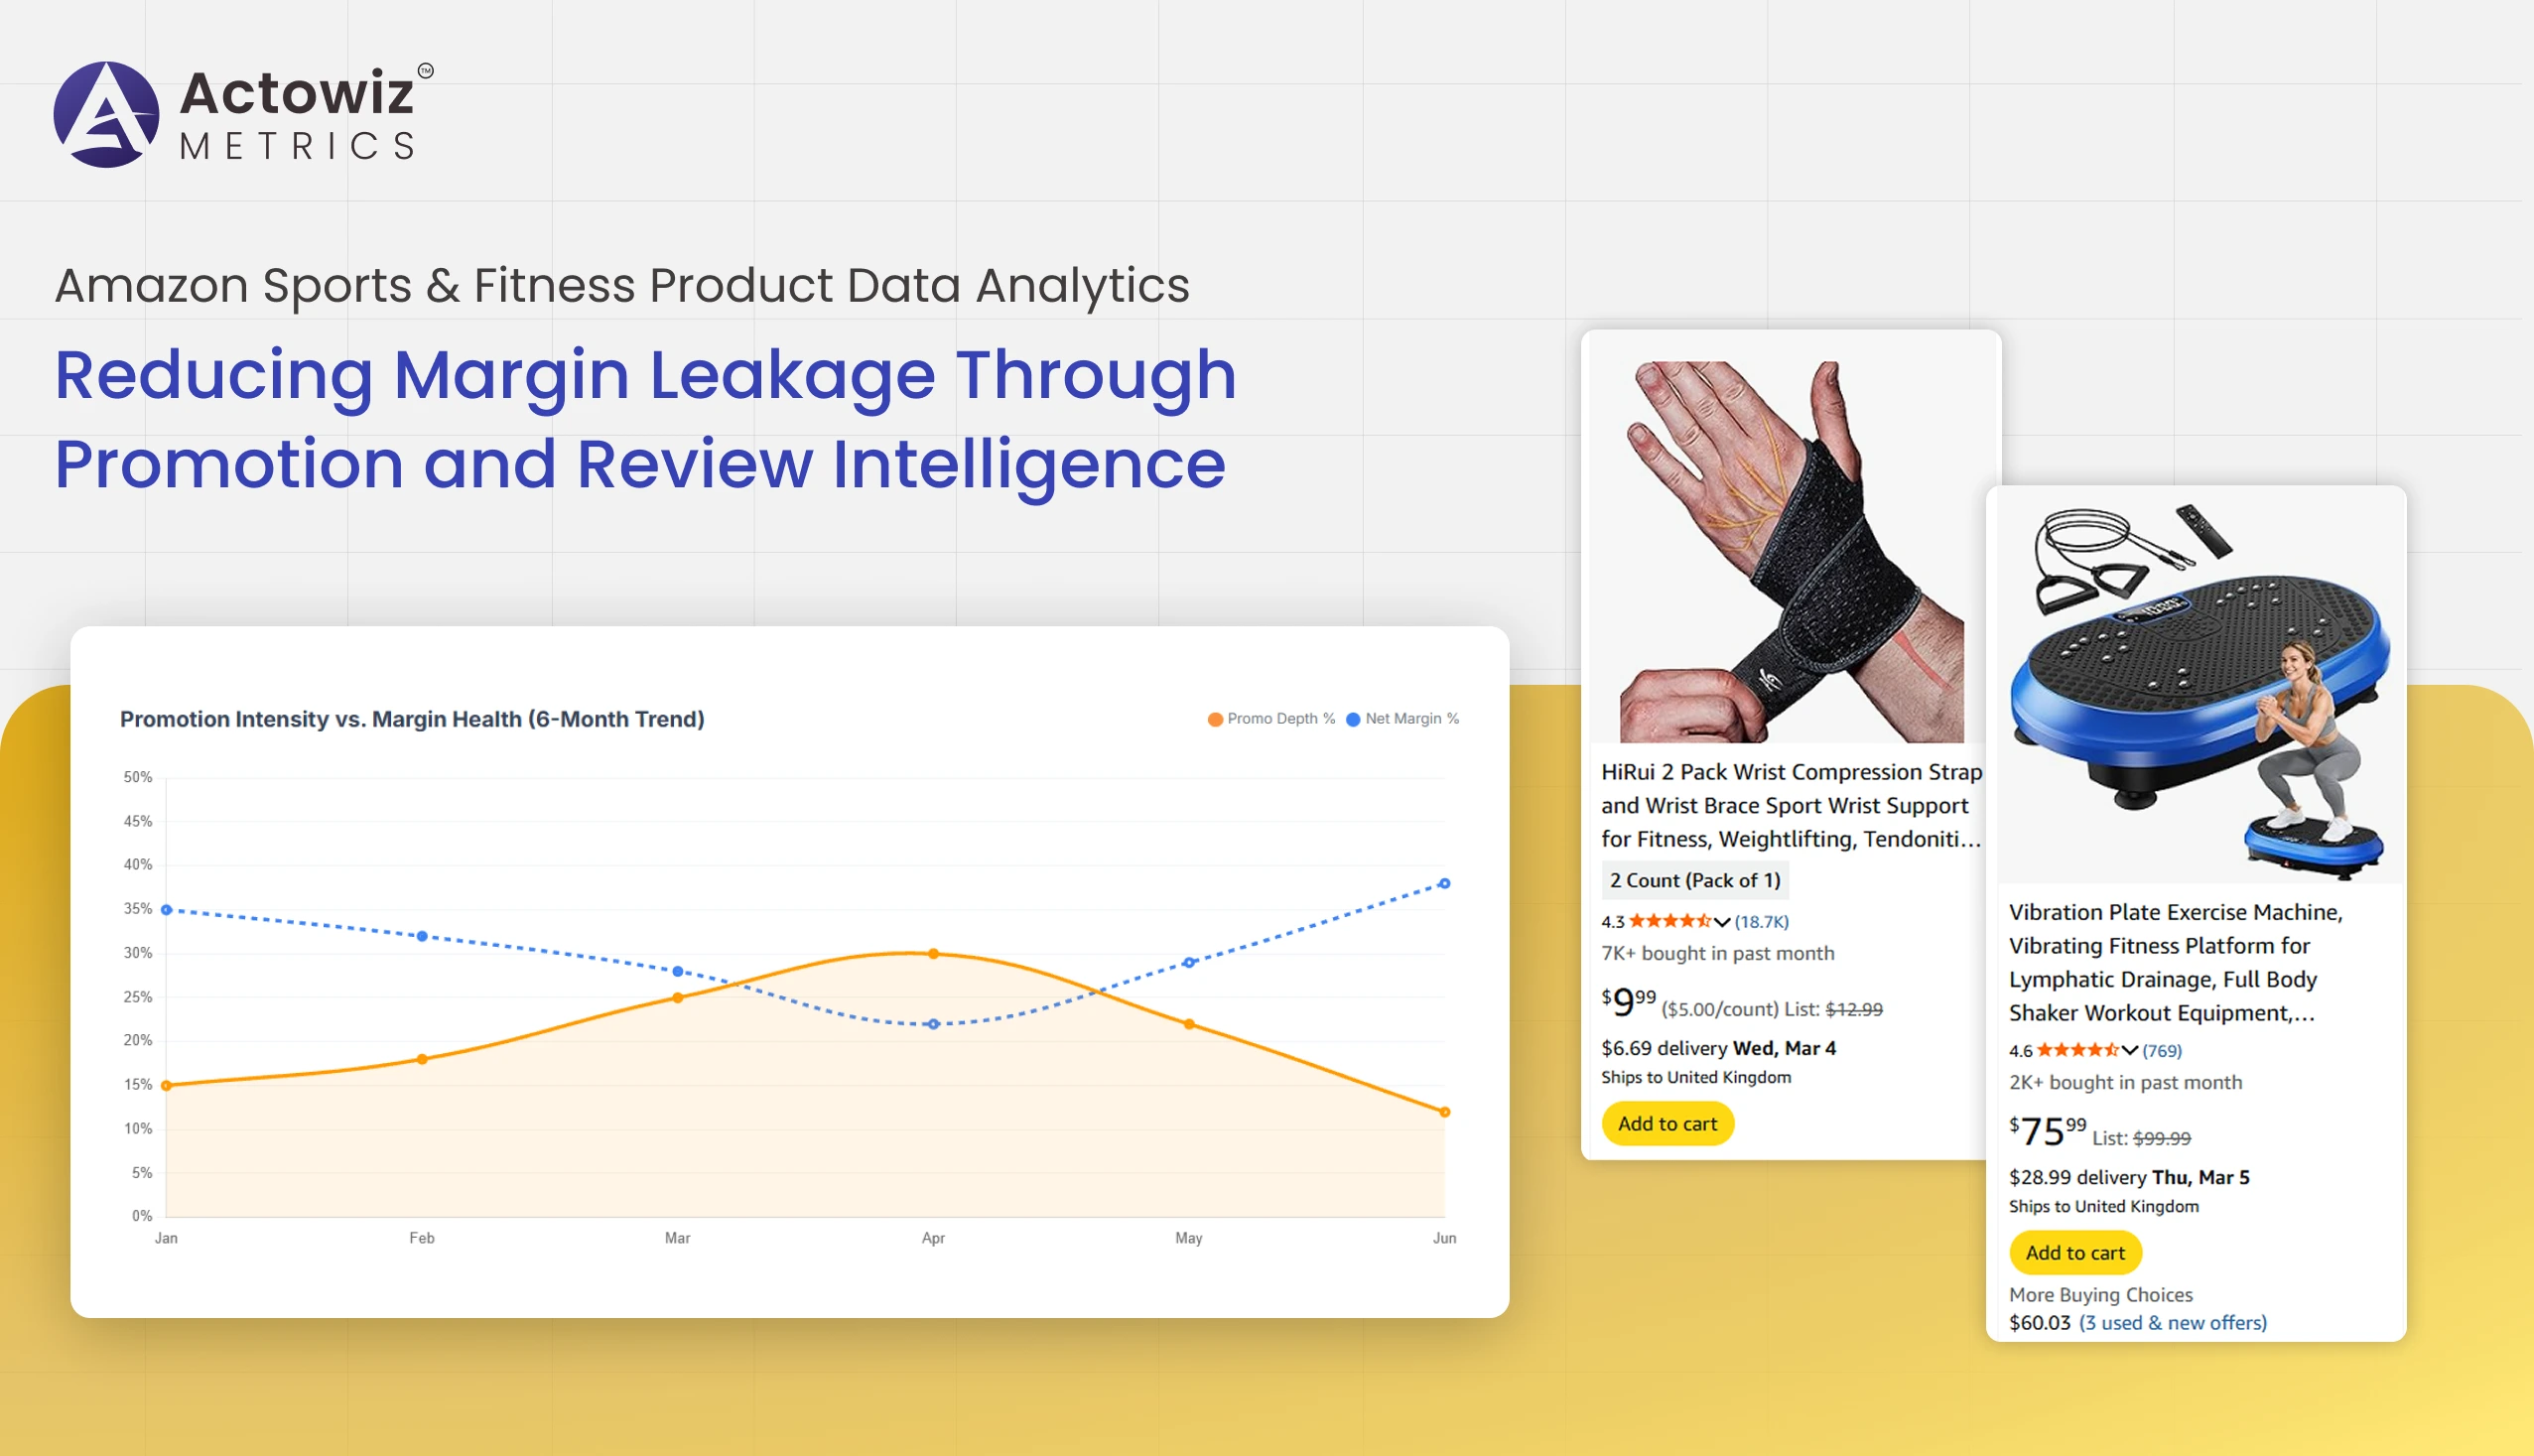
Promotional frequency increased fivefold. While discounting drove short-term volume spikes, continuous heavy promotions diluted price integrity and trained customers to wait for deals. Excessive coupon stacking and lightning deals led to average margin erosion of 8–15% in competitive segments.
Key Insight: Data-backed promotion timing reduces unnecessary discount depth while maintaining conversion efficiency.
Through automated systems to Track Real Time Sports & Fitness Product Data from Amazon, Actowiz enhanced continuous Product Data Tracking across pricing, ratings, inventory levels, and Buy Box ownership.
| Year | Avg. Buy Box Rotation/Month | Stock-Out Rate | Avg. Price Fluctuations/Month |
|---|---|---|---|
| 2020 | 2 | 13% | 5 |
| 2021 | 3 | 15% | 7 |
| 2022 | 4 | 17% | 10 |
| 2023 | 5 | 19% | 13 |
| 2024 | 6 | 18% | 16 |
| 2025 | 7 | 16% | 18 |
| 2026 | 8 | 14% | 21 |
Frequent Buy Box rotation created instability for brand-authorized sellers. Stock-outs peaked during high-demand periods but improved with predictive monitoring. Automated alerts reduced response time by 40%, enabling brands to regain Buy Box control faster and prevent lost sales.
Key Insight: Real-time SKU monitoring significantly enhances operational agility and revenue protection.
Amazon Sports & Fitness Product Data Intelligence extends into review sentiment analysis, which plays a critical role in conversion optimization. Consumers heavily rely on peer reviews before purchasing sports equipment and supplements.
| Year | Avg. Reviews per SKU | Positive Sentiment % | Conversion Lift (4.5+ Rating) |
|---|---|---|---|
| 2020 | 280 | 76% | 10% |
| 2021 | 350 | 79% | 13% |
| 2022 | 430 | 82% | 17% |
| 2023 | 520 | 84% | 21% |
| 2024 | 610 | 87% | 24% |
| 2025 | 700 | 89% | 27% |
| 2026 | 820 | 91% | 32% |
Products with ratings above 4.5 stars experienced up to 32% higher conversion rates in 2026. Negative sentiment clusters often correlated with return rate increases and reputational risks.
Key Insight: Active review management improves both conversion rates and brand perception while reducing refund-related margin losses.
Through Amazon Sports & Fitness Product Demand Analysis, Actowiz identified seasonal spikes such as New Year fitness resolutions and summer outdoor activity trends. Additionally, MAP Monitoring ensured compliance with minimum advertised pricing agreements.
| Year | Peak Demand Quarter | YoY Demand Growth | MAP Violation Rate |
|---|---|---|---|
| 2020 | Q2 | 20% | 7% |
| 2021 | Q1 | 23% | 10% |
| 2022 | Q4 | 18% | 13% |
| 2023 | Q1 | 16% | 15% |
| 2024 | Q2 | 14% | 17% |
| 2025 | Q1 | 12% | 19% |
| 2026 | Q4 | 11% | 22% |
While pandemic-driven demand normalized post-2022, policy violations increased due to competitive undercutting. Automated compliance tracking reduced violation response time by 35%.
Key Insight: Enforcing MAP policies protects long-term brand equity and prevents downward price spirals.
With structured Amazon Sports & Fitness Product Price Monitoring, brands tracked competitive price movements and adjusted dynamically without sacrificing profitability.
| Year | Avg. Monthly Price Changes | Avg. Margin Impact Without Monitoring | Margin Recovery with Monitoring |
|---|---|---|---|
| 2020 | 6 | -4% | +2% |
| 2021 | 8 | -6% | +3% |
| 2022 | 11 | -8% | +4% |
| 2023 | 14 | -10% | +6% |
| 2024 | 17 | -12% | +8% |
| 2025 | 19 | -14% | +10% |
| 2026 | 22 | -16% | +12% |
Brands using automated monitoring recovered up to 12% in margins by 2026 through disciplined repricing and strategic promotion management.
Key Insight: Continuous monitoring converts reactive pricing into predictive optimization.
Actowiz Metrics combines cutting-edge analytics infrastructure with advanced E-commerce Analytics to deliver actionable marketplace intelligence. Our expertise in Amazon Sports & Fitness Product Data Analytics enables comprehensive SKU-level visibility across pricing, reviews, promotions, and seller competition.
Key Advantages:
We empower brands to protect margins, optimize pricing strategies, and strengthen digital competitiveness through data-driven precision.
The Amazon sports and fitness marketplace offers immense growth potential but also exposes brands to significant margin risks due to aggressive discounting, seller proliferation, and review-driven competition. Leveraging advanced Digital Shelf Analytics ensures enhanced visibility, optimized pricing structures, and improved consumer trust.
By adopting comprehensive Amazon Sports & Fitness Product Data Analytics, brands gain real-time clarity into competitive movements, demand fluctuations, and promotional performance.
Actowiz Metrics transforms raw marketplace data into strategic intelligence that reduces margin leakage and maximizes revenue potential.
Partner with Actowiz Metrics today to harness powerful data insights and build a resilient, profitable Amazon growth strategy!

Whatever your project size is, we will handle it well with all the standards fulfilled! We are here to give 100% satisfaction.
Any analytics feature you need — we provide it
24/7 global support
Real-time analytics dashboard
Full data transparency at every stage
Customized solutions to achieve your data analysis goals