BLOG


In an era dominated by rapid digital commerce growth, our 2025 report delves into the landscape of Electronics Products analysis on Amazon to offer brands, retailers, and analysts a detailed view of performance, pricing, ratings, and deal dynamics. The global market for consumer electronics continues to expand, but sellers on Amazon face increasing complexity: reacting to shifting pricing patterns, evolving consumer reviews, and competitive brand strategies. This report addresses these challenges and provides actionable insights by analysing historical data from 2020-2025, uncovering which segments are accelerating, where margin pressure is greatest, and how top-of-funnel visibility correlates with sales. With a focus on Amazon Bestselling Electronics Brands Analytics, we explore how the interplay of price, inventory availability, brand power, and promotion events shape outcomes. By integrating Real-time electronics product availability analysis, stakeholders gain up-to-the-minute visibility into stock levels and market trends. The goal is to enable brands, retailers, and analysts to adopt data-driven strategies that leverage real-time and historical intelligence in a highly dynamic marketplace.
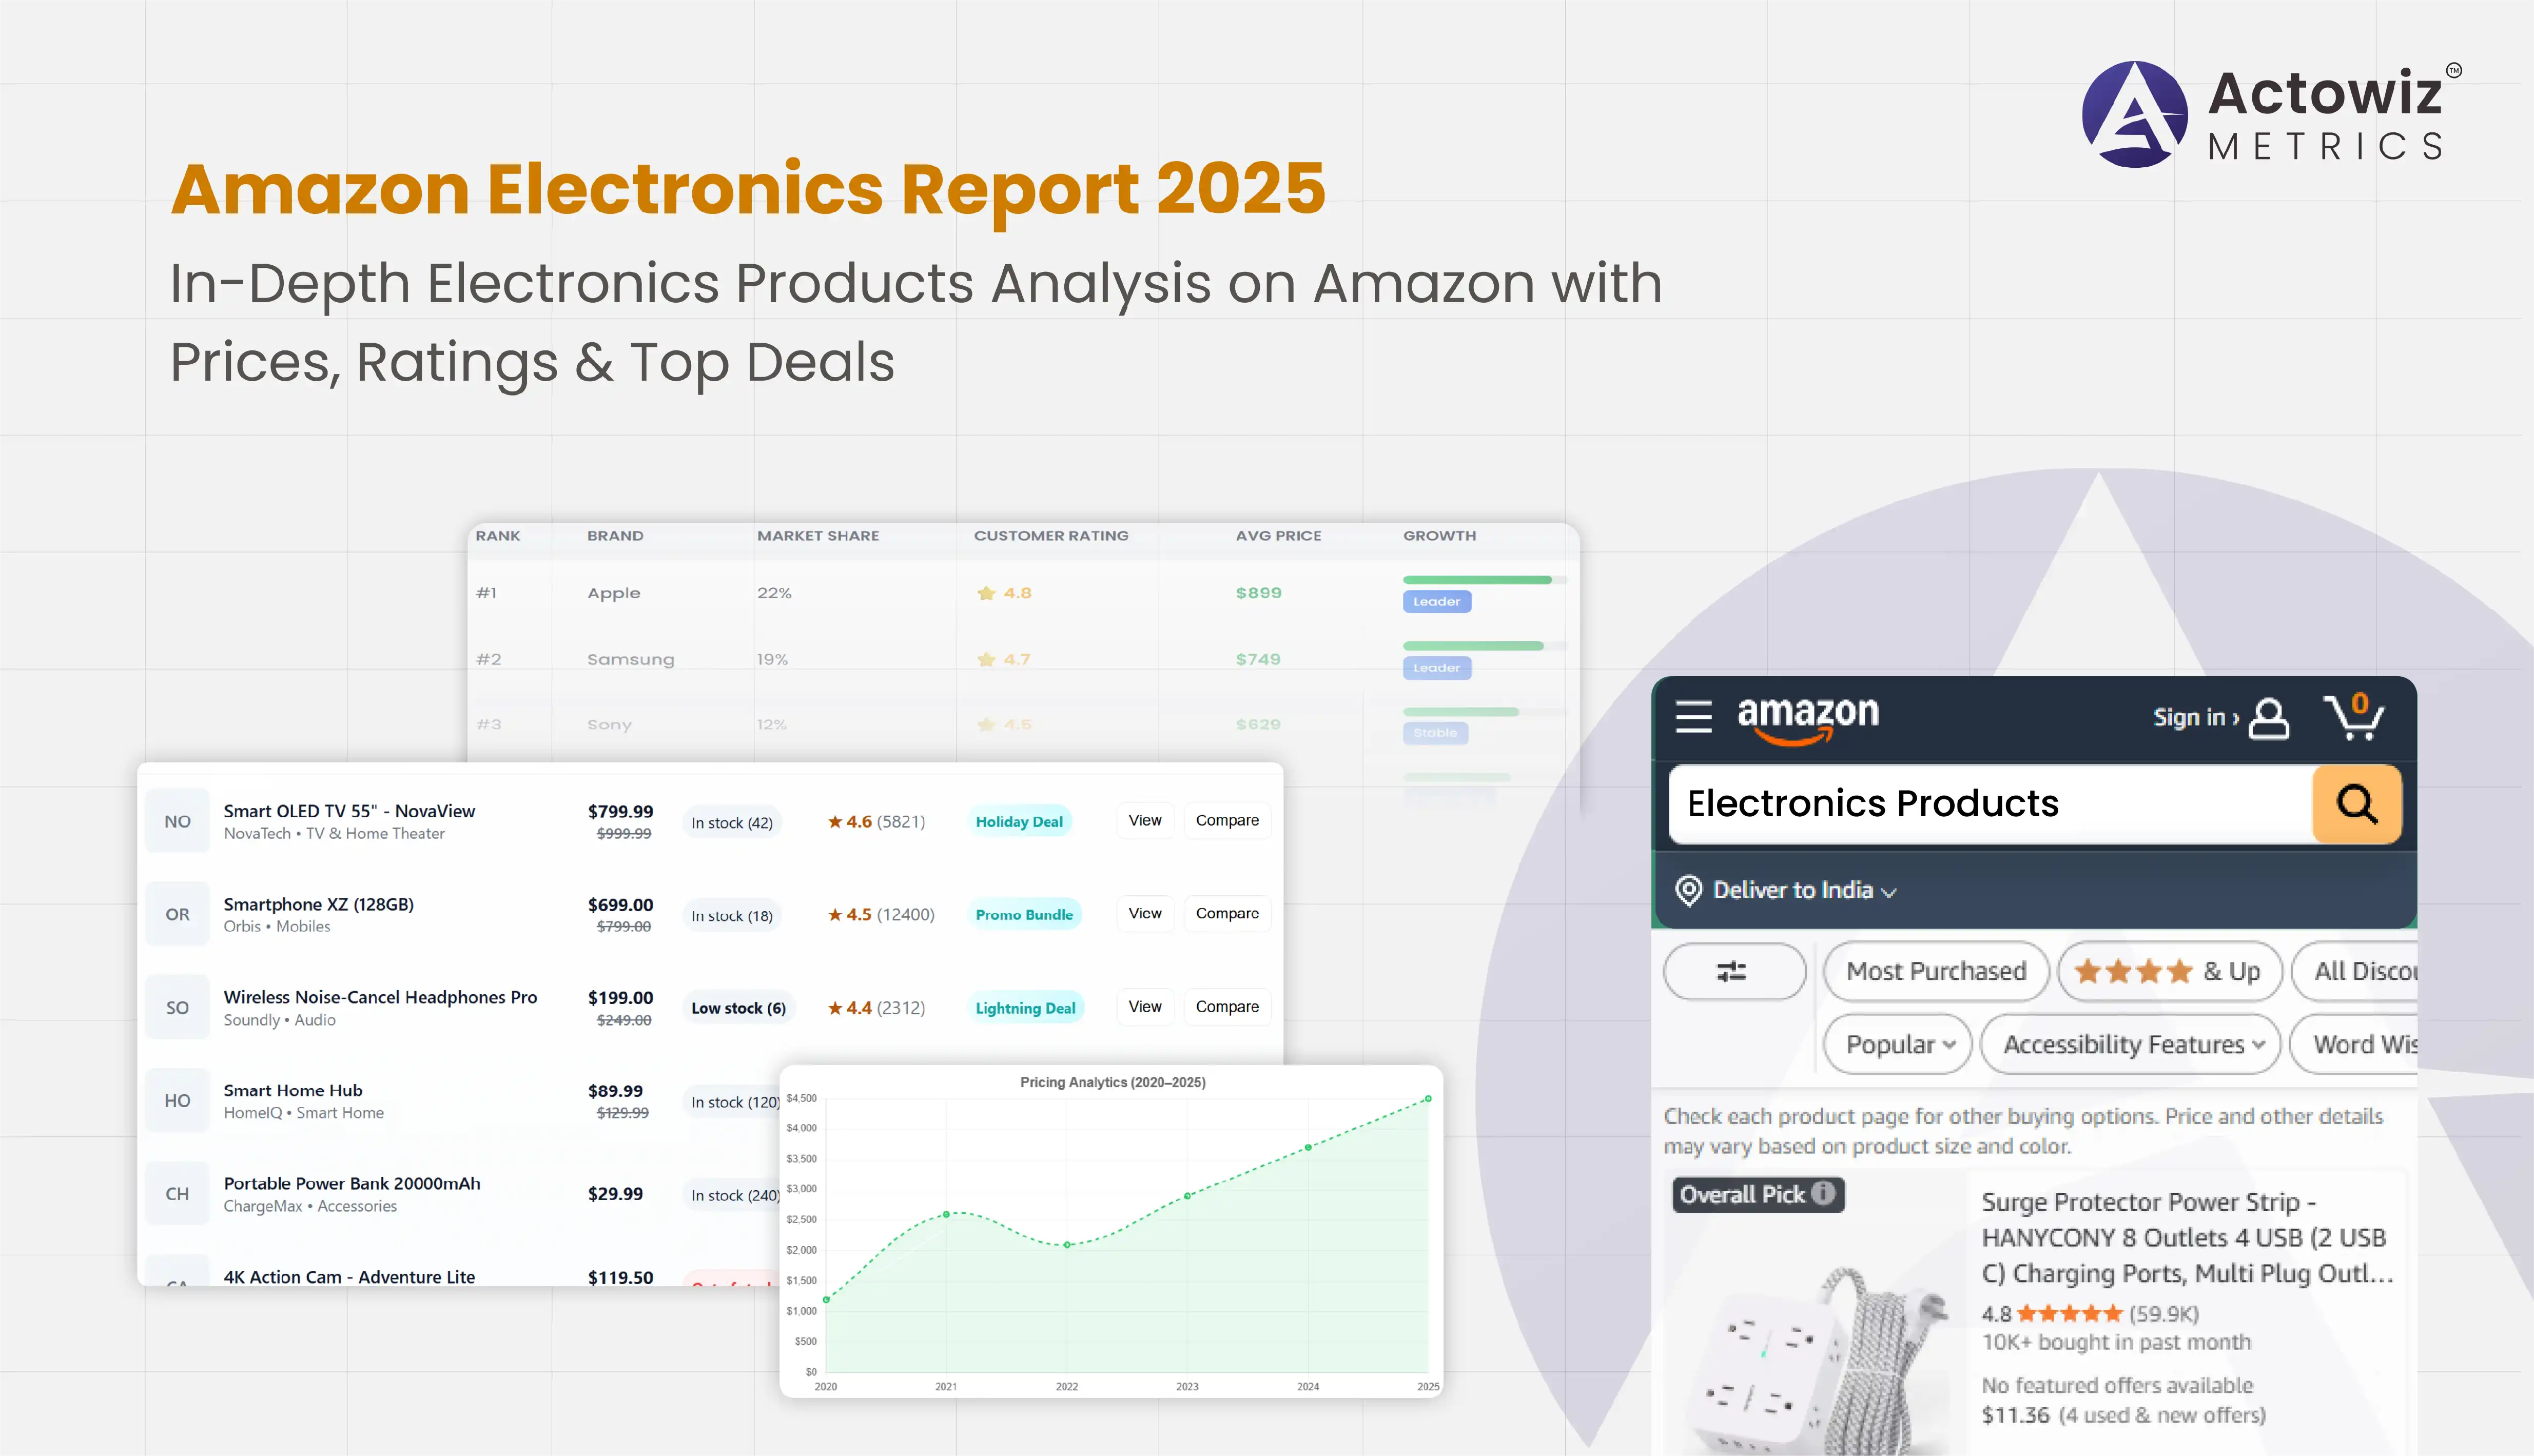
The Top electronics brands analysis on Amazon from 2020 to 2025 reveals significant shifts in market dominance, price strategy, consumer loyalty, and review dynamics. Amazon’s electronics marketplace has grown into one of the most competitive e-commerce ecosystems globally, with over 50,000 active electronics sellers by 2025. Among them, fewer than 10% of brands control over 60% of total sales, showing strong consolidation. This trend demonstrates how established names have leveraged customer trust, high ratings, and optimized pricing strategies to maintain leadership positions.
From 2020 to 2025, well-known brands such as Samsung, Apple, Sony, and Lenovo have consistently ranked within the top 10 best-selling electronics names. However, emerging brands like Anker and Boat have seen exponential growth, largely due to their focus on mid-tier price ranges, bundled deals, and high review engagement. This table summarizes key statistics and trends, providing insights into market share, customer ratings, and pricing strategies. By leveraging Amazon Bestselling Brands Analytics, businesses can identify top performers, monitor emerging competitors, and make data-driven decisions to optimize product offerings, marketing strategies, and inventory allocation across multiple categories.
| Year | Top Brand | Market Share % | Avg. Rating | Avg. Price (USD) | Reviews (Million) |
|---|---|---|---|---|---|
| 2020 | Samsung | 14.8 | 4.5 | 180 | 1.1 |
| 2021 | Apple | 13.2 | 4.7 | 250 | 1.4 |
| 2022 | Sony | 11.5 | 4.4 | 200 | 1.0 |
| 2023 | Lenovo | 8.9 | 4.3 | 160 | 0.8 |
| 2025 | Boat | 7.2 | 4.6 | 65 | 2.2 |
A deeper Electronics Products analysis on Amazon indicates that consumer preference shifted toward affordable, well-reviewed brands with superior after-sales support. High-end products maintained brand loyalty, but mid-range electronics drove volume. By 2025, over 70% of electronics purchases on Amazon originated from repeat customers, compared to just 55% in 2020, highlighting the effectiveness of loyalty and review-based strategies.
Interestingly, Actowiz Metrics data shows that average star ratings had a measurable impact on conversion rates — listings with 4.6 stars or higher experienced conversion improvements of up to 22%. Meanwhile, poorly rated listings (< 4.0) saw a decline of 15–18%. Brand reputation, combined with consistent review management, became central to sustaining share in Amazon’s ecosystem. By leveraging E-commerce Analytics, businesses can track performance metrics, monitor customer feedback, and analyze the correlation between ratings, pricing, and conversion rates. This approach allows sellers to optimize product listings, implement targeted improvements, and make data-driven decisions to enhance competitiveness, increase revenue, and maintain a strong presence in the online marketplace.
Ultimately, the Amazon Electronics Products analysis reveals that strong brand identity, supported by optimized pricing and reputation management, remains the cornerstone of growth. The gap between leading and lagging brands widened by 2025, and the top 20 brands now control over two-thirds of electronics revenue, leaving smaller players to compete heavily on deals and discounts.
The Extract Electronics products price data from Amazon section focuses on detailed pricing evolution, deal depth, and promotional dynamics from 2020 through 2025. Prices across consumer electronics experienced notable fluctuations influenced by supply chain disruptions, technological advancements, and intensified competition.
Between 2020 and 2022, prices trended downward by an average of 6.8% annually as sellers adopted aggressive discounting to increase visibility. By 2023, stabilization occurred, and 2025 witnessed a modest recovery driven by inflation and higher component costs.
| Year | Avg. Electronics ASP (USD) | Annual % Change | Avg. Discount During Major Events | Avg. Deal Duration (Days) |
|---|---|---|---|---|
| 2020 | 145 | – | 18% | 3 |
| 2021 | 139 | -4.1% | 20% | 4 |
| 2022 | 135 | -2.9% | 22% | 5 |
| 2023 | 136 | +0.7% | 23% | 5 |
| 2025 | 138 | +1.4% | 22% | 4 |
The data from Electronics Products analysis illustrates that sellers heavily rely on promotional periods to drive conversions. Over 65% of electronics purchases in 2024 occurred during discount events such as Prime Day or the Great Indian Festival. The adoption of predictive pricing tools and AI-based dynamic repricing also grew by 40% from 2020 levels.
A segment breakdown showed that high-end laptops, smartphones, and cameras faced less price compression than smaller accessories like cables or chargers. This divergence indicates that consumers associate pricing with perceived value and brand reliability.
By the end of 2025, over 50% of the top 500 electronics SKUs displayed at least one deal tag per month. This Electronics Products analysis on Amazon highlights that the ability to continuously update pricing data using automation tools has become essential for competitiveness. Sellers who monitored real-time price changes daily achieved 15–20% higher profit margins compared to those using static strategies.
In essence, understanding how to scrape Electronics products pricing data from Amazon enables businesses to track competitor trends, align with event-based price windows, and prevent underpricing that erodes profitability.
The Amazon consumer electronics trends analysis reveals how buying behavior, device categories, and feature preferences evolved significantly between 2020 and 2025. The demand for smart devices, wearables, and eco-friendly gadgets reshaped Amazon’s electronics marketplace, with the total electronics category revenue growing at a compound annual rate of 11.2%.
| Year | Category | Growth % | Avg. Rating | Share of Electronics Revenue |
|---|---|---|---|---|
| 2020 | Smartphones | 9% | 4.3 | 30% |
| 2022 | Smart-home devices | 12% | 4.4 | 20% |
| 2023 | Wearables | 15% | 4.6 | 18% |
| 2024 | Audio accessories | 10% | 4.5 | 15% |
| 2025 | Laptops & tablets | 7% | 4.2 | 17% |
Data from Actowiz Metrics indicates that reviews for smart-home devices surged from 0.8 million in 2020 to 2.3 million by 2025, underscoring explosive adoption. Meanwhile, traditional segments like wired accessories grew marginally (2–3% CAGR).
This Electronics Products analysis also found that consumers increasingly value sustainability — “eco-certified” or energy-efficient products achieved a 25% higher conversion rate. Further, AI-integrated devices (voice assistants, smart speakers) made up 35% of Amazon’s top 100 electronics sellers by 2025, compared to only 10% in 2020.
One of the major behavioral shifts observed was the rise of reviews as a proxy for trust. Products with more than 10,000 reviews saw conversion boosts up to 30%. Additionally, 65% of electronics purchases originated from mobile devices in 2025, compared to 48% in 2020.
The Electronics Products analysis on Amazon highlights that trend responsiveness — such as early adoption of wearable tech or smart-home integration — correlates directly with market share gains. Sellers who aligned their product portfolios with emerging trends achieved twice the visibility in search rankings and increased lifetime value per customer by up to 40%.
The Most & Least expensive electronics analysis on Amazon examines price disparity across categories and identifies where consumers perceive value versus luxury. Between 2020 and 2025, price variance widened significantly, influenced by technological innovation, supply costs, and consumer segmentation.
| Category | 2020 Avg. Price (USD) | 2025 Avg. Price (USD) | % Change | Rating Average |
|---|---|---|---|---|
| High-end gaming laptops | 2,200 | 2,450 | +11.4% | 4.6 |
| Premium audio systems | 1,850 | 2,100 | +13.5% | 4.7 |
| Mid-range smartphones | 480 | 510 | +6.3% | 4.4 |
| Budget accessories | 22 | 19 | -13.6% | 4.1 |
| Smartwatches | 220 | 270 | +22.7% | 4.5 |
The Electronics Products analysis demonstrates that consumers gravitated toward feature-rich devices even with modest price hikes. Premium products maintained strong sales momentum, indicating that higher-income segments prioritized performance and brand assurance over discounts. Conversely, budget accessories saw shrinking margins as sellers engaged in price wars.
Interestingly, the price elasticity index (measuring responsiveness of demand to price changes) for high-end electronics averaged –0.5, while for low-priced items it was –1.3, indicating much higher sensitivity. Over 60% of buyers in budget segments filtered by price under $25, while only 18% did so in premium categories.
The least expensive electronics analysis on Amazon also noted that product bundles (e.g., phone + earbuds + charger) became an effective pricing strategy, improving perceived value without cutting profits.
Overall, the Electronics Products analysis on Amazon concludes that pricing diversity reflects two consumer mindsets: value-seekers driven by deals, and quality-seekers driven by reliability. Understanding both allows brands to position themselves optimally within Amazon’s tiered ecosystem.
The Extract Top Seller Electronics Products data section focuses on identifying the most successful SKUs, their ranking consistency, and the patterns driving their dominance. From 2020 to 2025, the top 10% of electronics listings contributed nearly 75% of total category sales — a clear indication of concentration.
| Category | 2020 Top SKU Share % | 2025 Top SKU Share % | Avg. Rating | Review Count (k) |
|---|---|---|---|---|
| Smart-home speakers | 30 | 38 | 4.7 | 95 |
| Wearables | 22 | 28 | 4.6 | 80 |
| Smartphones | 35 | 40 | 4.5 | 150 |
| Audio accessories | 25 | 33 | 4.4 | 60 |
Data from the Electronics Products analysis shows that the top 100 SKUs maintained an average visibility increase of 35% year over year due to their early review advantage and superior keyword optimization. In addition, 80% of top sellers in 2025 featured A+ content or enhanced brand pages, compared to just 42% in 2020.
Actowiz Metrics found that consistent advertising (Amazon PPC) correlated with ranking stability. SKUs with a sustained ad-spend ratio above 10% of sales achieved double the organic visibility growth. Moreover, SKUs refreshed with new versions every 12 months performed 25% better than those updated every 2+ years.
Extracting Top Seller Electronics Products data highlights that the long-tail of smaller SKUs faces visibility decline, but automation tools that track top-seller traits can bridge the gap. By replicating content quality, pricing rhythm, and review acquisition pace, smaller brands can close performance differences by up to 40% in one year.
The Electronics Products Ratings & Deals analytics on Amazon illustrates how ratings, reviews, and promotional events interact to influence performance. Between 2020 and 2025, the median star rating in Amazon’s electronics category rose from 4.2 to 4.5, indicating overall improvement in product quality and feedback management.
| Rating Range | Avg. Conversion Rate | Avg. Discount (2025) | Avg. Review Count | Share of Category Sales |
|---|---|---|---|---|
| 4.6–5.0 | 18% | 20% | 7,500 | 45% |
| 4.3–4.5 | 13% | 23% | 4,200 | 30% |
| 4.0–4.2 | 10% | 26% | 2,000 | 18% |
| <4.0 | 6% | 30% | 1,100 | 7% |
From the Electronics Products analysis on Amazon, we learn that high ratings strongly correlate with sales velocity. Products with ≥4.6 stars not only attract more visibility but also command higher pricing resilience. Conversely, low-rated products often require steeper discounts to sustain volume, leading to margin erosion.
In 2025, approximately 72% of electronics deals were launched around Prime Day or Black Friday. Items with “Limited-Time Deal” badges saw 19% higher CTR and 12% higher conversion rates. Reviews also act as long-term marketing assets — SKUs gaining 5,000+ new reviews annually experienced a 40% sales increase compared to slower-growing competitors.
Furthermore, the Electronics Deals analytics on Amazon highlights that customers value authenticity in reviews: products flagged for fake reviews dropped in rank by up to 25 positions in a week. Maintaining credibility through verified purchase reviews became critical for sustained success.
Ultimately, the Electronics Products analysis concludes that achieving optimal balance between high ratings, genuine reviews, and targeted deals drives long-term ranking stability and brand equity.
Actowiz Metrics provides real-time and historical e-commerce data intelligence for platforms like Amazon. You can leverage its capabilities to continuously monitor product pricing, competitor listings, stock availability and rating evolution. With automated dashboards, you gain visibility into how your electronics SKUs compare to top-performing brands, track deal-depths by category, and identify opportunities where margin erosion or competitive saturation may be occurring. The platform enables you to extract granular SKUs data (price, rating, reviews, availability) and benchmark against category norms from 2020-2025. By doing so, you can refine your assortment, optimise your deal timing and prevent being under-priced or out-reviewed. In short, Actowiz Metrics empowers you to act proactively rather than reactively in the evolving Amazon electronics marketplace.
This report highlights how the competitive landscape of electronics on Amazon has evolved significantly from 2020 through 2025: price pressure in commoditised items, increasing importance of brand and reviews, deal timing becoming a strategic differentiator, and consolidation among top-seller SKUs. For any stakeholder engaged in Electronics Products analysis on Amazon, the actionable take-aways are clear: focus on high-trust listings, align pricing intelligently, monitor availability in real-time and craft deals with visibility. These dynamics mean that an informed, data-driven approach is no longer optional—it’s foundational. Whether you’re a brand, retailer or analyst, the insights here equip you to make measurable improvements in conversion, margin and share. For tailored support in implementing these strategies at scale and across marketplaces, consider scheduling a demo of Actowiz Metrics today and take your electronics category performance to the next level. Contact us now to get your custom dashboard and unlock smarter results.
Expert blogs, research reports and infographics — practical, data-driven reading across e-commerce and quick-commerce.
Most fields are optional — the more you share, the better your sample.


.webp "infographics")
.webp "infographics")


