Create your own


The U.S. supermarket industry has undergone rapid transformation between 2020 and 2026, driven by supply chain disruptions, private label expansion, inflationary pressures, and accelerated digital adoption. In this evolving environment, data has become the backbone of operational efficiency and competitive differentiation. Through USA Supermarket Chains Data Analytics, retailers gain comprehensive insights into pricing movements, product assortment shifts, consumer purchasing behavior, and inventory fluctuations across national and regional chains.
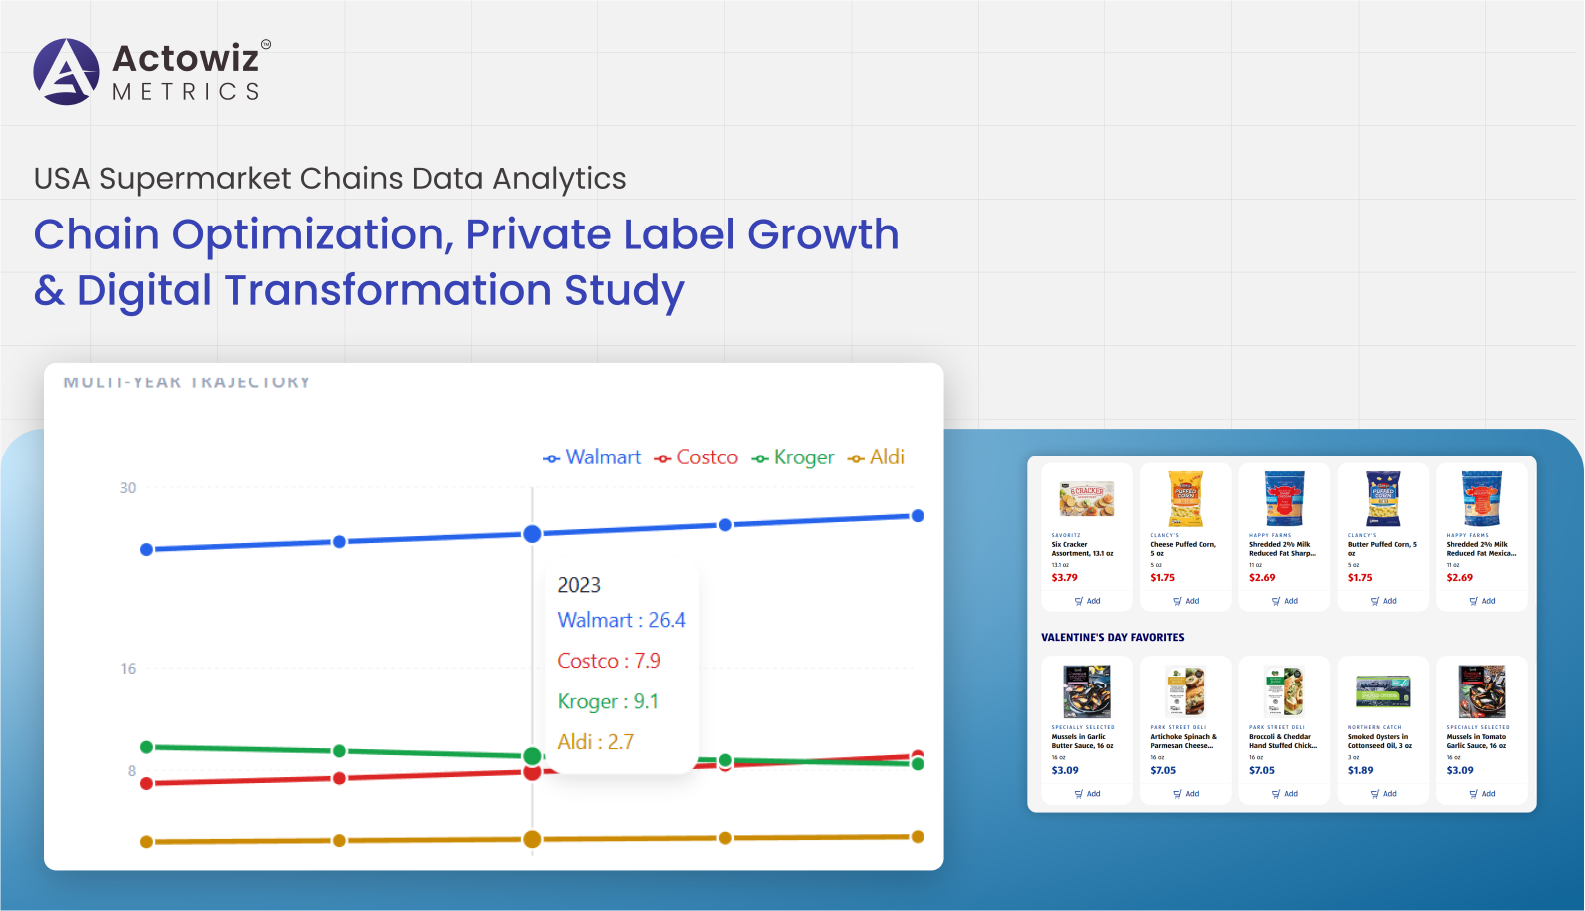
Additionally, strategic Price Benchmarking enables retailers and CPG brands to monitor competitor price changes, promotional cycles, and private label positioning to maintain profitability and market share.
From 2020 to 2026, U.S. grocery sales increased from approximately $682 billion to a projected $840+ billion, reflecting steady growth despite economic volatility.
| Year | Total Grocery Sales ($ Billion) | E-commerce Share % |
|---|---|---|
| 2020 | 682 | 10.2% |
| 2022 | 760 | 12.8% |
| 2024 | 815 | 14.5% |
| 2026 | 840+ | 16.9% |
This report explores key drivers shaping supermarket chains and outlines how data-driven intelligence improves chain optimization, private label growth, and digital transformation.
Supermarkets manage tens of thousands of SKUs across categories such as fresh produce, dairy, packaged foods, and household essentials. Through USA Supermarket Product & Pricing Data Extraction, retailers and suppliers can collect granular SKU-level insights including price changes, brand variations, pack sizes, and category depth.
Data transparency became especially critical during inflation peaks between 2021 and 2023, when grocery prices rose nearly 13% year-over-year at their peak. Structured data collection enables businesses to track pricing fluctuations and respond strategically to inflationary pressures.
| Year | Price Index (Base 2020=100) | Avg Annual Increase % |
|---|---|---|
| 2020 | 100 | — |
| 2021 | 106 | 6% |
| 2022 | 118 | 12% |
| 2023 | 123 | 4% |
| 2024 | 126 | 2.5% |
| 2026 | 131 | 2% |
With structured extraction of product and pricing data, retailers can detect abnormal price spikes, optimize pricing tiers, and ensure competitive consistency across regions.
Promotions and pack-size variations significantly influence purchasing behavior. By leveraging tools to Scrape Product Prices, Sizes & Promotions US Supermarkets, brands gain visibility into promotional depth, frequency, and discount elasticity.
Between 2020 and 2026, promotional intensity increased as retailers competed aggressively for price-sensitive consumers.
| Year | Avg Discount Depth % | % SKUs on Promotion |
|---|---|---|
| 2020 | 18% | 28% |
| 2022 | 22% | 34% |
| 2024 | 26% | 39% |
| 2026 | 29% | 44% |
Data-driven promotional monitoring helps retailers evaluate ROI on discounts and adjust pricing strategies accordingly. It also enables brands to assess value perception by comparing pack sizes, price-per-unit metrics, and bundling strategies.
As online grocery penetration grows, supermarkets must align digital and in-store experiences. Using advanced solutions to Scrape US Supermarket Price and Product Data, stakeholders can track online assortment availability, stock status, and digital pricing variations.
E-commerce grocery sales nearly doubled between 2020 and 2026, making digital shelf optimization essential.
| Year | Online Grocery Sales ($ Billion) | Share of Total Sales |
|---|---|---|
| 2020 | 69 | 10.2% |
| 2022 | 97 | 12.8% |
| 2024 | 118 | 14.5% |
| 2026 | 142 | 16.9% |
Retailers leveraging omnichannel data analytics observed improved stock accuracy and reduced cart abandonment rates. Data insights help supermarkets refine search rankings, enhance product descriptions, and synchronize pricing between online and physical stores.
Private label growth has been one of the most significant shifts in U.S. supermarkets. Retailers increasingly invest in store brands to improve margins and customer loyalty. Through systems that Extract USA Supermarket Chains Data, retailers can conduct detailed Brand Competition Analysis to compare private label performance against national brands.
Private label share increased from 17% in 2020 to a projected 23% in 2026.
| Year | Private Label Market Share % | Avg Margin Advantage vs National Brands |
|---|---|---|
| 2020 | 17% | 8% |
| 2022 | 19% | 10% |
| 2024 | 21% | 12% |
| 2026 | 23% | 14% |
Competitive benchmarking helps retailers refine assortment mix, optimize pricing gaps, and expand private label portfolios strategically.
Automation plays a critical role in modern supermarket analytics. By leveraging Web Scraping USA Supermarket Chains Data, organizations automate collection of product listings, price updates, inventory indicators, and competitor movements.
Digital transformation investments across U.S. supermarket chains increased significantly between 2020 and 2026.
| Year | Avg Tech Investment per Chain ($ Million) |
|---|---|
| 2020 | 45 |
| 2022 | 62 |
| 2024 | 78 |
| 2026 | 95 |
Automated data pipelines reduce manual errors, improve reporting speed, and enable predictive forecasting. Retailers adopting automated data systems experienced up to 15% operational efficiency improvement.
Inventory management remains one of the most complex challenges in the grocery sector. Leveraging Supermarket Price & Inventory Data Scraping, retailers gain insights into stock fluctuations, price adjustments, and demand variability. Combined with Product Data Tracking, chains can anticipate shortages and optimize replenishment cycles.
Supply chain disruptions between 2020 and 2023 highlighted the need for real-time inventory visibility.
| Year | Avg Stockout Rate % | Inventory Accuracy % |
|---|---|---|
| 2020 | 8% | 91% |
| 2022 | 11% | 88% |
| 2024 | 7% | 93% |
| 2026 | 5% | 96% |
Data-driven inventory optimization reduces lost sales, enhances customer satisfaction, and improves supply chain resilience.
Actowiz Metrics delivers comprehensive Grocery Analytics solutions tailored to U.S. retailers and CPG brands. Our expertise in large-scale marketplace intelligence empowers organizations to gain real-time competitive visibility and actionable insights.
With advanced USA Supermarket Chains Data Analytics, Actowiz provides:
Our scalable analytics frameworks help retailers navigate competitive pressures while improving profitability and operational efficiency.
The U.S. supermarket landscape between 2020 and 2026 reflects significant transformation driven by inflation, digital adoption, private label growth, and evolving consumer expectations. Leveraging Digital Shelf Analytics empowers retailers to monitor pricing dynamics, promotional intensity, product visibility, and competitor positioning in real time.
By implementing advanced USA Supermarket Chains Data Analytics, supermarket chains can enhance pricing accuracy, optimize inventory planning, strengthen private label portfolios, and accelerate digital transformation initiatives.
Partner with Actowiz Metrics today to unlock data-driven supermarket intelligence and gain a competitive edge in the evolving U.S. grocery market.

Whatever your project size is, we will handle it well with all the standards fulfilled! We are here to give 100% satisfaction.
Any analytics feature you need — we provide it
24/7 global support
Real-time analytics dashboard
Full data transparency at every stage
Customized solutions to achieve your data analysis goals