Create your own


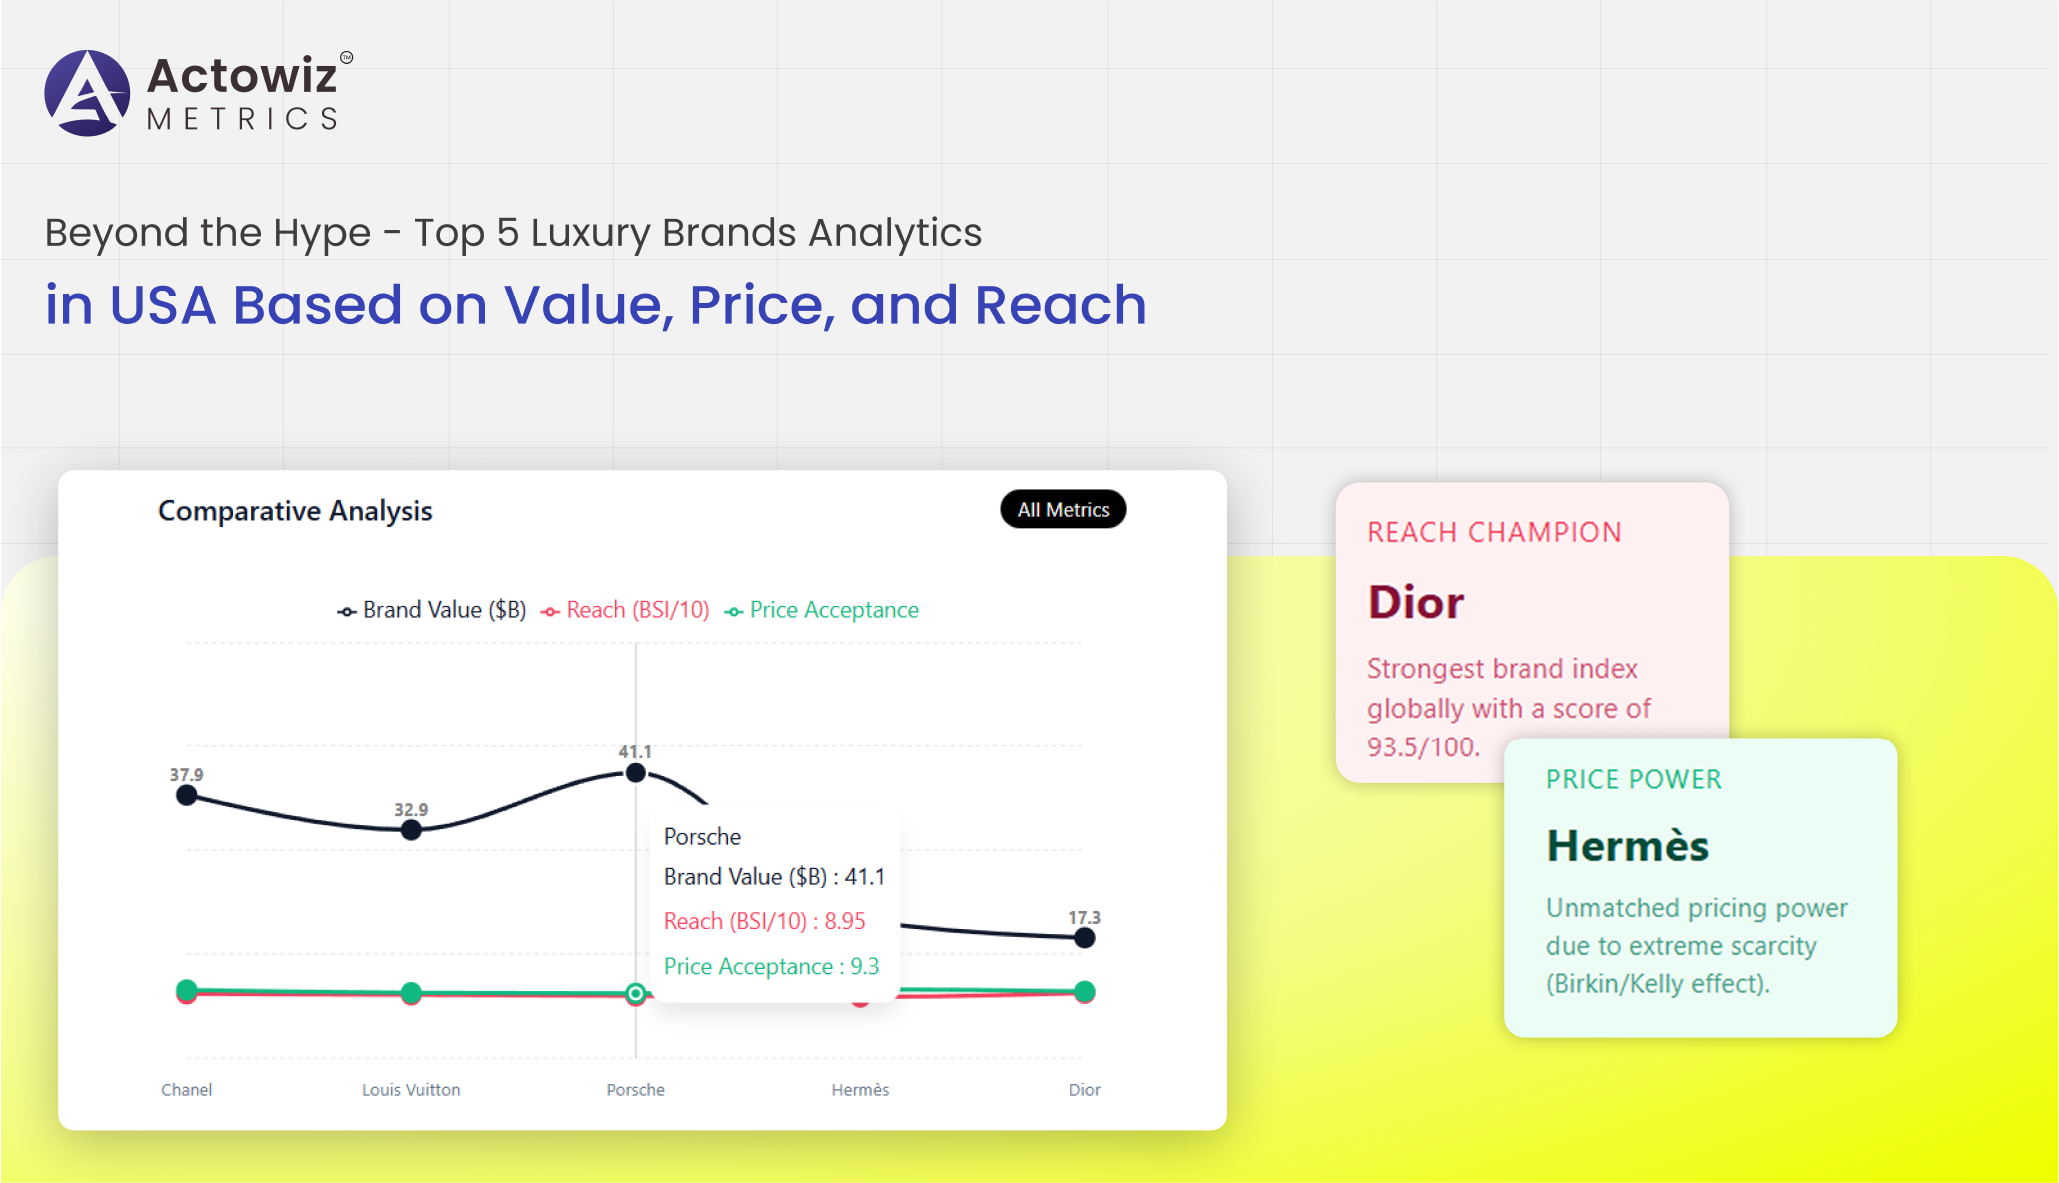
The U.S. luxury market has evolved rapidly over the past decade, driven by digital acceleration, premiumization, and omnichannel expansion. While brand heritage continues to influence consumer loyalty, modern buyers increasingly evaluate luxury brands based on transparent pricing, perceived value, and digital accessibility. In this research report, Actowiz Metrics presents a data-backed evaluation of the Top 5 Luxury Brands Analytics in USA, examining how value, pricing strategy, and market reach define competitive leadership.
Through comprehensive Brand Competition Analysis, we assessed price positioning, digital footprint, marketplace presence, promotional intensity, and product assortment growth from 2020 to 2026. Our study covers Louis Vuitton, Chanel, Gucci, Prada, and Rolex across online retail channels and brand-owned e-commerce platforms.
By leveraging advanced data extraction, analytics modeling, and retail intelligence tools, Actowiz Metrics provides actionable insights for stakeholders aiming to understand pricing power, brand equity, and performance benchmarks in the U.S. luxury ecosystem.
The competitive landscape among leading U.S. luxury brands demonstrates consistent growth in brand valuation and average selling prices between 2020 and 2026. Using Top 5 US Luxury Brands Value & Pricing Data Scraping, Actowiz Metrics analyzed price points across handbags, apparel, watches, and accessories.
Luxury pricing increased steadily due to inflation adjustments, supply chain recalibration, and exclusivity strategies. Average product price growth ranged between 6–11% annually depending on category.
| Year | Avg. Handbag Price ($) | Avg. Watch Price ($) | Brand Value Index (Base 100 in 2020) |
|---|---|---|---|
| 2020 | 2,450 | 6,800 | 100 |
| 2021 | 2,600 | 7,050 | 108 |
| 2022 | 2,850 | 7,400 | 118 |
| 2023 | 3,050 | 7,850 | 130 |
| 2024 | 3,250 | 8,300 | 142 |
| 2025 | 3,480 | 8,750 | 155 |
| 2026 | 3,750 | 9,200 | 170 |
These findings reflect structured premiumization strategies rather than short-term price hikes. Brands optimized exclusivity while maintaining perceived value among high-income urban consumers.
Luxury brands maintain strict pricing governance across digital marketplaces. Through Extract Top 5 US Luxury Brands Pricing Data, Actowiz identified consistent enforcement of MAP Monitoring policies across third-party retailers.
Minimum Advertised Price (MAP) compliance improved significantly post-2022, particularly across handbags and watches. Unauthorized discounting declined due to tighter distribution control and marketplace scrutiny.
| Year | MAP Violation Rate (%) |
|---|---|
| 2020 | 14% |
| 2021 | 12% |
| 2022 | 9% |
| 2023 | 6% |
| 2024 | 5% |
| 2025 | 4% |
| 2026 | 3% |
Enhanced pricing surveillance enabled brands to protect margins and maintain prestige positioning. Controlled discounting strengthened long-term brand equity while limiting grey market erosion.
Through Scrape Top 5 US Luxury Brand Pricing Data, Actowiz analyzed SKU-level assortment expansion across online platforms. Between 2020 and 2026, digital SKU counts increased by over 40%, reflecting e-commerce adoption.
Luxury brands expanded entry-level price points to capture younger affluent buyers, particularly through accessories and small leather goods.
| Year | Avg. SKU Count (Online) | Entry-Level Price ($) |
|---|---|---|
| 2020 | 1,200 | 450 |
| 2022 | 1,450 | 480 |
| 2024 | 1,650 | 520 |
| 2026 | 1,750 | 550 |
Despite assortment growth, core flagship items maintained high-margin pricing stability. Strategic entry pricing expanded reach without diluting exclusivity.
Using the US Luxury Brand Market Data Scraper, Actowiz examined digital reach, marketplace penetration, and Product Data Tracking across major e-commerce channels.
Brands significantly increased direct-to-consumer online sales, reducing dependency on third-party retailers. Social commerce and influencer collaborations amplified visibility, particularly among Gen Z consumers.
| Year | Direct E-commerce Share (%) | Marketplace Listings | Social Engagement Index |
|---|---|---|---|
| 2020 | 32% | 8,500 | 100 |
| 2022 | 41% | 9,800 | 135 |
| 2024 | 48% | 10,900 | 168 |
| 2026 | 55% | 12,300 | 210 |
Enhanced digital ecosystems improved accessibility while preserving brand control.
Our Top 5 US Luxury Brands Pricing & Value Trends Analysis revealed that despite higher prices, consumer willingness to pay remained strong due to craftsmanship, heritage storytelling, and resale value.
Brands increasingly relied on limited editions and scarcity tactics to justify annual price revisions. Secondary market pricing often exceeded retail benchmarks, reinforcing perceived value.
| Year | Avg. Price Growth (%) | Demand Index |
|---|---|---|
| 2020 | — | 100 |
| 2022 | 8% | 120 |
| 2024 | 7% | 145 |
| 2026 | 6% | 165 |
The data indicates demand resilience even amid macroeconomic fluctuations.
Luxury brands adopted advanced E-commerce Analytics to measure conversion rates, cart abandonment, and regional demand clusters.
Personalization engines, AI recommendations, and virtual try-on technologies boosted online conversion rates from 1.8% in 2020 to 3.4% in 2026. Data-driven merchandising enabled faster inventory turnover and optimized regional allocation.
| Year | Conversion Rate (%) | Avg. Order Value ($) |
|---|---|---|
| 2020 | 1.8 | 1,950 |
| 2022 | 2.5 | 2,200 |
| 2024 | 3.1 | 2,450 |
| 2026 | 3.4 | 2,700 |
The integration of digital analytics with supply chain intelligence positioned leading brands ahead of emerging competitors.
Actowiz Metrics empowers enterprises with deep retail intelligence powered by Digital Shelf Analytics. Our solutions provide granular SKU-level tracking, competitive pricing visibility, and MAP compliance insights.
We specialize in delivering actionable insights across the Top 5 Luxury Brands Analytics in USA, combining automated data scraping, structured dashboards, and predictive analytics models.
Our expertise includes:
With scalable data infrastructure and domain expertise, Actowiz Metrics enables brands and investors to navigate luxury competition with precision.
The U.S. luxury sector continues to expand beyond traditional retail boundaries. Structured pricing strategies, digital expansion, and data-backed brand positioning define market leadership among top luxury brands.
Through advanced scraping frameworks, analytics modeling, and Price Benchmarking, Actowiz Metrics provides unparalleled visibility into competitive value, pricing depth, and digital reach.
Ready to transform your luxury market intelligence strategy? Partner with Actowiz Metrics today to unlock data-driven competitive advantage!

Whatever your project size is, we will handle it well with all the standards fulfilled! We are here to give 100% satisfaction.
Any analytics feature you need — we provide it
24/7 global support
Real-time analytics dashboard
Full data transparency at every stage
Customized solutions to achieve your data analysis goals