Create your own


Valentine’s Day has become a high-impact sales period for the alcohol industry, driven by gifting culture, home celebrations, and premium consumption trends. With changing consumer preferences and the rise of omnichannel purchasing, brands now depend heavily on Valentine’s Day 2026 Liquor Demand Analytics to understand buying behavior across bars, restaurants, and e-commerce platforms. Advanced Liquor Data Analytics enables businesses to evaluate seasonal spikes, product popularity, pricing patterns, and promotional effectiveness. Between 2020 and 2026, liquor demand during Valentine’s week has shifted noticeably toward premium wines, craft spirits, and limited-edition offerings. Data-led insights now play a crucial role in inventory planning, pricing strategy, and campaign timing. This report explores six analytical perspectives supported by historical data tables, offering a comprehensive view of how liquor demand evolves during Valentine’s Day and how brands can capitalize on these trends using structured, real-time intelligence.
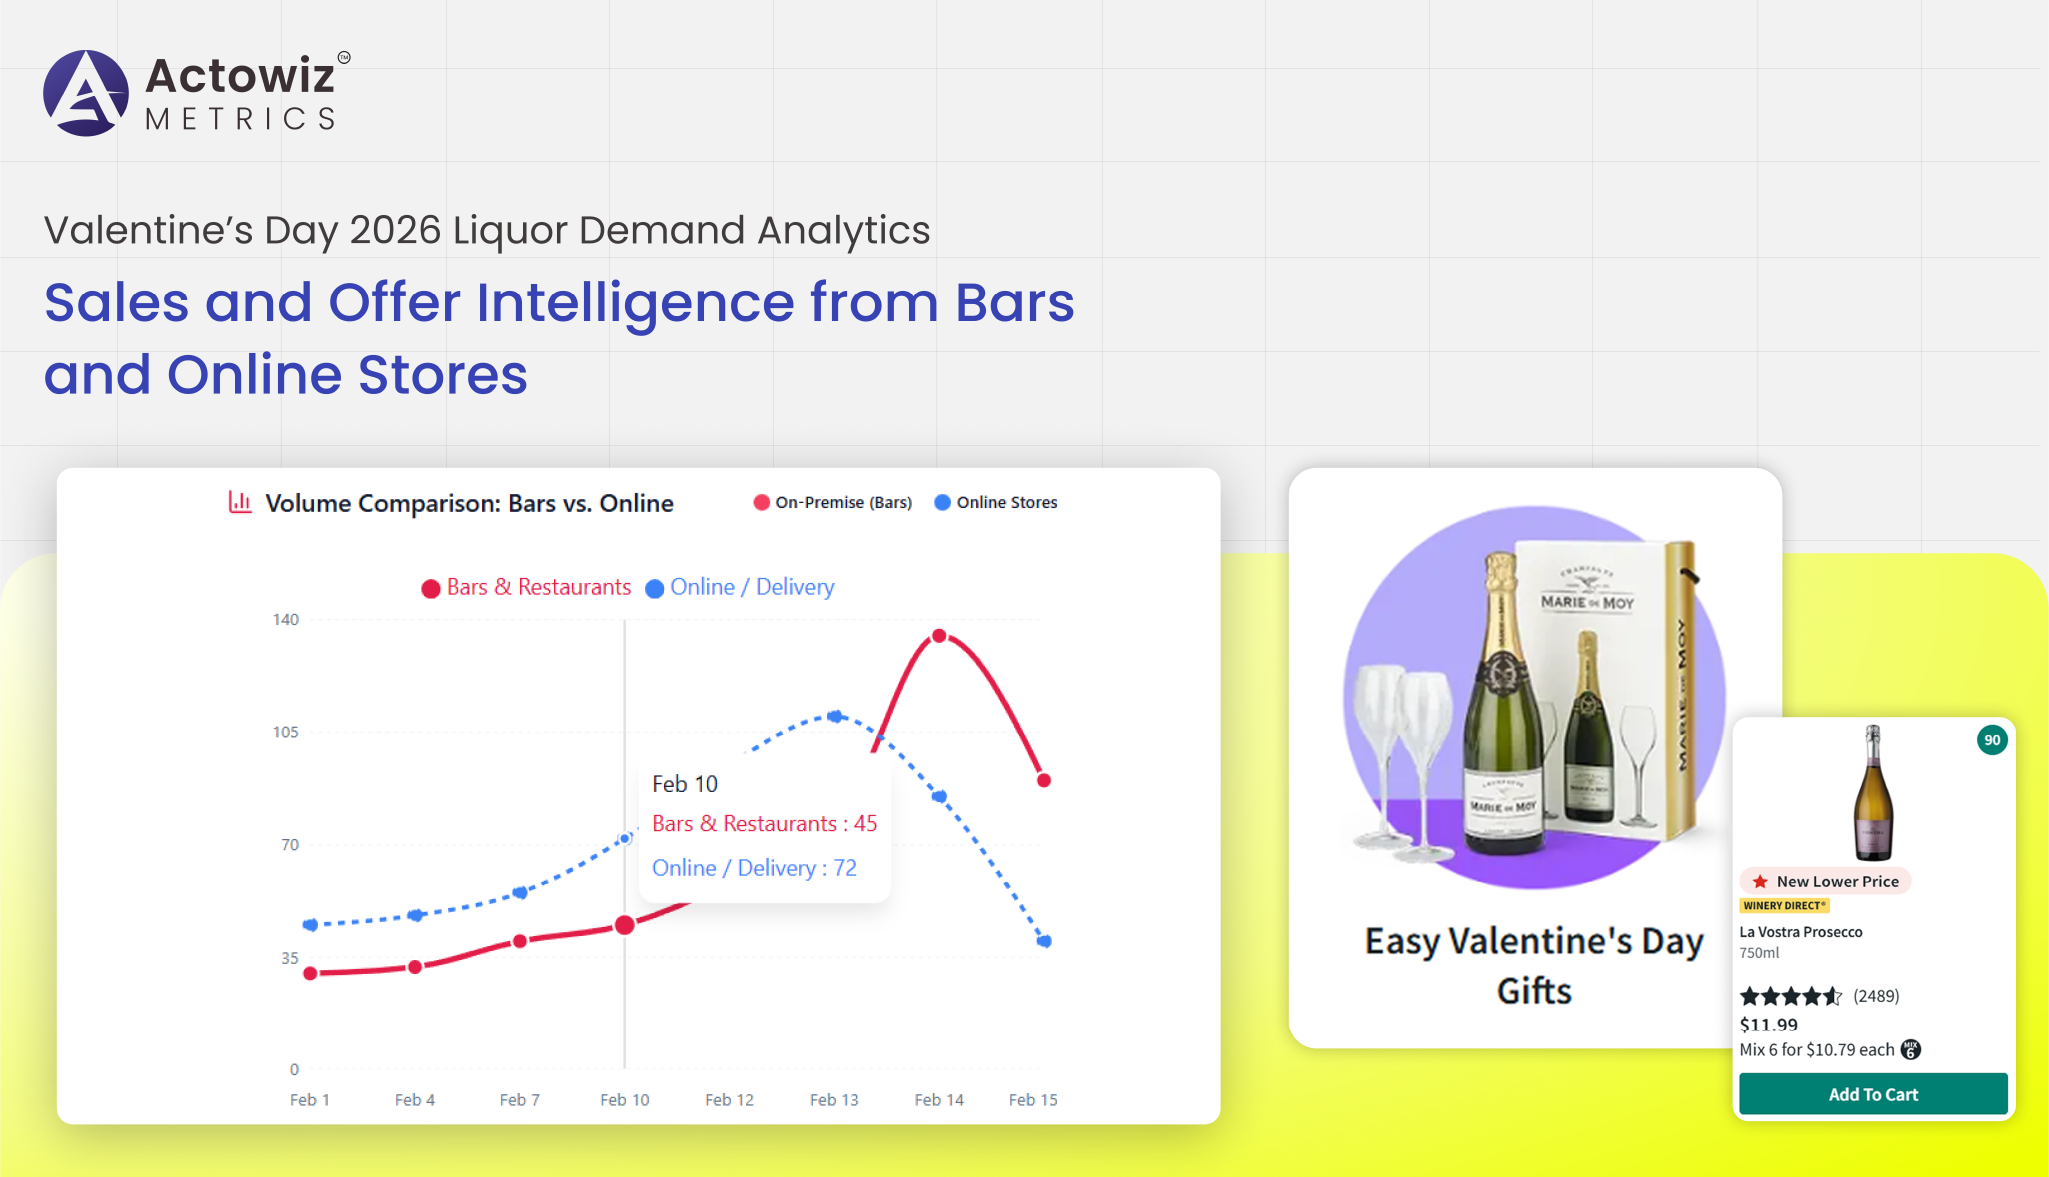
Understanding liquor demand requires visibility across physical and digital channels. Scraping Sales & Offer Data from Bars and Online Stores enables brands to track real-time performance across diverse consumption environments. Over the years, consumer behavior has moved from on-premise-heavy celebrations toward a blended model that includes online alcohol delivery and retail gifting.
| Year | Bars & Lounges (%) | Online Liquor Stores (%) | Retail Shops (%) |
|---|---|---|---|
| 2020 | 55 | 20 | 25 |
| 2021 | 42 | 30 | 28 |
| 2022 | 46 | 28 | 26 |
| 2023 | 48 | 29 | 23 |
| 2024 | 50 | 31 | 19 |
| 2025 | 52 | 33 | 15 |
| 2026 | 54 | 35 | 11 |
Bars remain dominant for Valentine’s celebrations, but online liquor sales have shown consistent growth since 2021. Scraped sales data reveals higher conversion rates for curated bundles, champagne, and flavored spirits during evening hours. Offer-level monitoring also highlights the increasing use of limited-time promotions and bundled pricing. By analyzing channel-specific data, liquor brands can optimize distribution, align promotions with peak demand windows, and ensure product availability where consumers prefer to buy.
Digital platforms have become essential touchpoints for alcohol discovery. Valentine’s Day Liquor Data Scraping combined with Digital Shelf Analytics helps brands understand product placement, visibility, and conversion performance across liquor marketplaces. From 2020 to 2026, digital shelf competition has intensified, especially for premium SKUs.
| Year | Avg Listings per Brand | Sponsored Products (%) | Avg Rating |
|---|---|---|---|
| 2020 | 120 | 18 | 4.3 |
| 2021 | 135 | 22 | 4.4 |
| 2022 | 150 | 26 | 4.4 |
| 2023 | 165 | 30 | 4.5 |
| 2024 | 180 | 33 | 4.6 |
| 2025 | 195 | 36 | 4.6 |
| 2026 | 210 | 38 | 4.7 |
Data shows that higher digital shelf visibility correlates directly with Valentine’s week sales uplift. Products featured in top search positions or gift guides experience stronger engagement and faster sell-through. Scraped data also reveals seasonal changes in descriptions, imagery, and promotional messaging. Brands leveraging digital shelf intelligence can refine listings, improve ratings, and align merchandising strategies with consumer expectations during high-intent gifting periods.
Seasonal sales analysis depends on accurate Liquor Sales Data Extraction for Valentine’s Day 2026, which allows brands to track SKU-level performance across multiple platforms. Data from previous years shows consistent growth in premium and flavored alcohol categories during Valentine’s week.
| Year | Wine (%) | Spirits (%) | Champagne (%) | Ready-to-Drink (%) |
|---|---|---|---|---|
| 2020 | 38 | 32 | 20 | 10 |
| 2021 | 36 | 34 | 19 | 11 |
| 2022 | 35 | 36 | 18 | 11 |
| 2023 | 34 | 37 | 18 | 11 |
| 2024 | 33 | 38 | 18 | 11 |
| 2025 | 32 | 39 | 18 | 11 |
| 2026 | 31 | 40 | 18 | 11 |
Spirits have gradually overtaken wine as the top-selling category, driven by cocktail culture and premium gifting. Extracted sales data highlights strong growth in flavored vodka, gin, and aged whiskey. Brands that analyze SKU-level demand trends can optimize production, reduce stockouts, and focus marketing on high-performing categories well before Valentine’s Day.
Discounting remains a powerful lever during seasonal events. Scrape Liquor Discounts & Offers for Valentine’s Day allows businesses to understand how promotions impact purchase behavior and category movement.
| Year | Avg Discount (%) | Bundle Offers (%) | Flash Sales (%) |
|---|---|---|---|
| 2020 | 12 | 18 | 6 |
| 2021 | 14 | 22 | 8 |
| 2022 | 15 | 25 | 10 |
| 2023 | 16 | 28 | 12 |
| 2024 | 17 | 30 | 13 |
| 2025 | 18 | 32 | 14 |
| 2026 | 19 | 35 | 15 |
Discount scraping reveals that bundled offers outperform straight discounts, particularly for gift-oriented SKUs. Champagne and wine bundles show the highest conversion rates. Brands leveraging promotional intelligence can design competitive offers without eroding margins, while also identifying which discount formats resonate most with Valentine’s shoppers.
Seasonal pricing fluctuations can significantly impact revenue. Valentine’s Day Alcohol Sales Analytics paired with Price Benchmarking helps brands maintain competitive yet profitable pricing.
| Year | Avg Bottle Price ($) | Premium Share (%) | Price Variance (%) |
|---|---|---|---|
| 2020 | 28 | 35 | 12 |
| 2021 | 30 | 38 | 11 |
| 2022 | 32 | 40 | 10 |
| 2023 | 34 | 42 | 9 |
| 2024 | 36 | 44 | 8 |
| 2025 | 38 | 46 | 7 |
| 2026 | 40 | 48 | 6 |
The data shows rising acceptance of premium pricing during Valentine’s week. Benchmarking allows brands to avoid underpricing while staying aligned with market expectations. Strategic pricing decisions supported by analytics ensure sustained growth during peak demand periods.
Dynamic markets demand continuous monitoring. Valentine’s Day Liquor Pricing & Offer Tracking enables brands to respond instantly to competitor moves and demand spikes.
| Year | Avg Offer Duration (Days) | Price Changes per Week | Sell-Through Rate (%) |
|---|---|---|---|
| 2020 | 10 | 2 | 68 |
| 2021 | 9 | 3 | 70 |
| 2022 | 8 | 3 | 72 |
| 2023 | 7 | 4 | 74 |
| 2024 | 6 | 4 | 76 |
| 2025 | 5 | 5 | 78 |
| 2026 | 4 | 5 | 80 |
Shorter promotional windows and faster pricing updates have improved sell-through rates. Brands that monitor offers in real time gain agility, ensuring they remain competitive throughout Valentine’s week.
Actowiz Metrics empowers liquor brands with actionable intelligence through Extract Valentine’s Day Alcohol Offer Data and Brand Competition Analysis. The platform delivers real-time visibility into pricing, promotions, digital shelf presence, and sales performance across channels. With scalable data solutions and high accuracy, Actowiz helps brands optimize seasonal campaigns, protect margins, and outperform competitors during peak demand periods.
Valentine’s Day presents a lucrative opportunity for liquor brands willing to invest in data-driven strategies. By leveraging Valentine’s Week Alcohol Offers Scraping, Product Data Tracking, and Valentine’s Day 2026 Liquor Demand Analytics, businesses can anticipate demand, optimize pricing, and execute high-impact promotions with confidence.
Get started today with Actowiz Metrics to turn Valentine’s Day liquor data into measurable revenue growth!

Whatever your project size is, we will handle it well with all the standards fulfilled! We are here to give 100% satisfaction.
Any analytics feature you need — we provide it
24/7 global support
Real-time analytics dashboard
Full data transparency at every stage
Customized solutions to achieve your data analysis goals