Create your own


The travel accommodation market in Germany has evolved rapidly over the past five years, fueled by shifting traveler habits, the rise of short-term rentals, and growing competition among Online Travel Agencies (OTAs). Understanding Booking.com vs Airbnb Travel Analytics is now critical for Germany hoteliers, property managers, investors, and tourism strategists who need to navigate this dynamic space.
Germany’s tourism industry ranks among Europe’s strongest, with over 450 million overnight stays in 2023 alone (DESTATIS). Travelers’ preferences are split between traditional hotels and increasingly popular vacation rentals — making the Booking.com vs Airbnb Travel Analytics debate essential for market forecasting.
The insights gained through Germany travel data analytics, Germany Travel Trends Scraping, and modern Predictive analytics for OTAs reveal how platforms like Airbnb and Booking.com differ in demand patterns, pricing behavior, seasonal surges, and promotional strategies.
This Actowiz Metrics Research Report unpacks the story behind Booking.com vs Airbnb Travel Analytics of Germany from 2020–2025. It explores how German travelers choose between hotels and private rentals, analyzes city-level pricing shifts, and explains how scraping and analytics tools like Airbnb booking trends analysis and Extract Booking.com promotional data empower smarter decisions.
| Year | % Hotel Stays | % Short-Term Rentals |
|---|---|---|
| 2020 | 78% | 22% |
| 2021 | 75% | 25% |
| 2022 | 70% | 30% |
| 2023 | 68% | 32% |
| 2024 | 66% | 34% |
| 2025 (est.) | 65% | 35% |
Insight: Vacation rentals’ share of overnight stays in Germany is projected to reach 35% by 2025, according to Germany vacation rental data insights. This means hotel brands must adapt, offering apartment-style rooms or partnering with OTAs for extended-stay offerings.
With Germany Hotel booking trends and real-time analytics, operators adjust room types, amenities, and cancellation policies to stay relevant in a short-term rental world.
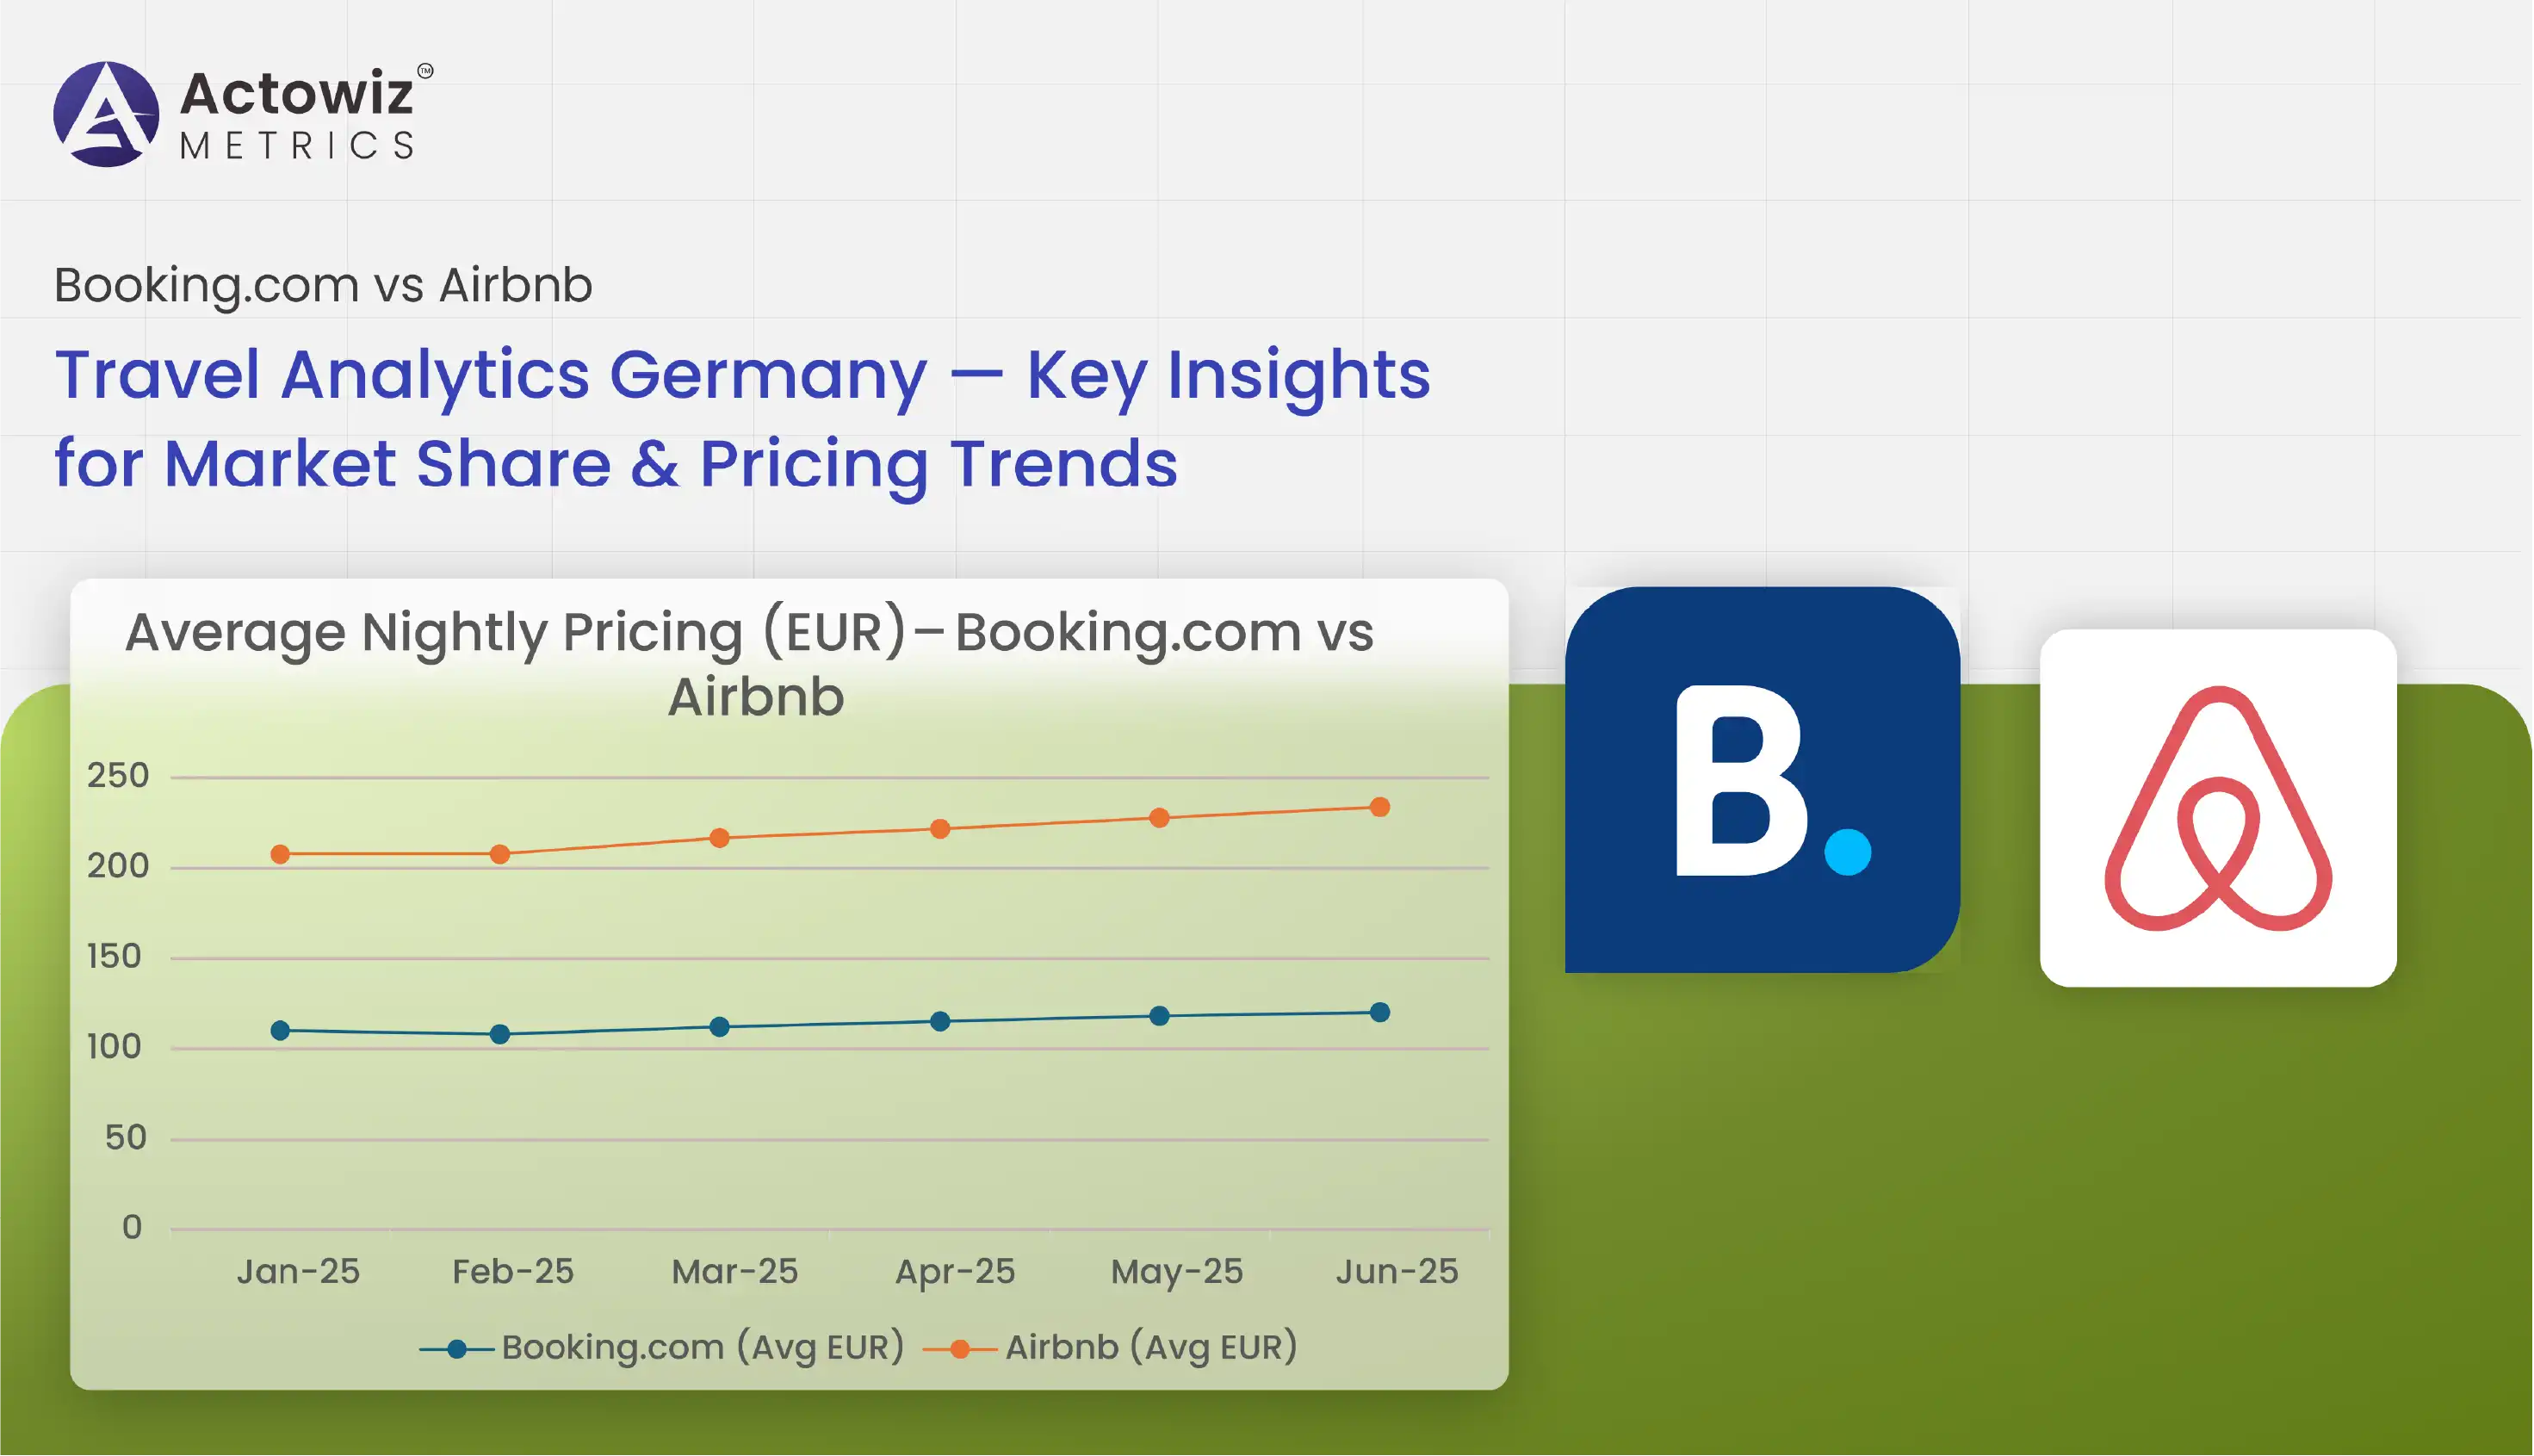
Airbnb vs Booking.com demand analysis shows that short-term rental rates are often more flexible — spiking during local events but dropping sharply off-season. Hotels listed on Booking.com follow steadier pricing bands, especially chains.
| Month | Avg. Airbnb Nightly Rate (€) | Avg. Hotel Nightly Rate (€) |
|---|---|---|
| Jan | €72 | €89 |
| Jun | €105 | €100 |
| Sep | €120 | €115 |
| Dec | €110 | €120 |
Insight: Using Airbnb booking trends analysis and Germany Travel Trends Scraping, hosts and hoteliers can see that Airbnb rates swing up to 60% between January and September. Hotels keep prices more stable but run aggressive promotions, which scraping tools like Extract Booking.com promotional data can track daily.
City-level trends show sharp variations in the Booking.com vs Airbnb Travel Analytics Germany story. Cities with major trade fairs (Frankfurt, Düsseldorf) see Booking.com hotel surges. Cultural hubs (Berlin, Hamburg) see Airbnb dominance.
| City | Airbnb Avg. Occupancy | Booking.com Avg. Occupancy |
|---|---|---|
| Berlin | 78% | 72% |
| Munich | 70% | 80% |
| Hamburg | 75% | 74% |
| Frankfurt | 62% | 85% |
Insight: According to Travel data insights Germany, major trade events spike hotel bookings by up to 40%, so predictive tools and Germany travel data analytics help adjust inventory and rates in advance.
Event calendars shape local supply and demand. Oktoberfest, Christmas Markets, and international conferences shift rates and occupancy dramatically.
| Event | Airbnb Price Spike | Booking.com Price Spike |
|---|---|---|
| Oktoberfest | +55% | +35% |
| Berlin Film Festival | +40% | +25% |
| Hanover Messe | +30% | +50% |
Insight: These surges highlight the value of Predictive analytics for OTAs — they let property owners prepare well in advance, adjust cancellation terms, and bundle services to attract travelers during competitive windows.
Modern OTAs and hosts rely on scrape Airbnb Germany rental data to pull competitor prices, occupancy trends, and listing details at scale.
| Year | Properties Monitored | Avg. Price Change |
|---|---|---|
| 2020 | 5,000 | 3% |
| 2021 | 8,500 | 4% |
| 2022 | 12,000 | 5% |
| 2023 | 15,000 | 6% |
| 2024 | 18,500 | 7% |
| 2025 (est.) | 20,000+ | 8% |
Insight: Hosts using Germany Travel Trends Scraping and daily updates optimize listing prices dynamically — boosting average yield by up to 15% compared to static pricing.
Travel brands, hosts, and revenue managers now invest in tools like Germany travel data analytics, Airbnb vs Booking.com demand analysis, and Predictive analytics for OTAs to keep up with changing consumer behavior.
| Metric | 2020 | 2025 (Est.) |
|---|---|---|
| OTA Market Share | 68% | 76% |
| Direct Booking Share | 32% | 24% |
| % of Hosts Using Dynamic Pricing | 45% | 70% |
Insight: Automated pricing, scraping, and Travel data insights Germany will become standard. This means that static rate cards will fade — and real-time data will power profits.
Actowiz Metrics empowers property managers, travel brands, and analysts to thrive with powerful Booking.com vs Airbnb Travel Analytics solutions. Our scraping engines deliver clean, structured data on occupancy, rates, promotions, reviews, and demand — all in real time.
We help you:
Our end-to-end solutions mean less manual research, faster insights, and bigger revenue for hosts, hotels, and travel strategists alike.
The fight for travelers in Germany’s booming accommodation market will only intensify. Winners won’t just guess — they’ll use real data to act faster and price smarter. Whether you’re a hotel, an independent host, or an investor, mastering Booking.com vs Airbnb Travel Analytics in Germany can transform your occupancy rates and profits.
Don’t leave your bookings to chance. Contact Actowiz Metrics today to unlock your custom travel data feeds, track your market, and stay two steps ahead in Germany’s competitive travel sector!

Whatever your project size is, we will handle it well with all the standards fulfilled! We are here to give 100% satisfaction.
Any analytics feature you need — we provide it
24/7 global support
Real-time analytics dashboard
Full data transparency at every stage
Customized solutions to achieve your data analysis goals