Create your own


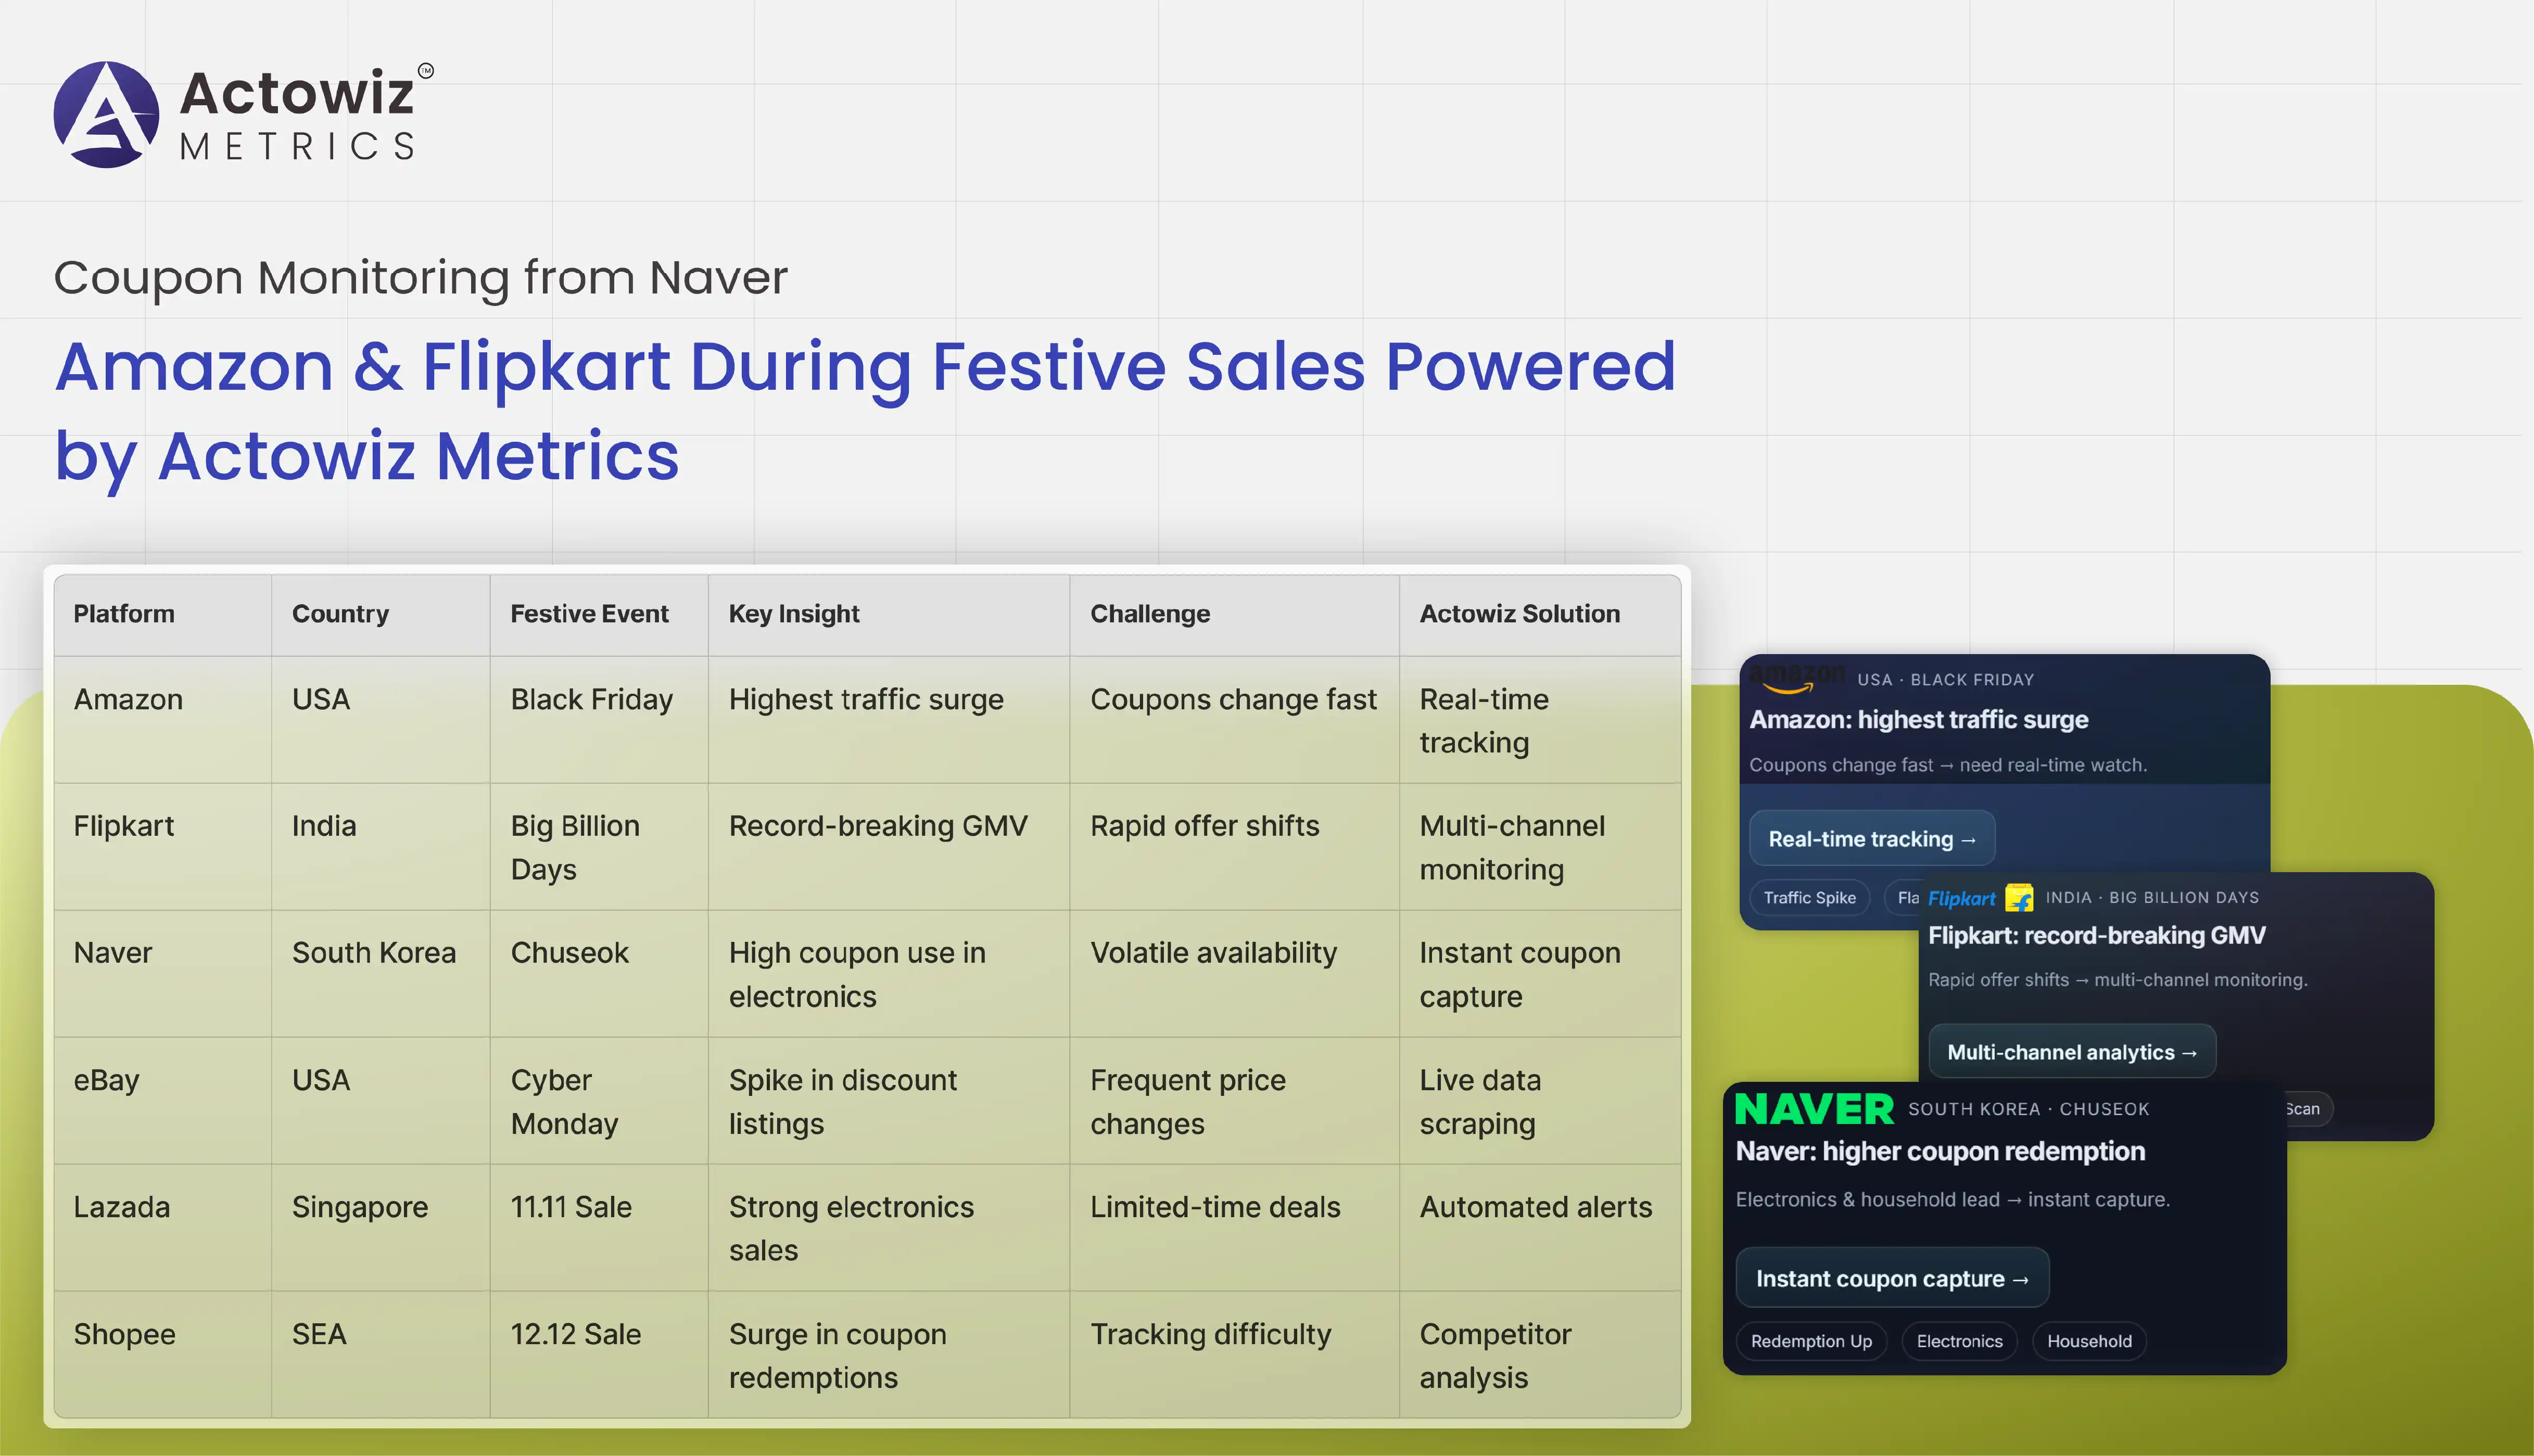
Every year, festive sales create an intense surge in online shopping activity. Events such as Black Friday and Cyber Monday in the US, Chuseok in South Korea, and The Big Billion Days in India attract millions of shoppers within a few short days.
The stakes are enormous. During these sales :
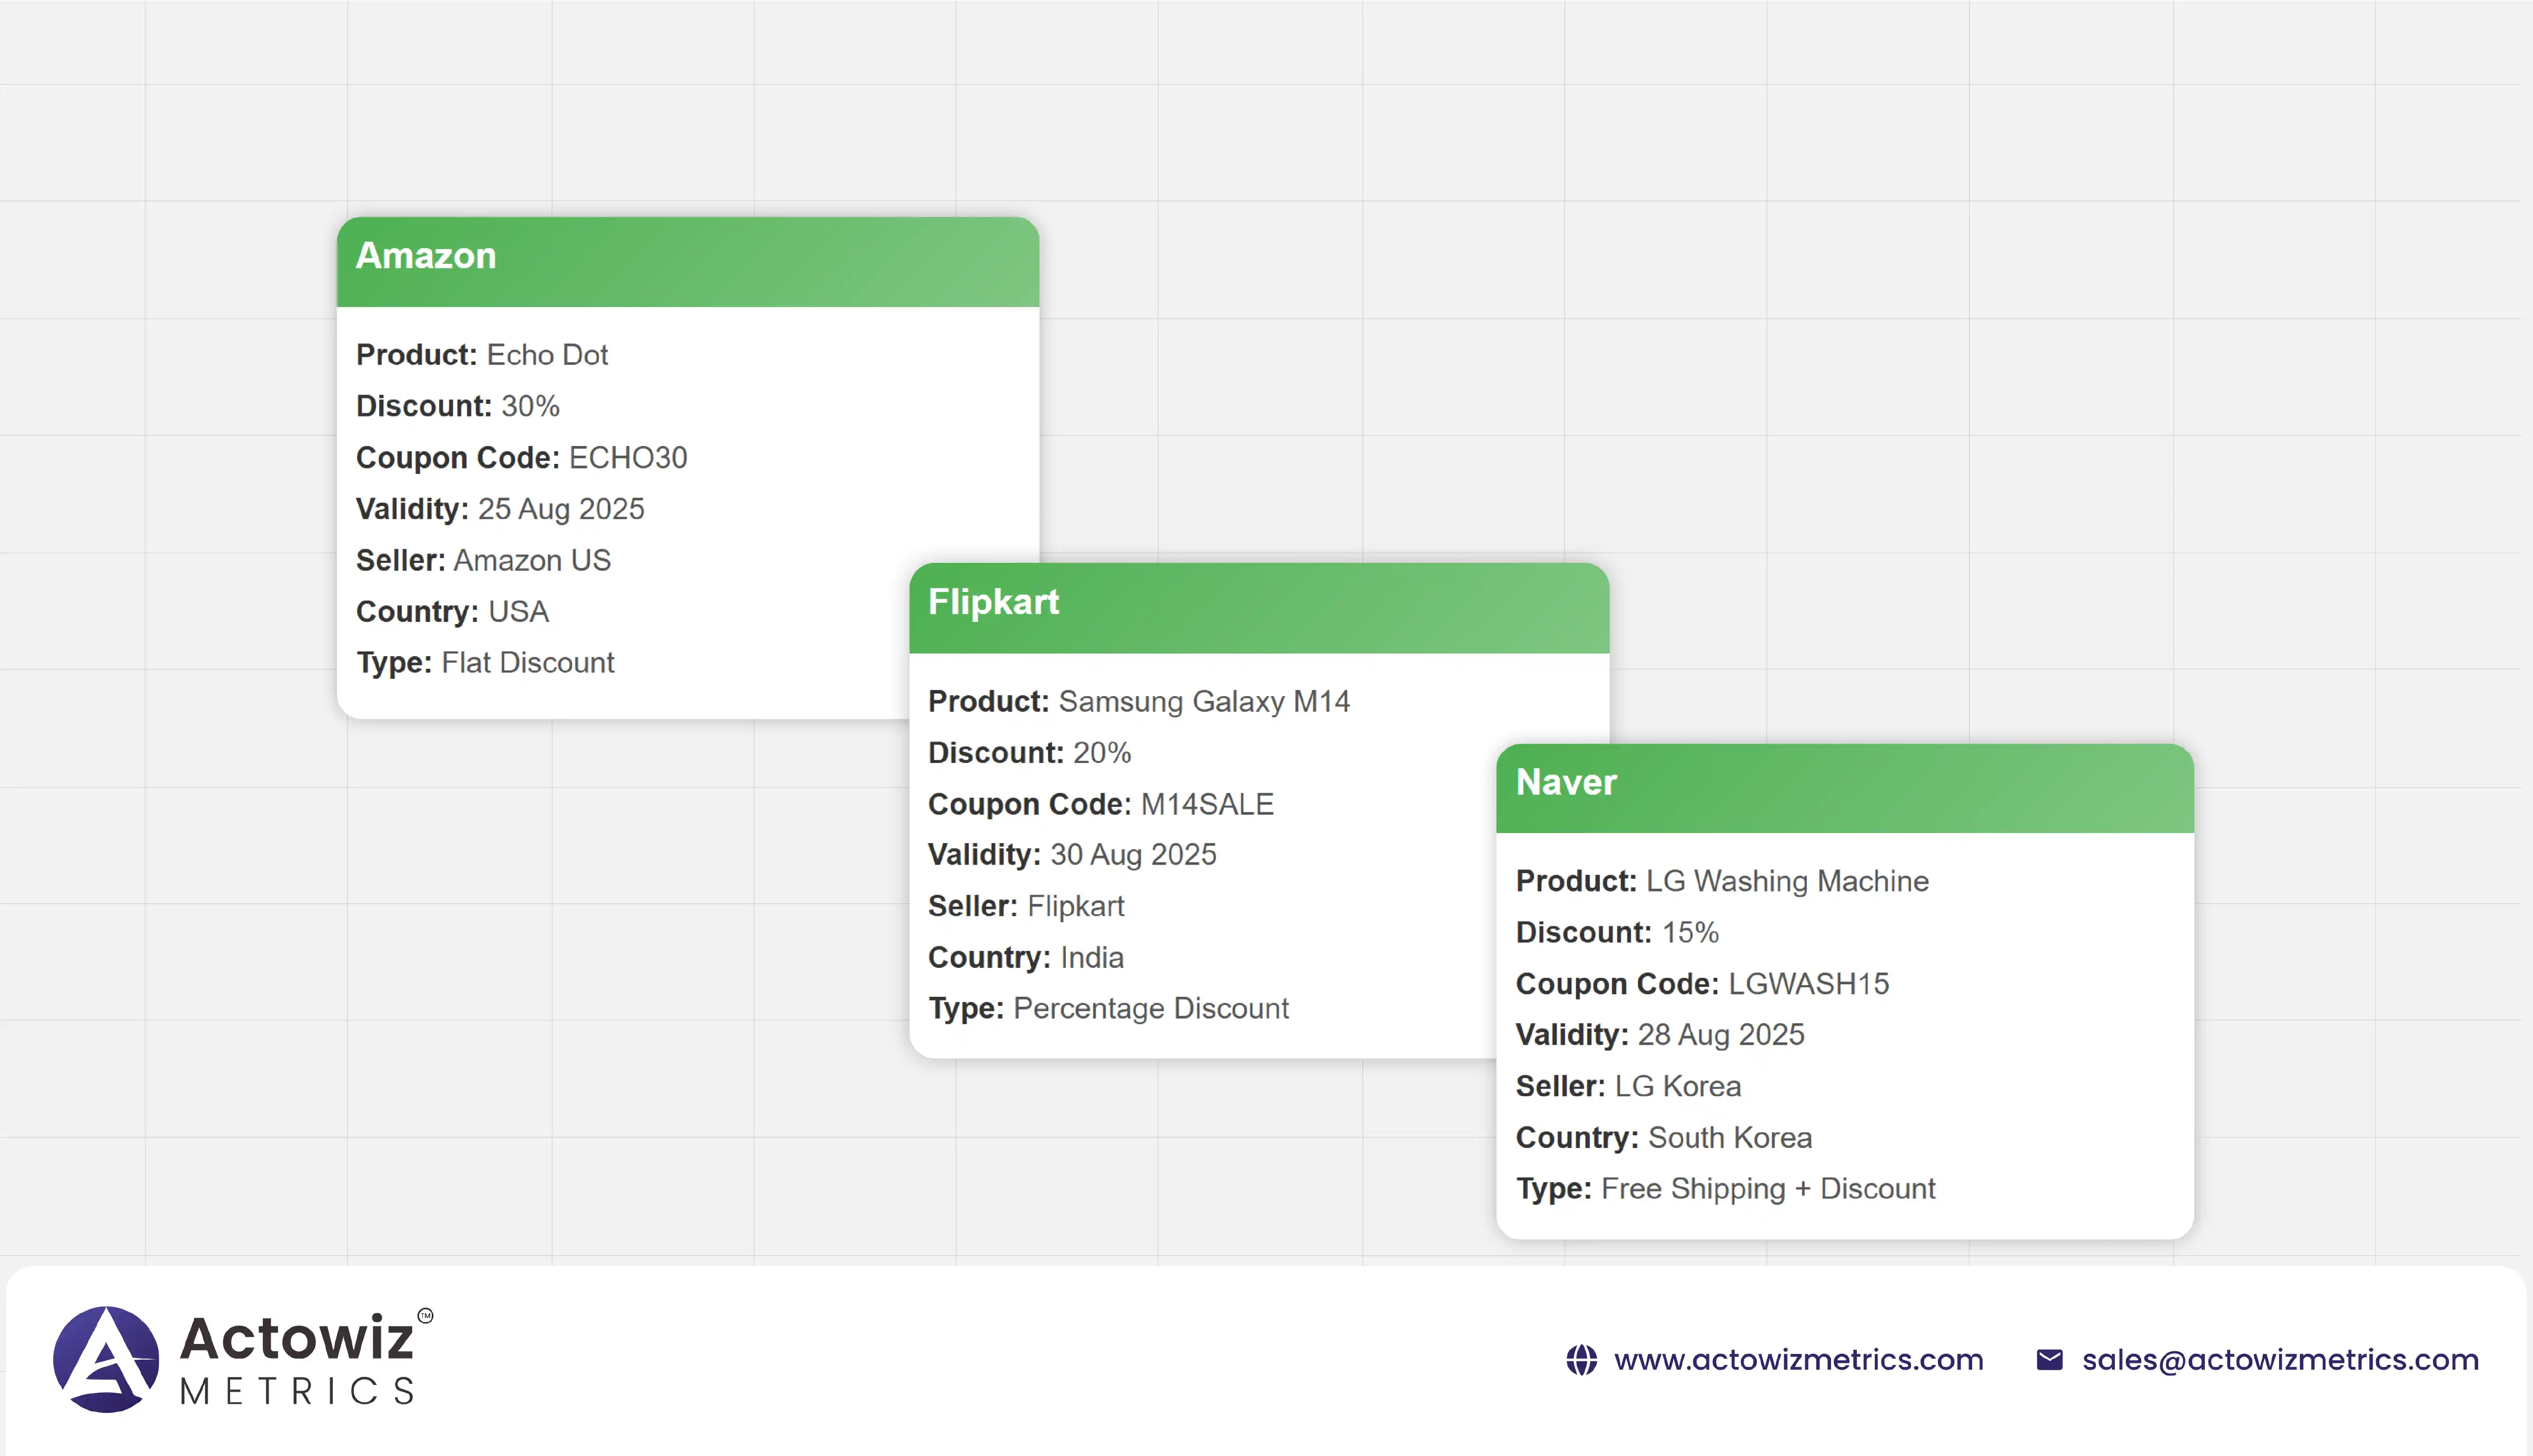
Limited-time festive sale coupons — whether they offer a flat discount, percentage reduction, or free shipping — have the power to sway customer decisions instantly.
But here’s the catch: festive coupons are volatile. They appear, change, and disappear in hours or even minutes. Brands that cannot track competitor coupons in real time risk missing out on critical market share.
This is where Actowiz Metrics stepped in with a robust festive sale coupon monitoring and multi-channel discount coupon analysis system.
The client, a global retail brand with operations in India, South Korea, and the USA, faced three key challenges:
1. Rapid Expiry of Coupons : Missing even a few hours of competitive coupon tracking could result in lost sales opportunities.
2. Platform Diversity :
3. No Centralized Monitoring : Coupon intelligence was scattered, requiring manual checks across platforms.
We mapped the key coupon data sources for each platform:
| Platform | Data Source Example | Festive Event |
|---|---|---|
| Naver | Shopping Event Pages, Homepage Banners | Chuseok Sale, Christmas Sale |
| Amazon | Prime Day Coupons Page, Black Friday Lightning Deals | Black Friday, Cyber Monday |
| Flipkart | Big Billion Days Coupon Center | Diwali Sale, Republic Day Sale |
Step 1 : Dynamic Content Rendering
Coupons often appear inside pop-ups or only after scrolling. We used Playwright for browser automation to fully render pages.
Step 2 : Geo-Targeted Scraping
We deployed IP proxies in South Korea, India, and the USA to ensure we captured geo-specific coupons.
Step 3 : Language Processing for Naver
Korean coupons were processed using NLP-based translation APIs so the output was standardized in English.
Step 4 : Normalization of Data
were structured into a standard schema for analysis :
Scraping jobs ran every 30 minutes during peak festive sale days to ensure no coupon was missed. This frequency was chosen based on historical coupon update patterns.
Extracted coupon data flowed into a MySQL database and was visualized in a custom Tableau dashboard, enabling :
| Platform | Product Name | Discount (%) | Coupon Code | Validity Period | Seller Name | Country | Coupon Type |
|---|---|---|---|---|---|---|---|
| Amazon US | Samsung Galaxy S23 | 20% | FEST20 | 24-Nov to 27-Nov | Amazon Retail | USA | % Discount |
| Naver KR | LG 55" OLED TV | 15% | NAVER15 | 1-Dec to 5-Dec | LG Official Store | Korea | % Discount |
| Flipkart IN | Nike Air Zoom Pegasus | 30% | FLIP30 | 10-Oct to 14-Oct | Nike India | India | % Discount |
| Amazon IN | Apple AirPods Pro 2 | 10% | APPLE10 | 22-Oct to 25-Oct | Appario Retail | India | % Discount |
| Naver KR | KitchenAid Stand Mixer | 25% | KITCHEN25 | 5-Dec to 10-Dec | Naver Global | Korea | Flat Amount |
| Flipkart IN | Mi Smart LED TV 43" | 18% | MI18 | 12-Oct to 15-Oct | Xiaomi Official | India | % Discount |
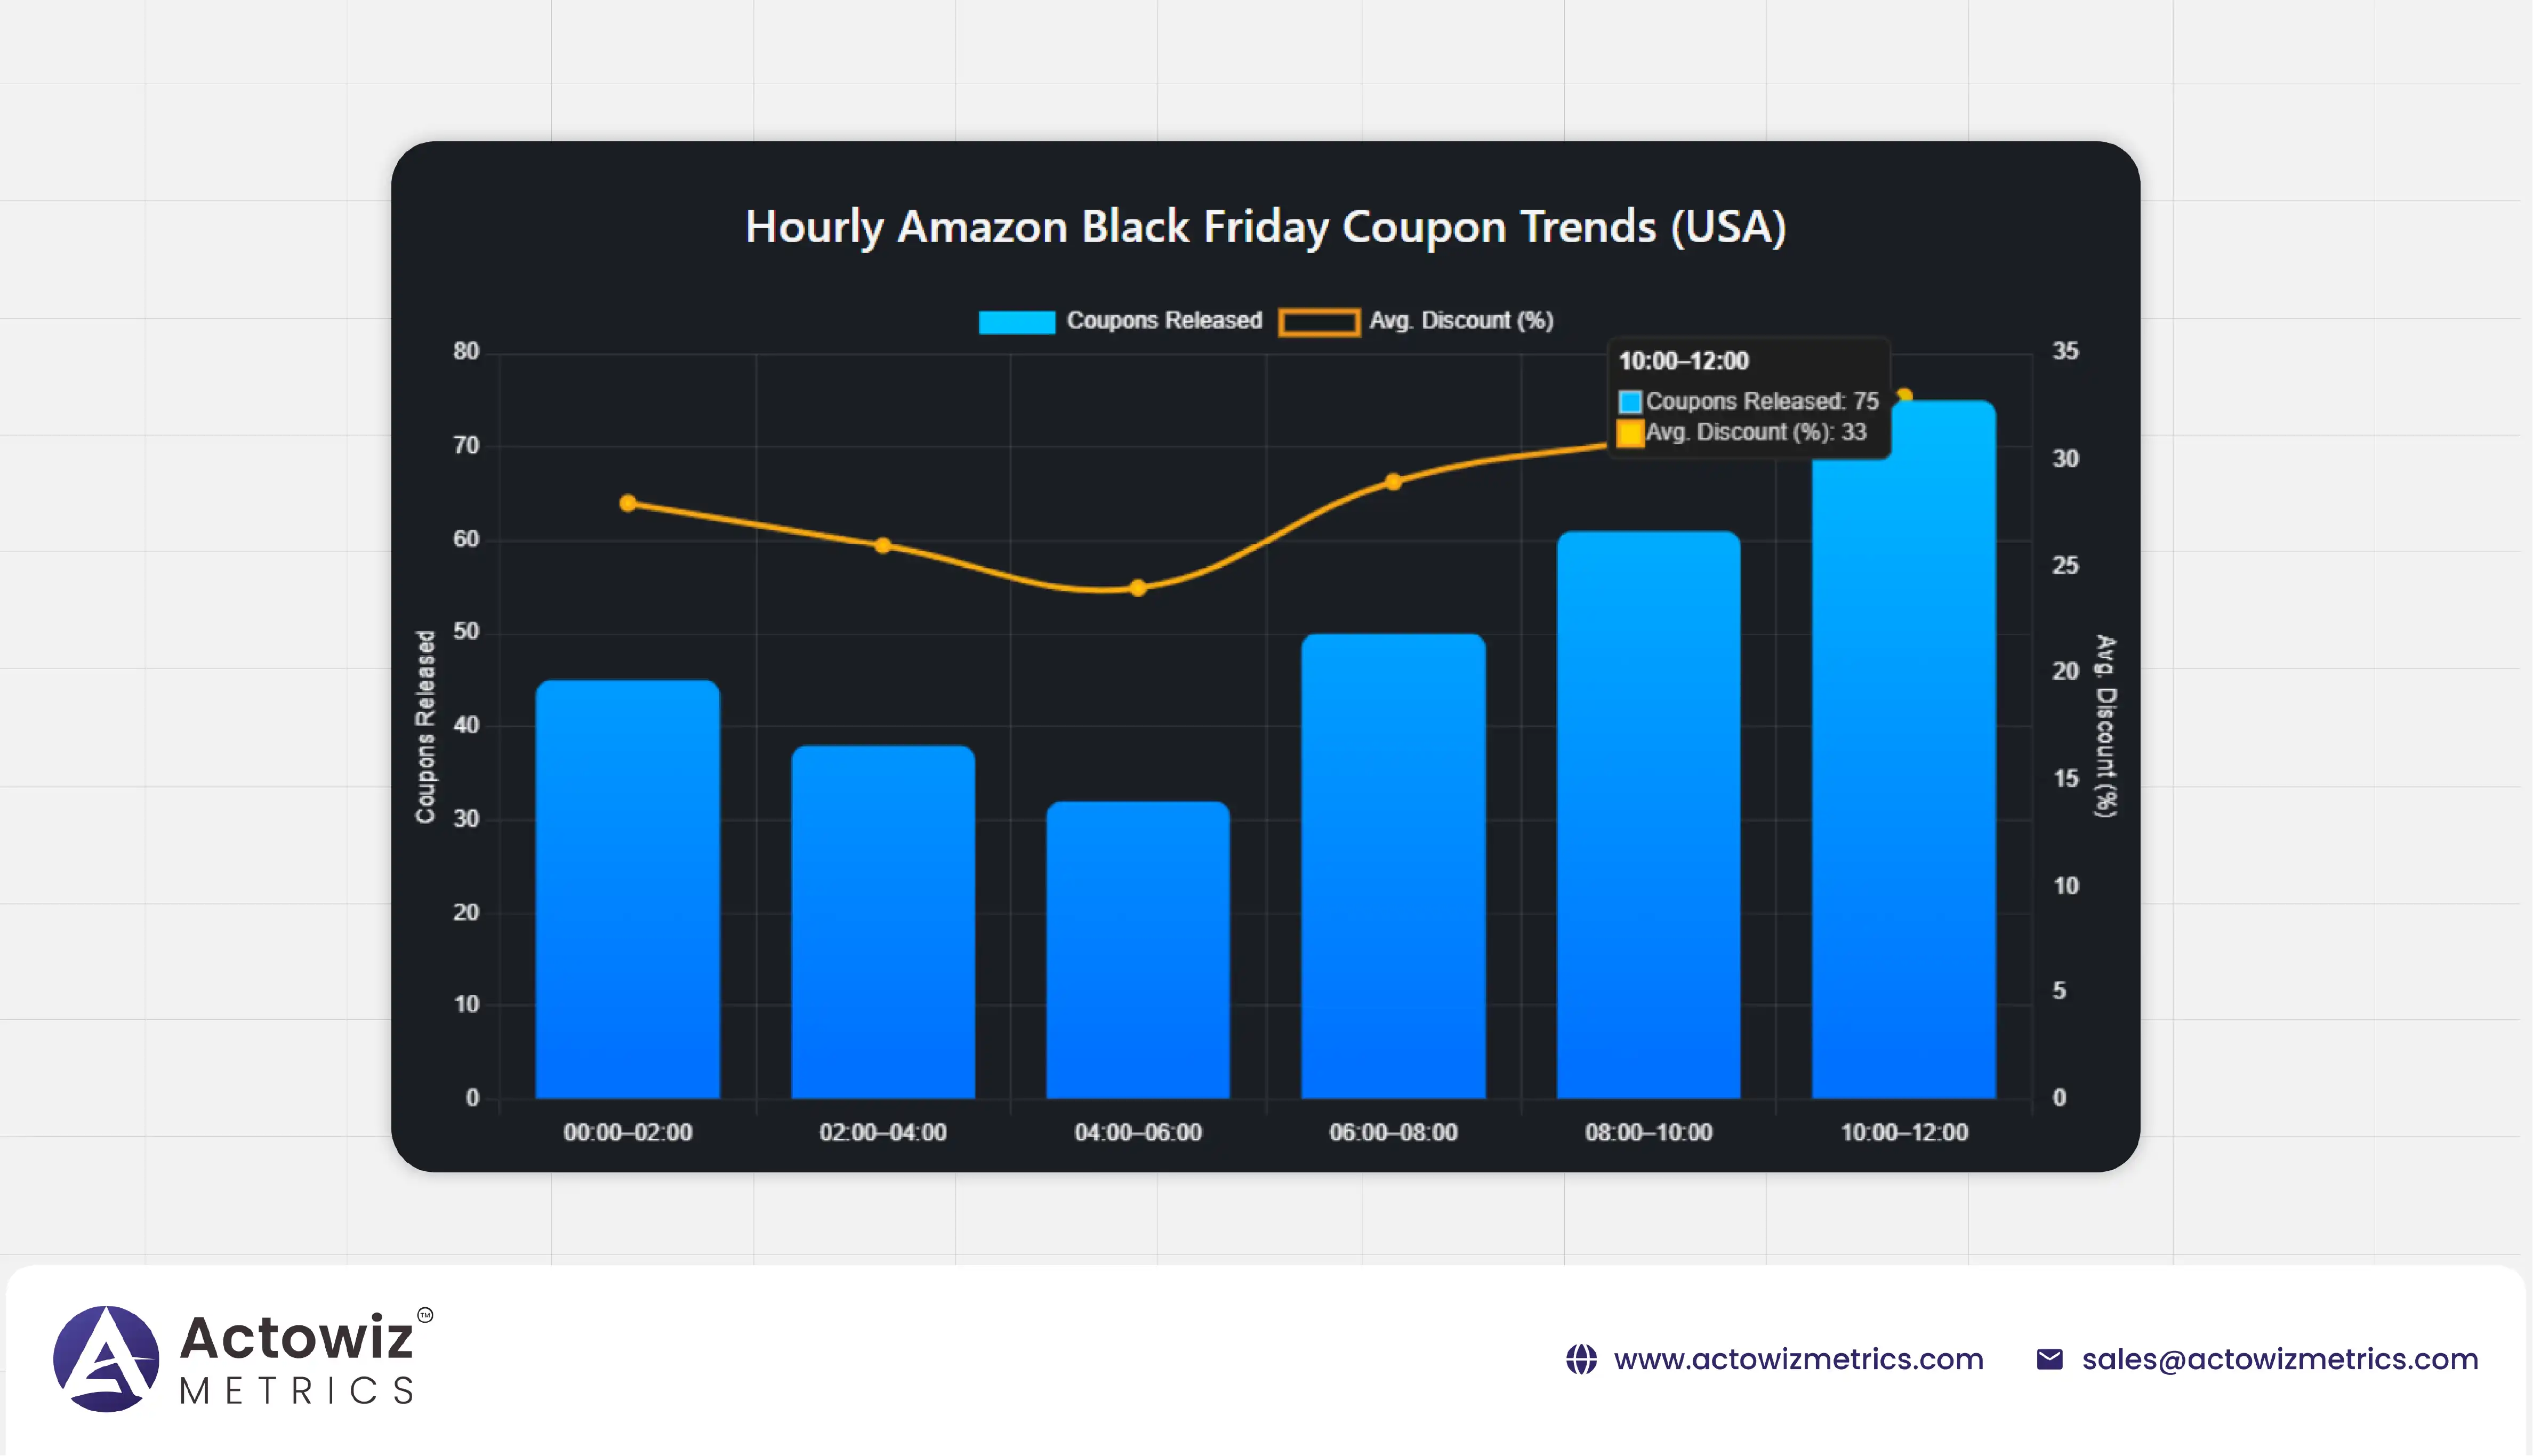
| Hour (EST) | Coupons Released | Avg. Discount (%) |
|---|---|---|
| 00:00–02:00 | 45 | 28% |
| 02:00–04:00 | 38 | 26% |
| 04:00–06:00 | 32 | 24% |
| 06:00–08:00 | 50 | 29% |
| 08:00–10:00 | 61 | 31% |
| 10:00–12:00 | 75 | 33% |
Insight: The 08:00–12:00 EST window had the highest volume and discount depth, making it the prime time for launching counter-offers.
-01.webp)
| Category | Coupons Released | Avg. Discount (%) |
|---|---|---|
| Smartphones | 85 | 32% |
| Fashion | 60 | 28% |
| Electronics | 55 | 25% |
| Home Appliances | 40 | 22% |
| Others | 30 | 20% |
Insight: Smartphones had the most competitive couponing, often with flash sale time limits under two hours.
| Coupon Type | Avg. Value (KRW) | Avg. % Equivalent |
|---|---|---|
| Flat Amount | ₩50,000 | ~18% |
| Percentage | ₩35,000 | ~15% |
Insight: Korean consumers respond better to flat-rate coupons rather than percentage-based ones.
| Challenge | Solution |
|---|---|
| JavaScript-heavy coupon pages | Playwright automation |
| Geo-restricted coupons | Country-specific proxies |
| Korean coupon parsing | NLP-based translation |
| Banner image coupons | OCR-based text extraction |
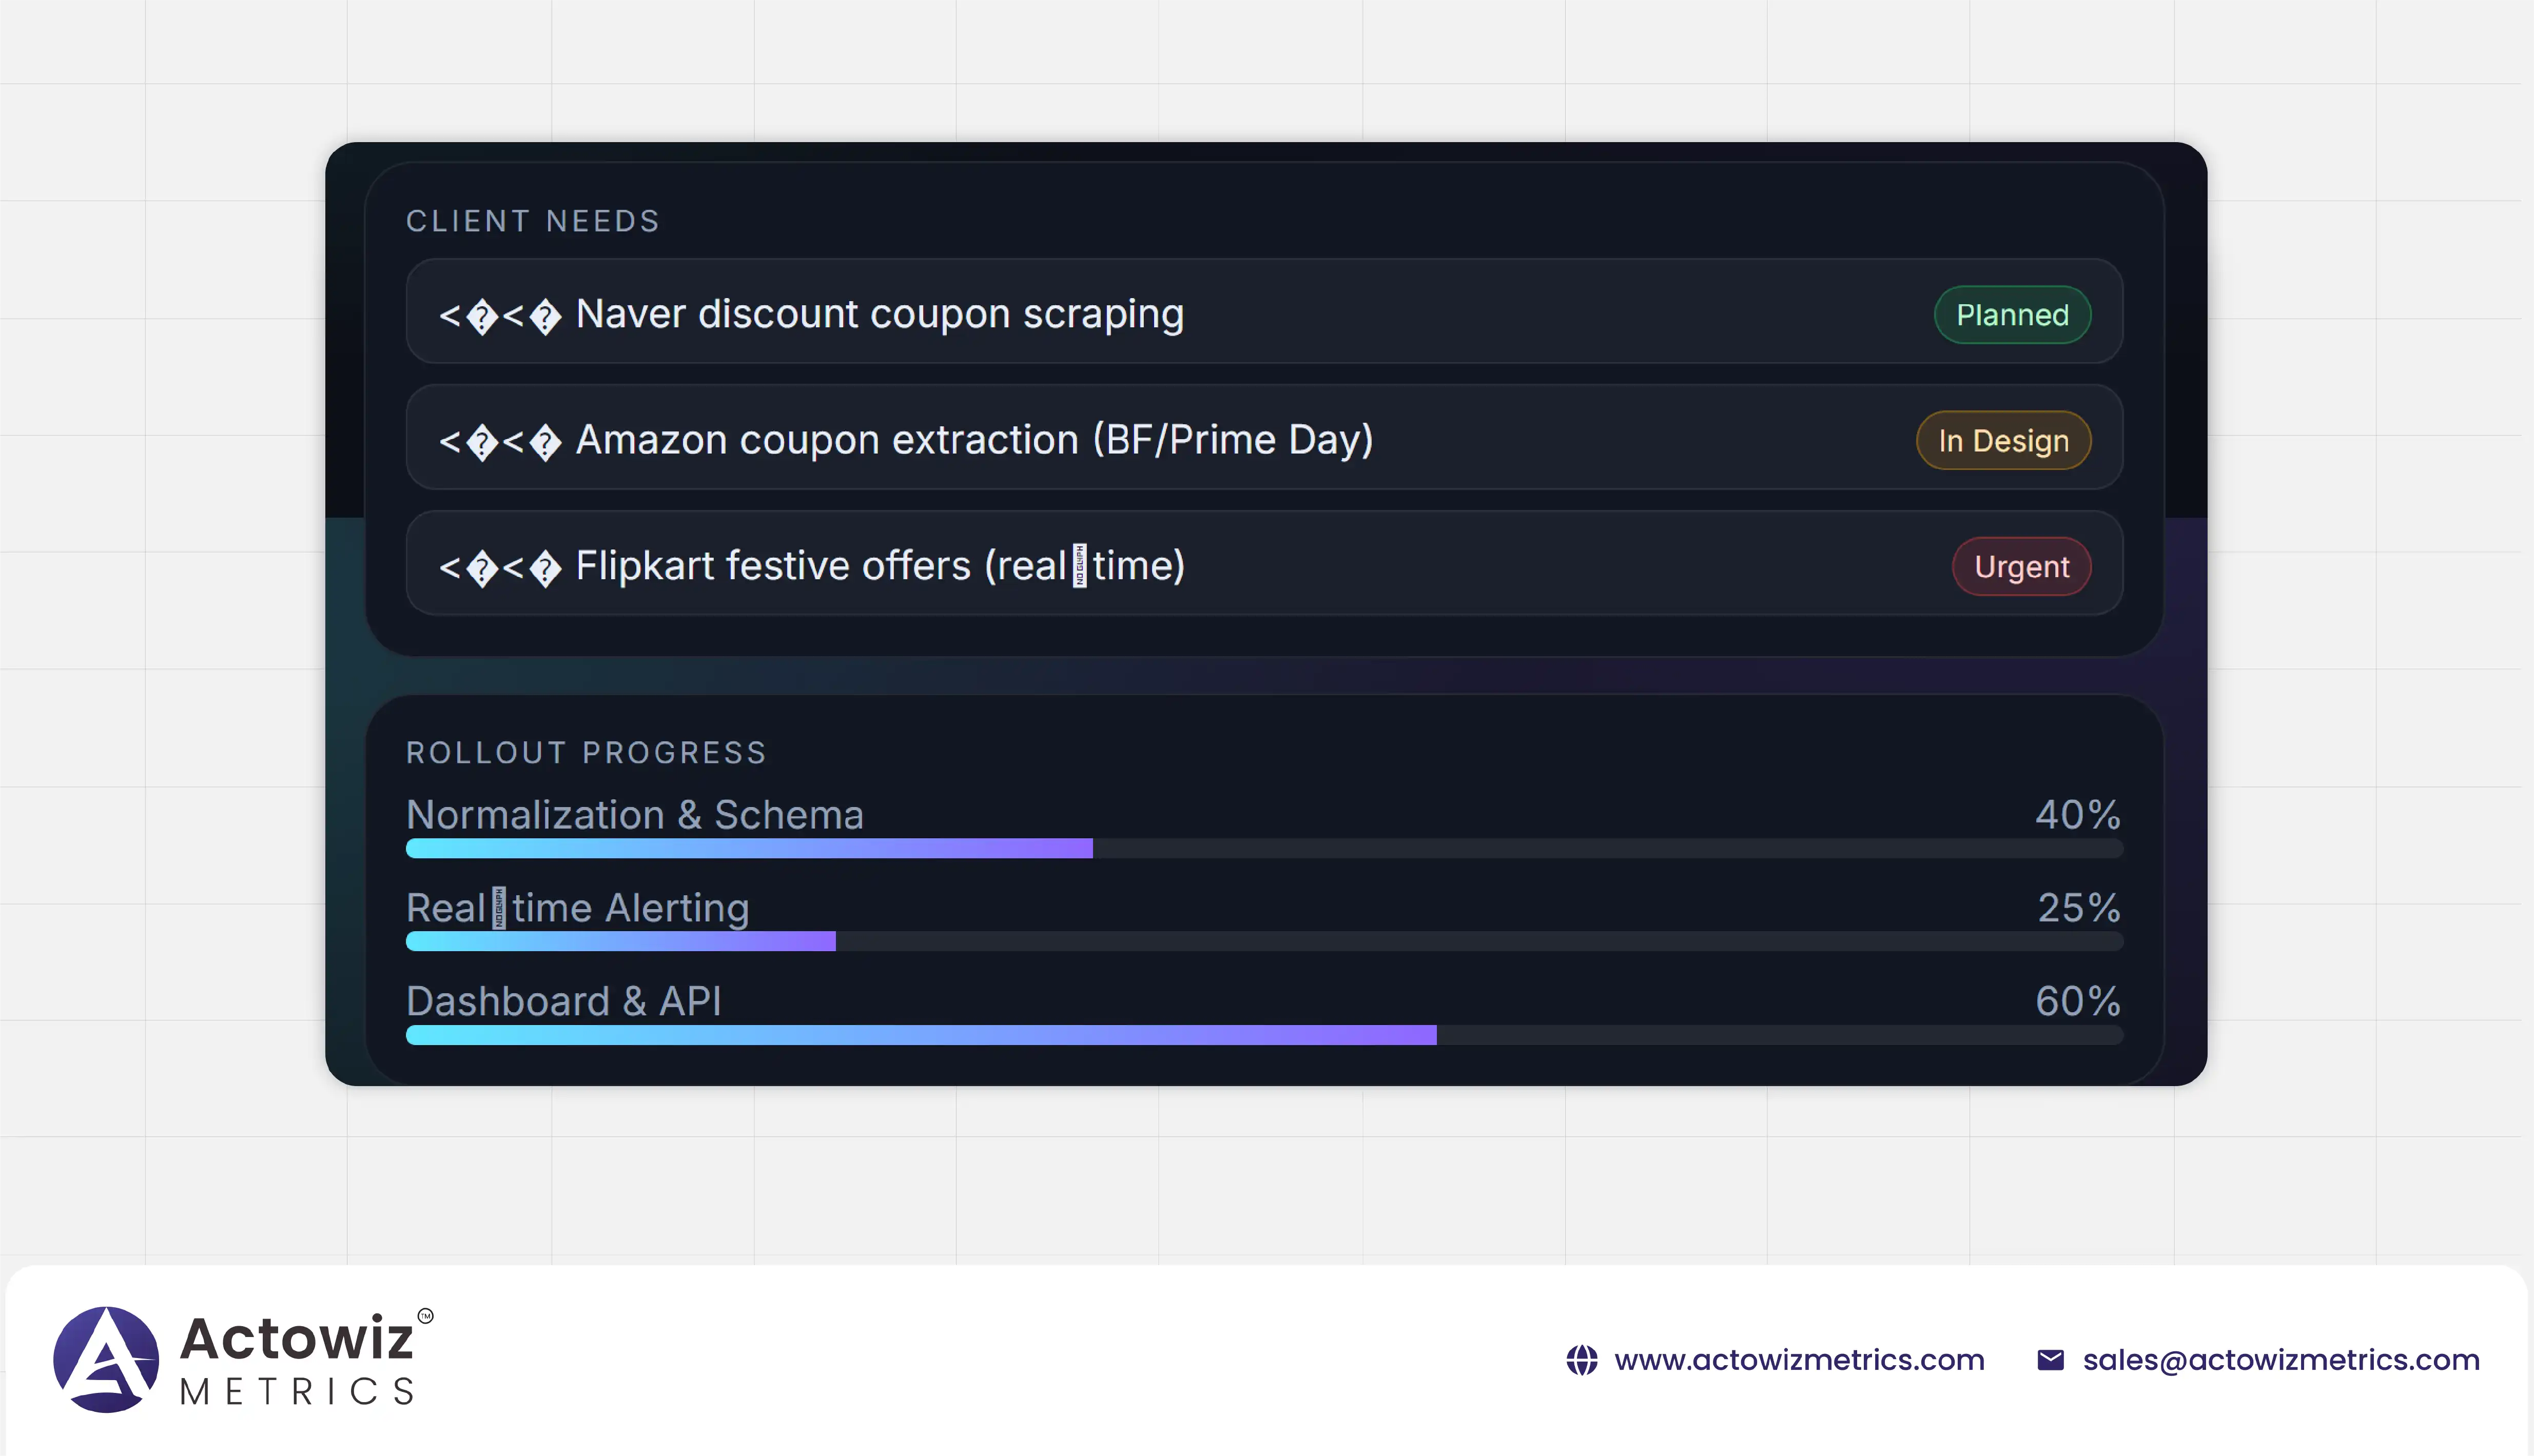
Following the success of this festive sale coupon monitoring initiative, the client plans to:
With Actowiz Metrics expertise in ecommerce data scraping services & ecommerce data analytics, brands can turn the chaos of festive season couponing into a strategic advantage.
From Naver discount coupon data scraping in South Korea to scrape Amazon coupon codes during festive season globally and extract Flipkart festive sale offers in India, Actowiz provided the client with unmatched visibility into the competitive landscape.
Multi-channel discount coupon analysis and ecommerce festive sale discount analytics enabled faster decisions, better promotions, and stronger market positioning during the most crucial retail periods of the year.

Whatever your project size is, we will handle it well with all the standards fulfilled! We are here to give 100% satisfaction.
Any analytics feature you need — we provide it
24/7 global support
Real-time analytics dashboard
Full data transparency at every stage
Customized solutions to achieve your data analysis goals