Create your own


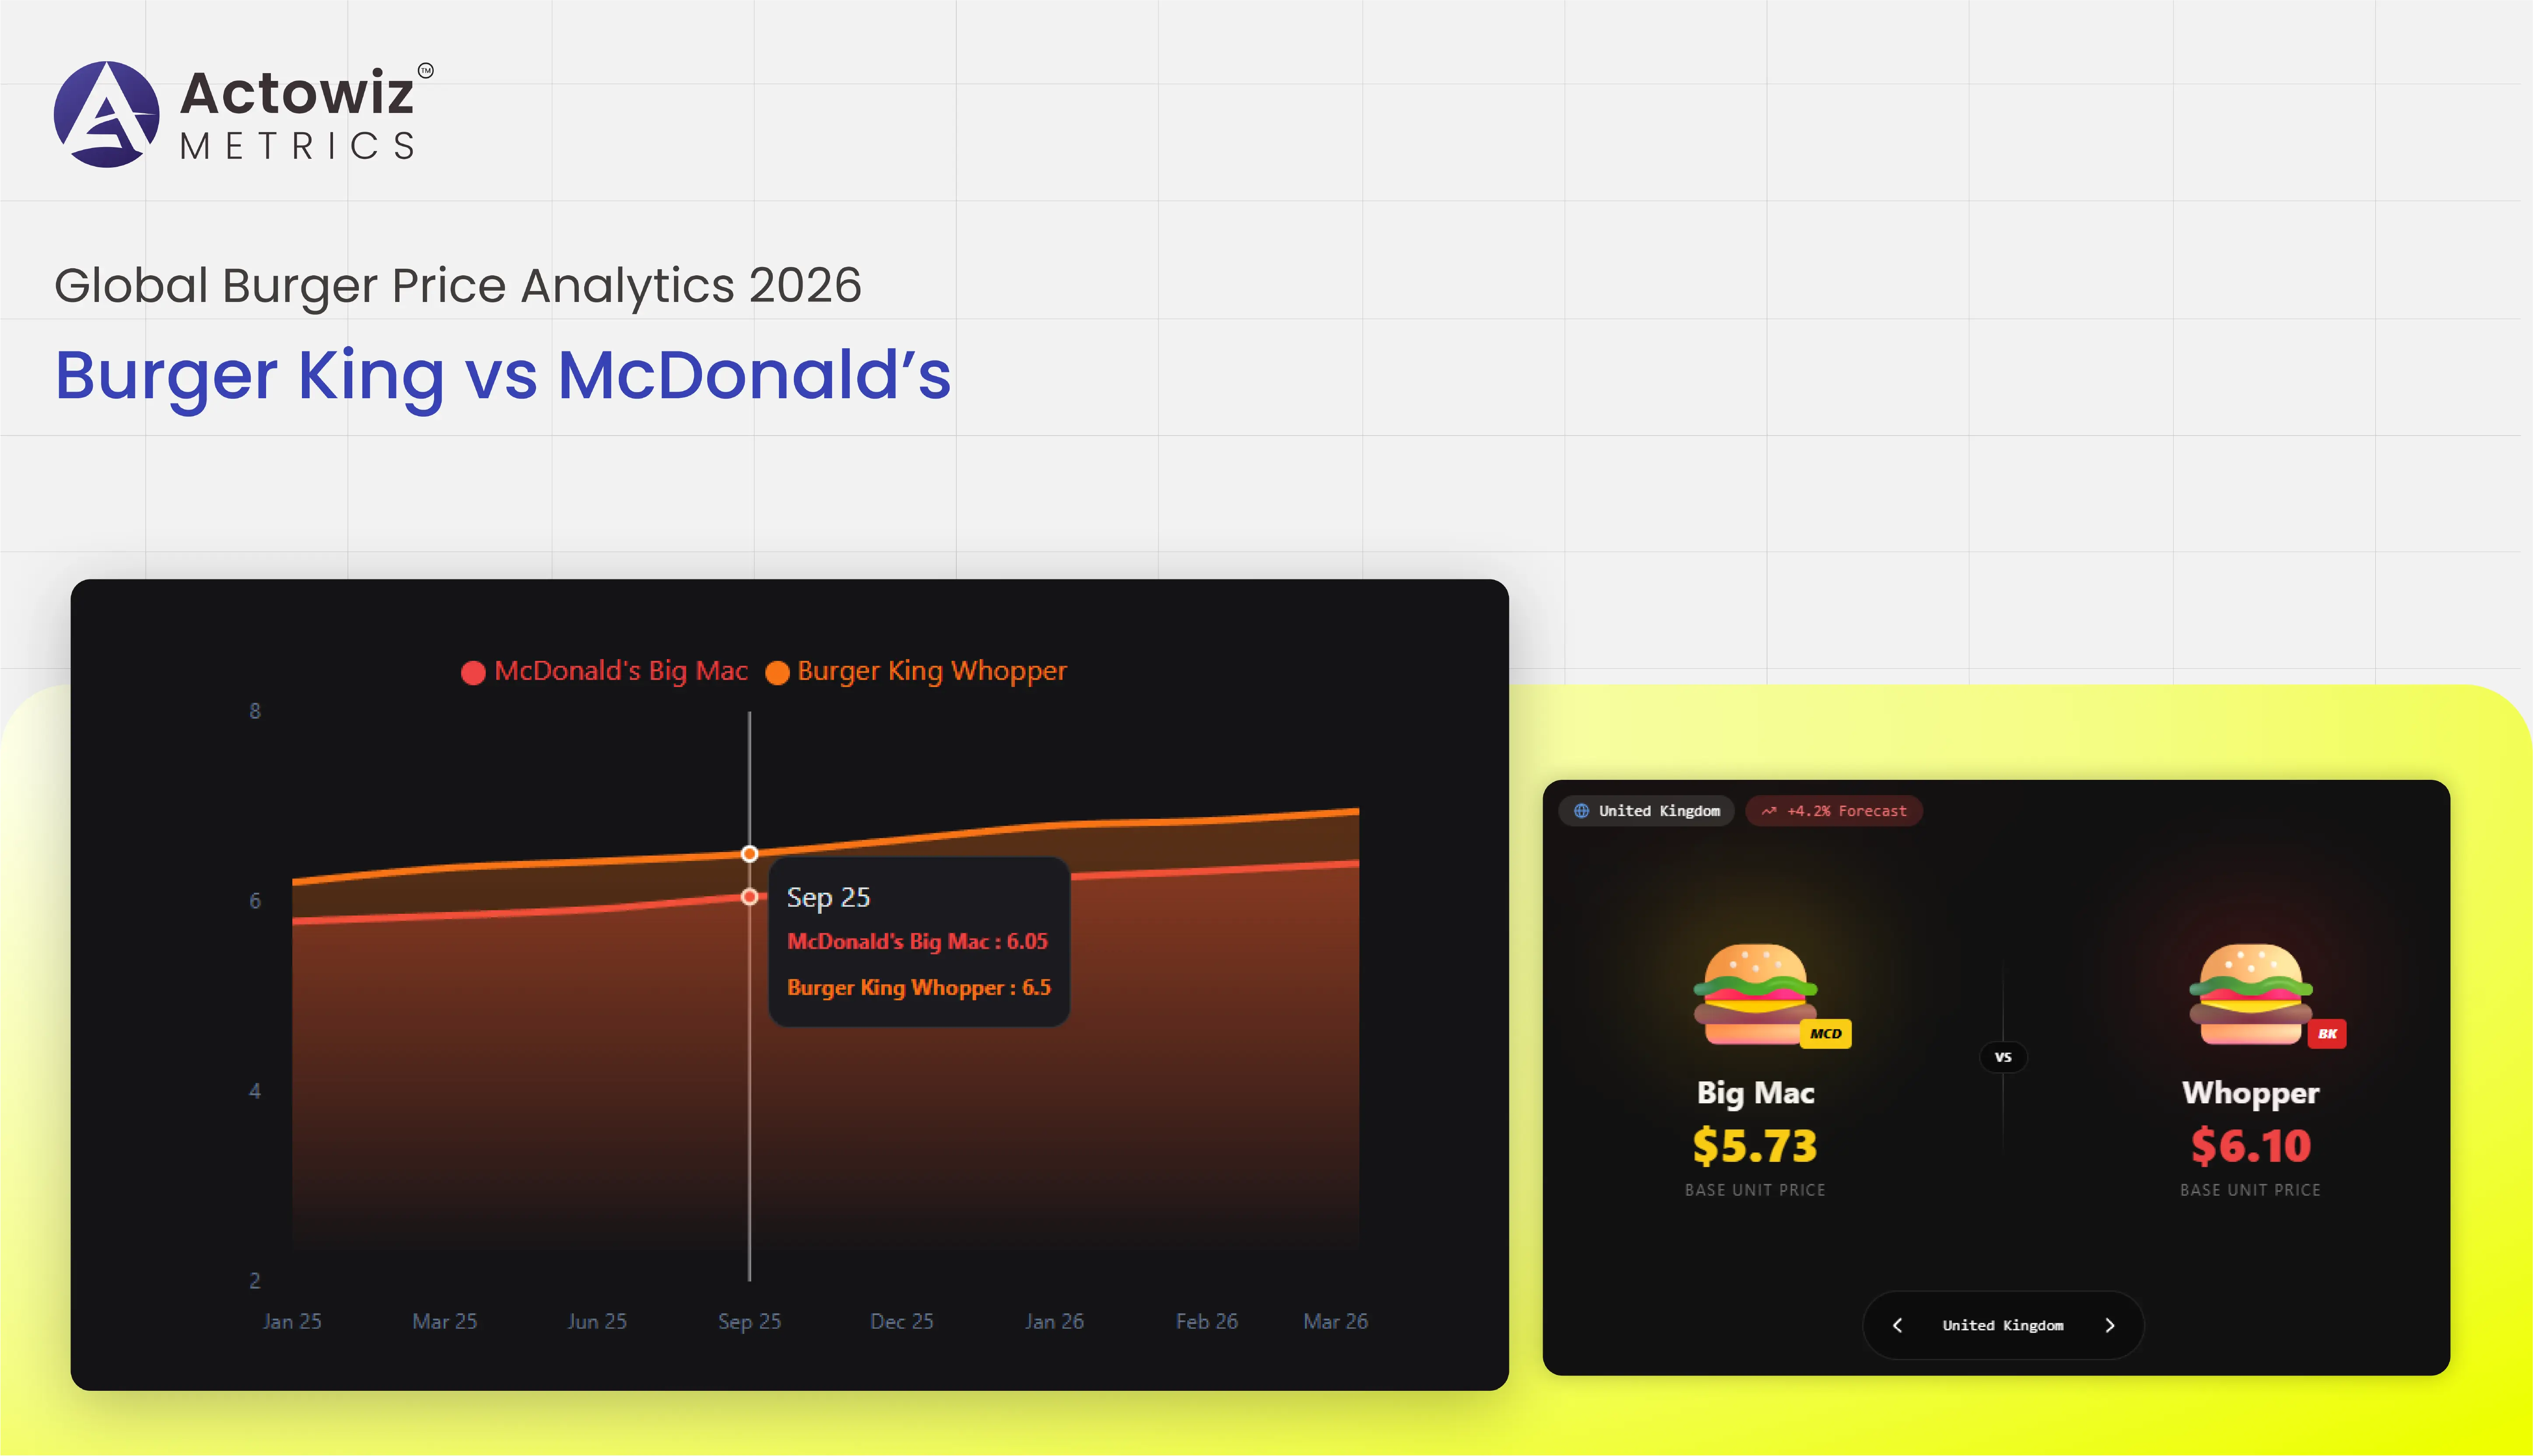
The global quick-service restaurant (QSR) landscape has evolved rapidly over the past decade, with pricing strategies becoming increasingly data-driven and competitive. This report, Global Burger Price Analytics 2026 - Burger King vs McDonald’s, delivers a comprehensive evaluation of pricing trends, affordability metrics, and regional variations across key international markets. By leveraging advanced Food Analytics, businesses can better understand how pricing influences consumer behavior and brand positioning.
Between 2020 and 2026, inflation, supply chain disruptions, and digital transformation have significantly impacted menu pricing. Industry leaders like Burger King and McDonald's have adopted dynamic pricing strategies to maintain profitability while ensuring customer retention. This report examines how both brands differ in pricing approaches, value perception, and regional adaptation.
Using structured datasets and comparative analytics, this study highlights actionable insights for stakeholders seeking competitive intelligence in the QSR industry. From entry-level burgers to premium offerings, pricing disparities reflect broader economic trends and localized demand patterns.
In this section, we explore how businesses can Scrape Burger King Vs McDonald’s Menu Price Comparison using advanced tools and combine it with Digital Shelf Analytics to uncover pricing trends across countries.
| Year | Burger King Avg Price | McDonald’s Avg Price |
|---|---|---|
| 2020 | 4.20 | 4.00 |
| 2021 | 4.40 | 4.15 |
| 2022 | 4.80 | 4.50 |
| 2023 | 5.10 | 4.90 |
| 2024 | 5.40 | 5.20 |
| 2025 | 5.70 | 5.50 |
| 2026 | 6.00 | 5.80 |
Between 2020 and 2026, both brands have experienced steady price increases, driven largely by inflation and operational costs. However, Burger King consistently maintains a slight premium in pricing compared to McDonald’s, particularly in developed markets like the U.S. and Western Europe.
Digital shelf insights reveal that McDonald’s leverages psychological pricing and bundled offers more effectively, creating a perception of affordability. Meanwhile, Burger King emphasizes product differentiation, such as flame-grilled preparation, to justify higher price points.
Additionally, online platforms and food delivery apps have introduced location-based dynamic pricing, making digital tracking essential. Companies utilizing structured scraping and shelf analytics tools gain a real-time understanding of price fluctuations and competitor positioning.
Analyzing Burger King Menu Data Extraction Insights alongside Price Benchmarking helps businesses understand how pricing varies by geography and economic conditions.
| Region | Burger King (USD) | McDonald’s (USD) |
|---|---|---|
| North America | 6.50 | 6.20 |
| Europe | 6.20 | 5.90 |
| Asia | 4.80 | 4.50 |
| Latin America | 4.20 | 4.00 |
| Middle East | 5.60 | 5.30 |
Regional differences highlight how brands adapt to local purchasing power. In emerging markets, both companies offer lower-priced menu items to maintain accessibility. However, McDonald’s often leads in affordability, while Burger King focuses on premium positioning.
Price benchmarking also shows that currency fluctuations and taxation significantly affect menu pricing. For example, European markets experience higher VAT rates, pushing prices upward compared to Asia.
Furthermore, localized menu offerings influence pricing structures. McDonald’s introduces region-specific items at competitive rates, while Burger King focuses on standardized products with slight regional customization.
Businesses leveraging data extraction tools can monitor these patterns in real time, enabling strategic pricing adjustments and improved market entry planning.
The use of McDonald’s Menu Price Tracking Solutions combined with Brand Competition Analysis reveals how each brand positions itself in a crowded QSR market.
| Year | Burger King Growth | McDonald’s Growth |
|---|---|---|
| 2021 | 4.8% | 3.7% |
| 2022 | 9.1% | 8.4% |
| 2023 | 6.3% | 5.8% |
| 2024 | 5.9% | 6.1% |
| 2025 | 5.5% | 5.7% |
| 2026 | 5.2% | 5.4% |
While both brands show similar growth trajectories, McDonald’s demonstrates more consistent pricing increases, indicating a stable long-term strategy. Burger King, on the other hand, shows slightly higher volatility, reflecting promotional campaigns and repositioning efforts.
Competition analysis highlights that McDonald’s invests heavily in value meals and loyalty programs, ensuring repeat customer engagement. Burger King counters this with aggressive discounting during promotional periods and product innovation.
Tracking solutions enable businesses to monitor these strategies across digital platforms, providing insights into competitor pricing moves and promotional effectiveness.
The integration of Global QSR Competitive Price Intelligence with Product Data Tracking is essential for understanding the broader competitive landscape.
| Year | Burger King | McDonald’s |
|---|---|---|
| 2020 | 15% | 18% |
| 2021 | 22% | 25% |
| 2022 | 30% | 34% |
| 2023 | 38% | 42% |
| 2024 | 45% | 48% |
| 2025 | 52% | 55% |
| 2026 | 60% | 63% |
The rise of digital ordering has significantly influenced pricing strategies. McDonald’s leads in digital adoption, allowing for more sophisticated dynamic pricing models. Burger King is rapidly catching up, investing in mobile apps and delivery partnerships.
Product data tracking also reveals that premium burger categories have seen higher price growth compared to basic items. This indicates a shift toward value-added offerings and consumer willingness to pay more for perceived quality.
Companies leveraging competitive intelligence tools can identify gaps in the market and optimize their pricing strategies accordingly.
Through Cross-Country Burger Price Benchmarking 2026, businesses can compare pricing strategies across different economic environments.
| Year | Burger King Index | McDonald’s Index |
|---|---|---|
| 2020 | 100 | 100 |
| 2021 | 105 | 103 |
| 2022 | 114 | 111 |
| 2023 | 121 | 118 |
| 2024 | 128 | 125 |
| 2025 | 135 | 132 |
| 2026 | 143 | 140 |
The index shows that Burger King’s prices have increased slightly faster than McDonald’s over the six-year period. This reflects its strategy of maintaining a premium perception.
Cross-country analysis also highlights the role of economic stability, labor costs, and supply chain efficiency in determining menu prices. Countries with strong currencies and higher wages tend to have higher burger prices.
Additionally, global events such as pandemics and geopolitical tensions have influenced pricing trends, making real-time benchmarking essential for businesses.
Using analytics tools to Extract Burger King Vs McDonald’s Pricing Strategy Insights provides valuable foresight into future market trends.
| Year | Burger King (USD) | McDonald’s (USD) |
|---|---|---|
| 2027 | 6.30 | 6.10 |
| 2028 | 6.60 | 6.40 |
Future projections indicate continued price increases, driven by inflation and evolving consumer expectations. However, both brands are expected to balance pricing with value offerings to maintain customer loyalty.
Strategically, McDonald’s is likely to expand its digital ecosystem, while Burger King may focus on product innovation and premiumization. Sustainability initiatives and supply chain transparency will also play a crucial role in pricing decisions.
Businesses that leverage advanced analytics and data extraction tools will gain a competitive edge by anticipating market shifts and optimizing pricing strategies proactively.
Actowiz Metrics stands out as a leader in delivering actionable insights through advanced data analytics solutions.With expertise in Burger King Bestselling Food Analytics, the company empowers businesses to make data-driven decisions with precision and confidence.
Actowiz Metrics offers comprehensive services, including real-time price tracking, competitor benchmarking, and digital shelf monitoring. Their cutting-edge technology ensures accurate data extraction across global markets, enabling businesses to stay ahead of competitors.
By combining industry expertise with advanced analytics tools, Actowiz Metrics helps clients uncover hidden trends, optimize pricing strategies, and enhance operational efficiency. Their solutions are tailored to meet the unique needs of the QSR industry, ensuring maximum ROI and sustainable growth.
This report underscores the importance of data-driven decision-making in the QSR industry. From pricing trends to competitive positioning, insights derived from analytics play a crucial role in shaping business strategies. Leveraging McDonald’s Bestselling Food Analytics, companies can gain a deeper understanding of consumer preferences and market dynamics.
As global competition intensifies, businesses must adopt advanced analytics tools to remain competitive. Real-time data, predictive insights, and strategic benchmarking will define success in the evolving food industry landscape.
Partner with Actowiz Metrics today to unlock powerful pricing intelligence and transform your QSR strategy with data-driven precision.

Whatever your project size is, we will handle it well with all the standards fulfilled! We are here to give 100% satisfaction.
Any analytics feature you need — we provide it
24/7 global support
Real-time analytics dashboard
Full data transparency at every stage
Customized solutions to achieve your data analysis goals