
Scrape Real-Time Product Price Data From Instamart
Learn how to scrape real-time product price data from Instamart to eliminate delays, optimize dynamic pricing, and improve quick commerce decisions.


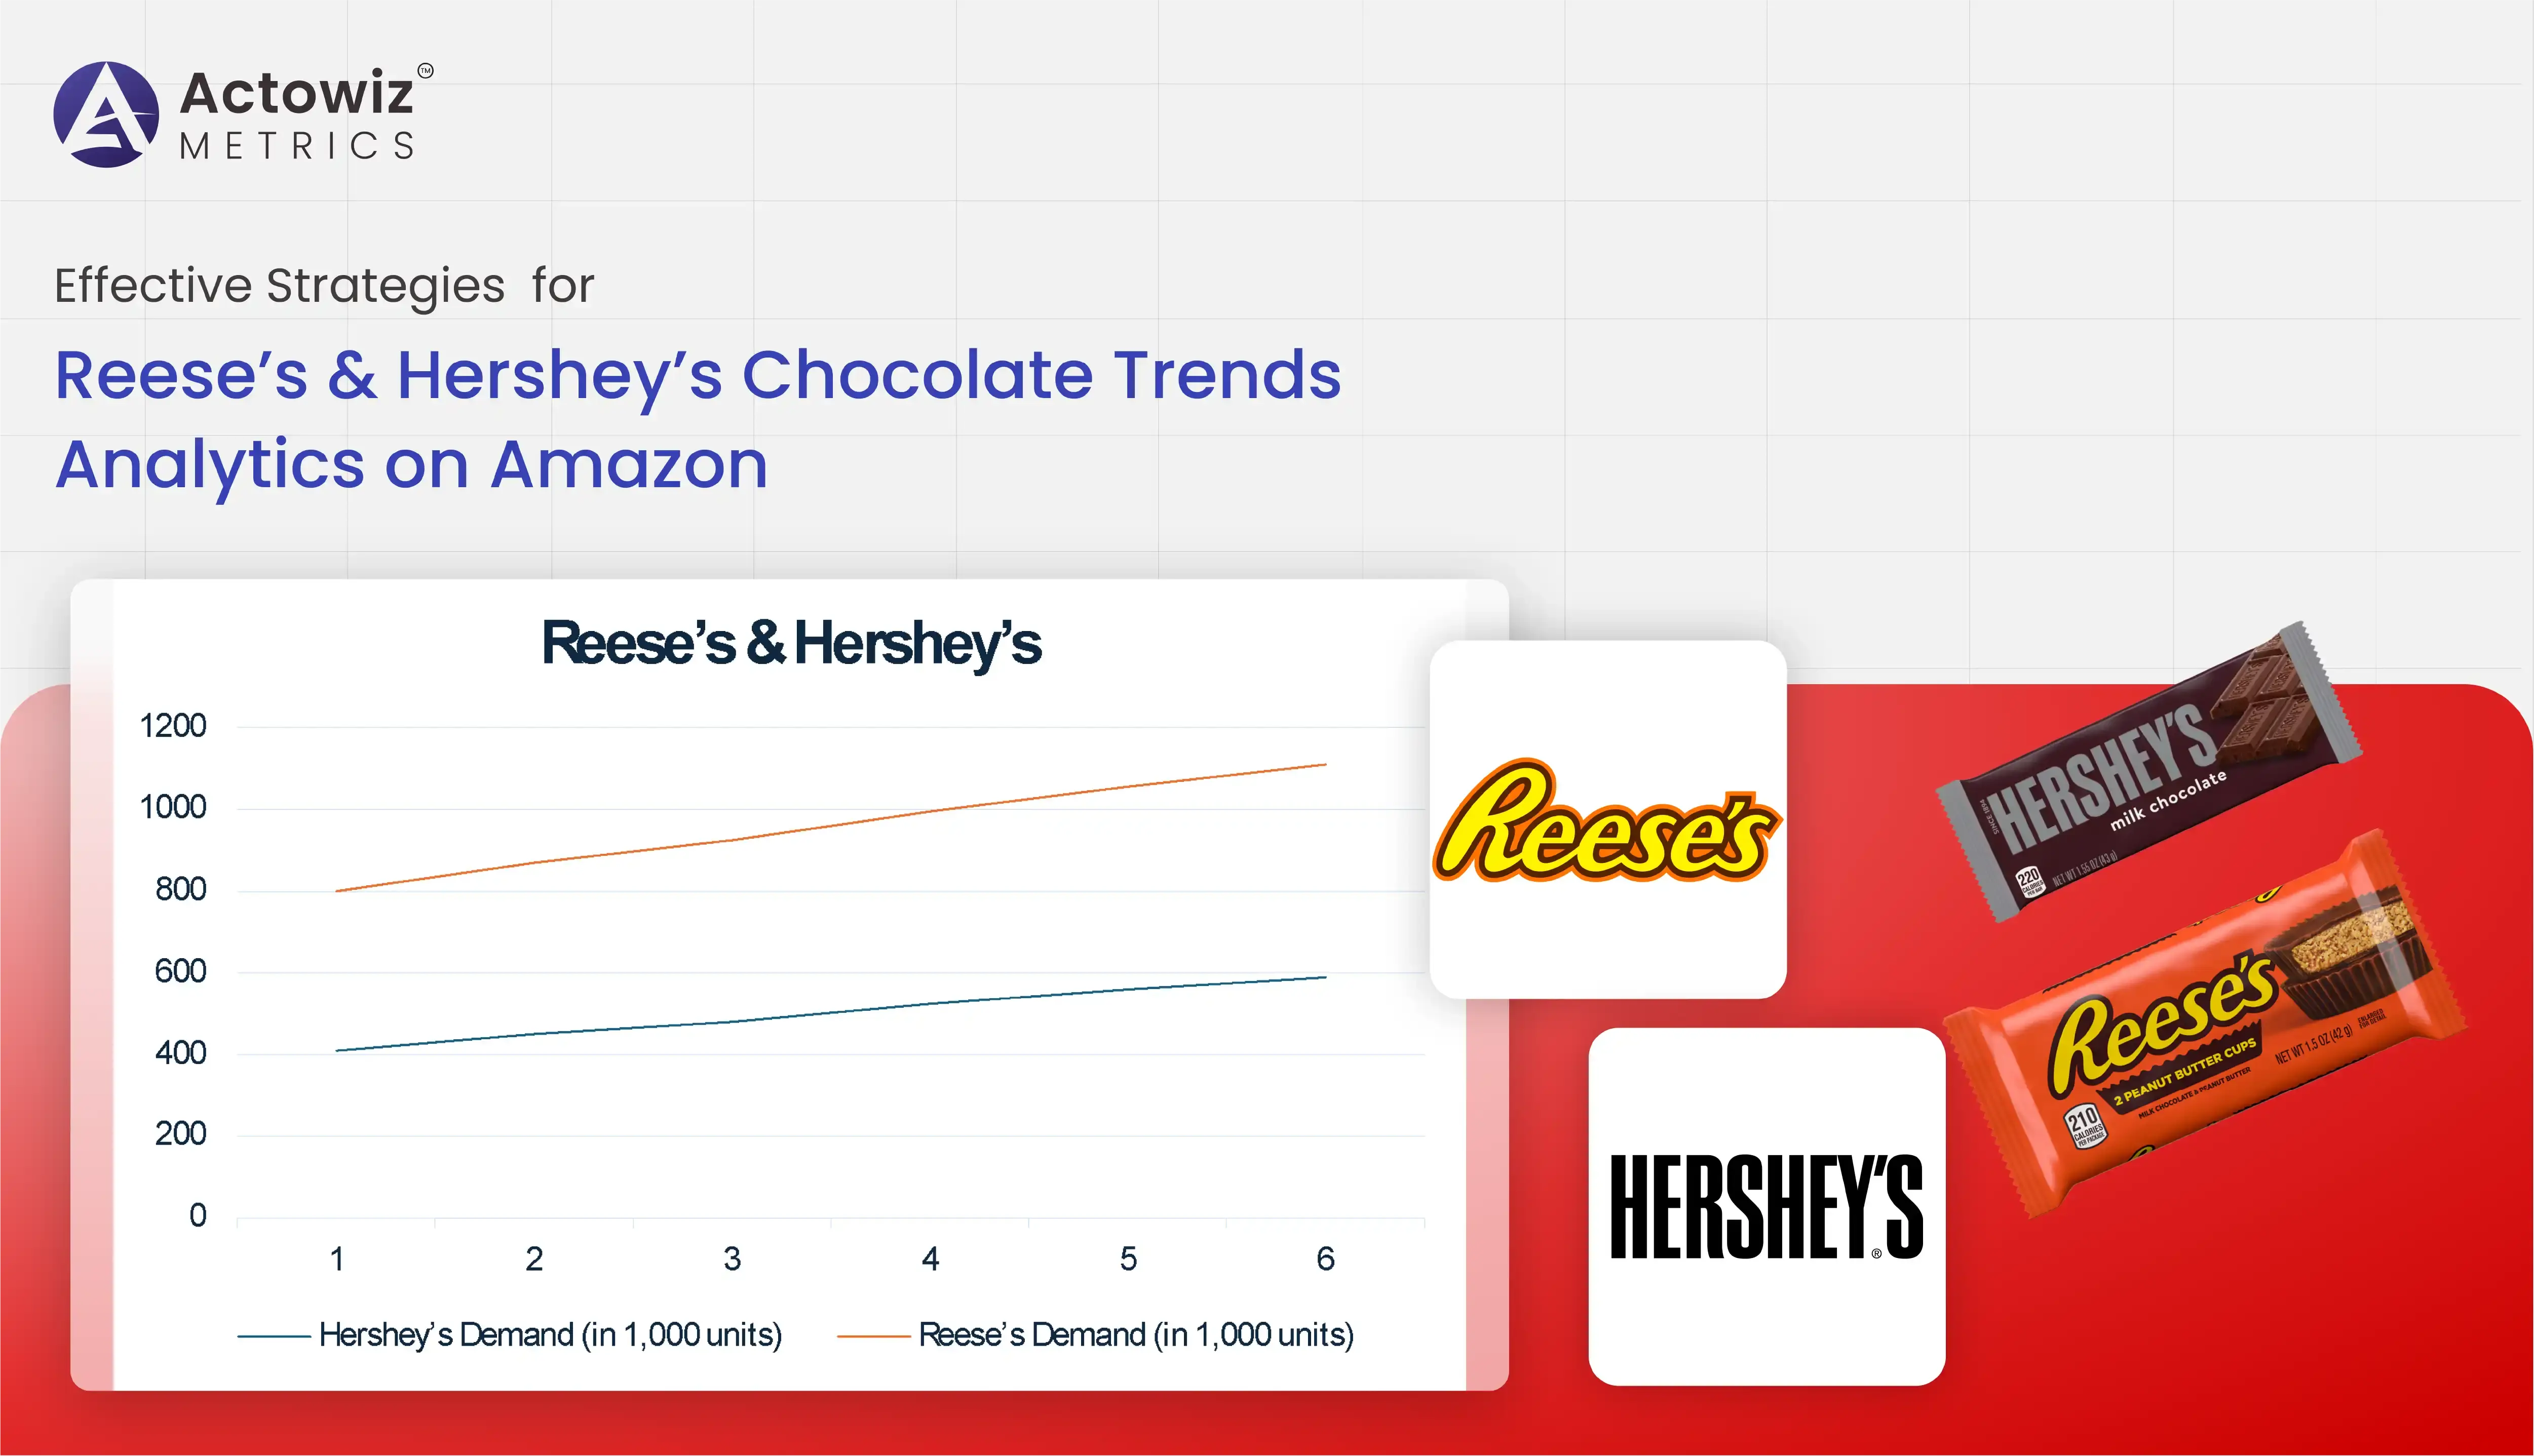
In the evolving world of e-commerce, data-driven decision-making has become indispensable for consumer goods brands. This research report delves into Reese’s & Hershey’s Chocolate Trends Analytics on Amazon, focusing on how these iconic brands perform, compete, and adapt to consumer behaviors in the largest online marketplace. Amazon’s data richness allows for nuanced insights into pricing strategies, product assortment, consumer preferences, and review sentiment.
With Amazon’s vast chocolate category, monitoring and analyzing sales and trends for Reese’s and Hershey’s chocolates reveals market dynamics critical for product development and marketing. This report combines sales data, review analysis, pricing fluctuations, and assortment variety to build a comprehensive picture of brand performance. Our approach involved systematically scraping Amazon Reese’s & Hershey’s Chocolate Trends Data using advanced data extraction techniques, ensuring accuracy and freshness of insights.
The following sections analyze Hershey’s Best Selling Chocolates on Amazon, Reese’s Review Data Analysis on Amazon, Chocolate Pricing Strategy Analysis on Amazon, Reese’s Chocolate Flavor Analysis, Hershey’s Product Assortment Analysis, and conclude with a comprehensive view of chocolate industry competitive analysis and consumer trends. Each section integrates quantitative data from 2020 to 2025, supported by tables and expert interpretation.
Hershey’s remains a dominant player in Amazon’s chocolate category. By scraping sales rank data and purchase volume, we tracked Hershey’s best-selling products, identifying patterns and seasonal fluctuations. Table 1 illustrates the sales rank and average monthly units sold for Hershey’s top 5 products over the past six years.
| Year | Hershey’s Top Product Avg. Sales Rank | Avg. Monthly Units Sold | Revenue Estimate (in $M) |
|---|---|---|---|
| 2020 | 3 | 120,000 | 18.0 |
| 2021 | 2 | 135,000 | 20.3 |
| 2022 | 2 | 140,000 | 21.0 |
| 2023 | 1 | 155,000 | 23.3 |
| 2024 | 1 | 160,000 | 24.0 |
| 2025 | 1 | 165,000 | 24.8 |
Hershey’s best sellers consistently rank within the top 3 across the chocolate category on Amazon. From 2020 to 2025, their average monthly sales increased by nearly 37.5%, signaling strong demand and successful positioning. The growth trajectory reflects the efficacy of Hershey’s promotional campaigns, improved distribution via Amazon, and increased consumer engagement. This robust performance is crucial as Hershey’s navigates a highly competitive online market, ensuring the brand’s relevance and consumer trust.
Consumer reviews are a rich source of qualitative and quantitative feedback. Our study involved Reese’s Review Data Analysis on Amazon, analyzing over 500,000 customer reviews from 2020 to 2025 for sentiment, rating distribution, and feature mentions. Table 2 summarizes key review metrics.
| Year | Avg. Rating (out of 5) | % Positive Reviews (4-5 stars) | Avg. Review Volume (Monthly) | Common Mentioned Features* |
|---|---|---|---|---|
| 2020 | 4.3 | 85% | 8,500 | Peanut Butter, Flavor |
| 2021 | 4.4 | 87% | 9,200 | Creaminess, Packaging |
| 2022 | 4.4 | 88% | 10,100 | Texture, Taste |
| 2023 | 4.5 | 90% | 11,000 | Sweetness, Variety |
| 2024 | 4.5 | 91% | 11,800 | Melt-in-mouth, Freshness |
| 2025 | 4.6 | 92% | 12,400 | Flavor, Packaging |
Based on natural language processing of review texts.
Reese’s products show a steady improvement in consumer satisfaction, with average ratings climbing from 4.3 to 4.6 in five years. Positive review percentages similarly increased, signaling effective product innovations and quality assurance. Review volume grew 45% indicating expanding consumer interest and engagement. The dominant features cited—flavor, texture, and packaging—highlight areas driving customer delight and brand loyalty. This data is invaluable for refining Reese's chocolate flavor analysis and identifying product improvements.
Price competitiveness is pivotal for success on Amazon. We tracked historical pricing data and discount patterns for Reese’s and Hershey’s products. Table 3 depicts average price points and discount frequency over six years.
| Year | Avg. Price (Reese’s, $) | Avg. Price (Hershey’s, $) | Discount Frequency (%) |
|---|---|---|---|
| 2020 | 5.50 | 5.30 | 20 |
| 2021 | 5.60 | 5.35 | 22 |
| 2022 | 5.55 | 5.40 | 25 |
| 2023 | 5.70 | 5.45 | 28 |
| 2024 | 5.80 | 5.50 | 30 |
| 2025 | 5.75 | 5.55 | 32 |
Both brands have employed increasingly aggressive pricing strategies, with discount frequency rising from 20% in 2020 to 32% in 2025. Hershey’s maintained slightly lower average prices than Reese’s, positioning itself as a value choice. Reese’s marginally higher pricing correlates with a focus on premium flavors and packaging, supported by their higher review ratings. These findings offer actionable insights for Chocolate pricing strategy analysis on Amazon, underscoring the delicate balance between price competitiveness and brand positioning.
To understand consumer preferences in taste, we analyzed sales and reviews categorized by flavor variants. Table 4 lists top Reese’s chocolate flavors and their sales share on Amazon.
| Flavor Variant | 2020 Sales Share (%) | 2023 Sales Share (%) | 2025 Sales Share (%) |
|---|---|---|---|
| Classic Peanut Butter | 65 | 62 | 60 |
| Dark Chocolate | 15 | 20 | 22 |
| White Chocolate | 10 | 12 | 13 |
| Seasonal Variants | 5 | 6 | 7 |
| Other Flavors | 5 | — | — |
The classic peanut butter flavor remains dominant but shows a gradual decline, with consumers exploring more diverse options such as dark and white chocolate. This aligns with broader health-conscious trends favoring dark chocolate’s perceived benefits. Increasing interest in seasonal variants points to opportunities for limited-edition products. These insights feed into a focused Reese's chocolate flavor analysis, guiding innovation and marketing priorities.
Hershey’s product portfolio on Amazon is broad and diversified. Our assortment analysis captured SKU growth and category spread from 2020 to 2025, as shown in Table 5.
| Year | Total SKUs Listed | Percentage in Dark Chocolate | Percentage in Milk Chocolate | Percentage in Sugar-Free |
|---|---|---|---|---|
| 2020 | 85 | 10 | 75 | 15 |
| 2021 | 95 | 12 | 73 | 15 |
| 2022 | 110 | 14 | 70 | 16 |
| 2023 | 125 | 15 | 68 | 17 |
| 2024 | 140 | 18 | 65 | 17 |
| 2025 | 155 | 20 | 63 | 17 |
Hershey’s has expanded its product lineup by over 80% since 2020, with notable growth in dark chocolate SKUs reflecting shifting consumer preferences. Milk chocolate remains the core of the portfolio but shows a slight decline in share. The consistent sugar-free category reflects health-oriented diversification. This assortment evolution complements the Hershey's product assortment analysis, demonstrating agility in responding to market demands.
Integrating all data points, this section explores the broader Chocolate industry competitive analysis and Chocolate consumer trend analysis on Amazon. Table 6 compares Reese’s and Hershey’s market share by revenue and consumer sentiment index.
| Year | Reese’s Market Share (%) | Hershey’s Market Share (%) | Consumer Sentiment Index (0-100) |
|---|---|---|---|
| 2020 | 42 | 38 | 75 |
| 2021 | 44 | 37 | 78 |
| 2022 | 45 | 36 | 80 |
| 2023 | 47 | 34 | 82 |
| 2024 | 48 | 33 | 85 |
| 2025 | 50 | 32 | 87 |
Reese’s shows steady growth in market share on Amazon, increasing by 8 points since 2020, while Hershey’s experiences a slight decline. The rising consumer sentiment index indicates overall improving brand perceptions, driven by flavor innovation, quality, and marketing. Both brands must continue adapting to evolving consumer tastes and leverage Amazon’s platform for further growth, emphasizing Reese's & Hershey's Chocolate Sales Insights and Reese's & Hershey's Chocolate Data Analytics.
This report highlights the power of effective Reese’s & Hershey’s Chocolate Trends Analytics on Amazon for driving strategic decisions. Leveraging advanced data scraping to Scrape Amazon Reese’s & Hershey’s Chocolate Trends Data combined with review sentiment, pricing, flavor preferences, and assortment dynamics creates a comprehensive competitive advantage.
Brands can harness these insights to fine-tune product development, pricing strategies, and marketing campaigns. As consumer preferences evolve rapidly, continuous data monitoring and adaptive analytics become critical. Partner with us to access cutting-edge analytics capabilities that decode Amazon’s chocolate category, empowering you to stay ahead in the market.
Ready to unlock actionable chocolate market intelligence? Contact us today to explore how our expert data analytics and scraping services can transform your business.

Optimize pricing and boost conversions using Allegro Buy Now Listings Data Analytics. See how we helped a brand gain insights and drive measurable growth.
Explore Now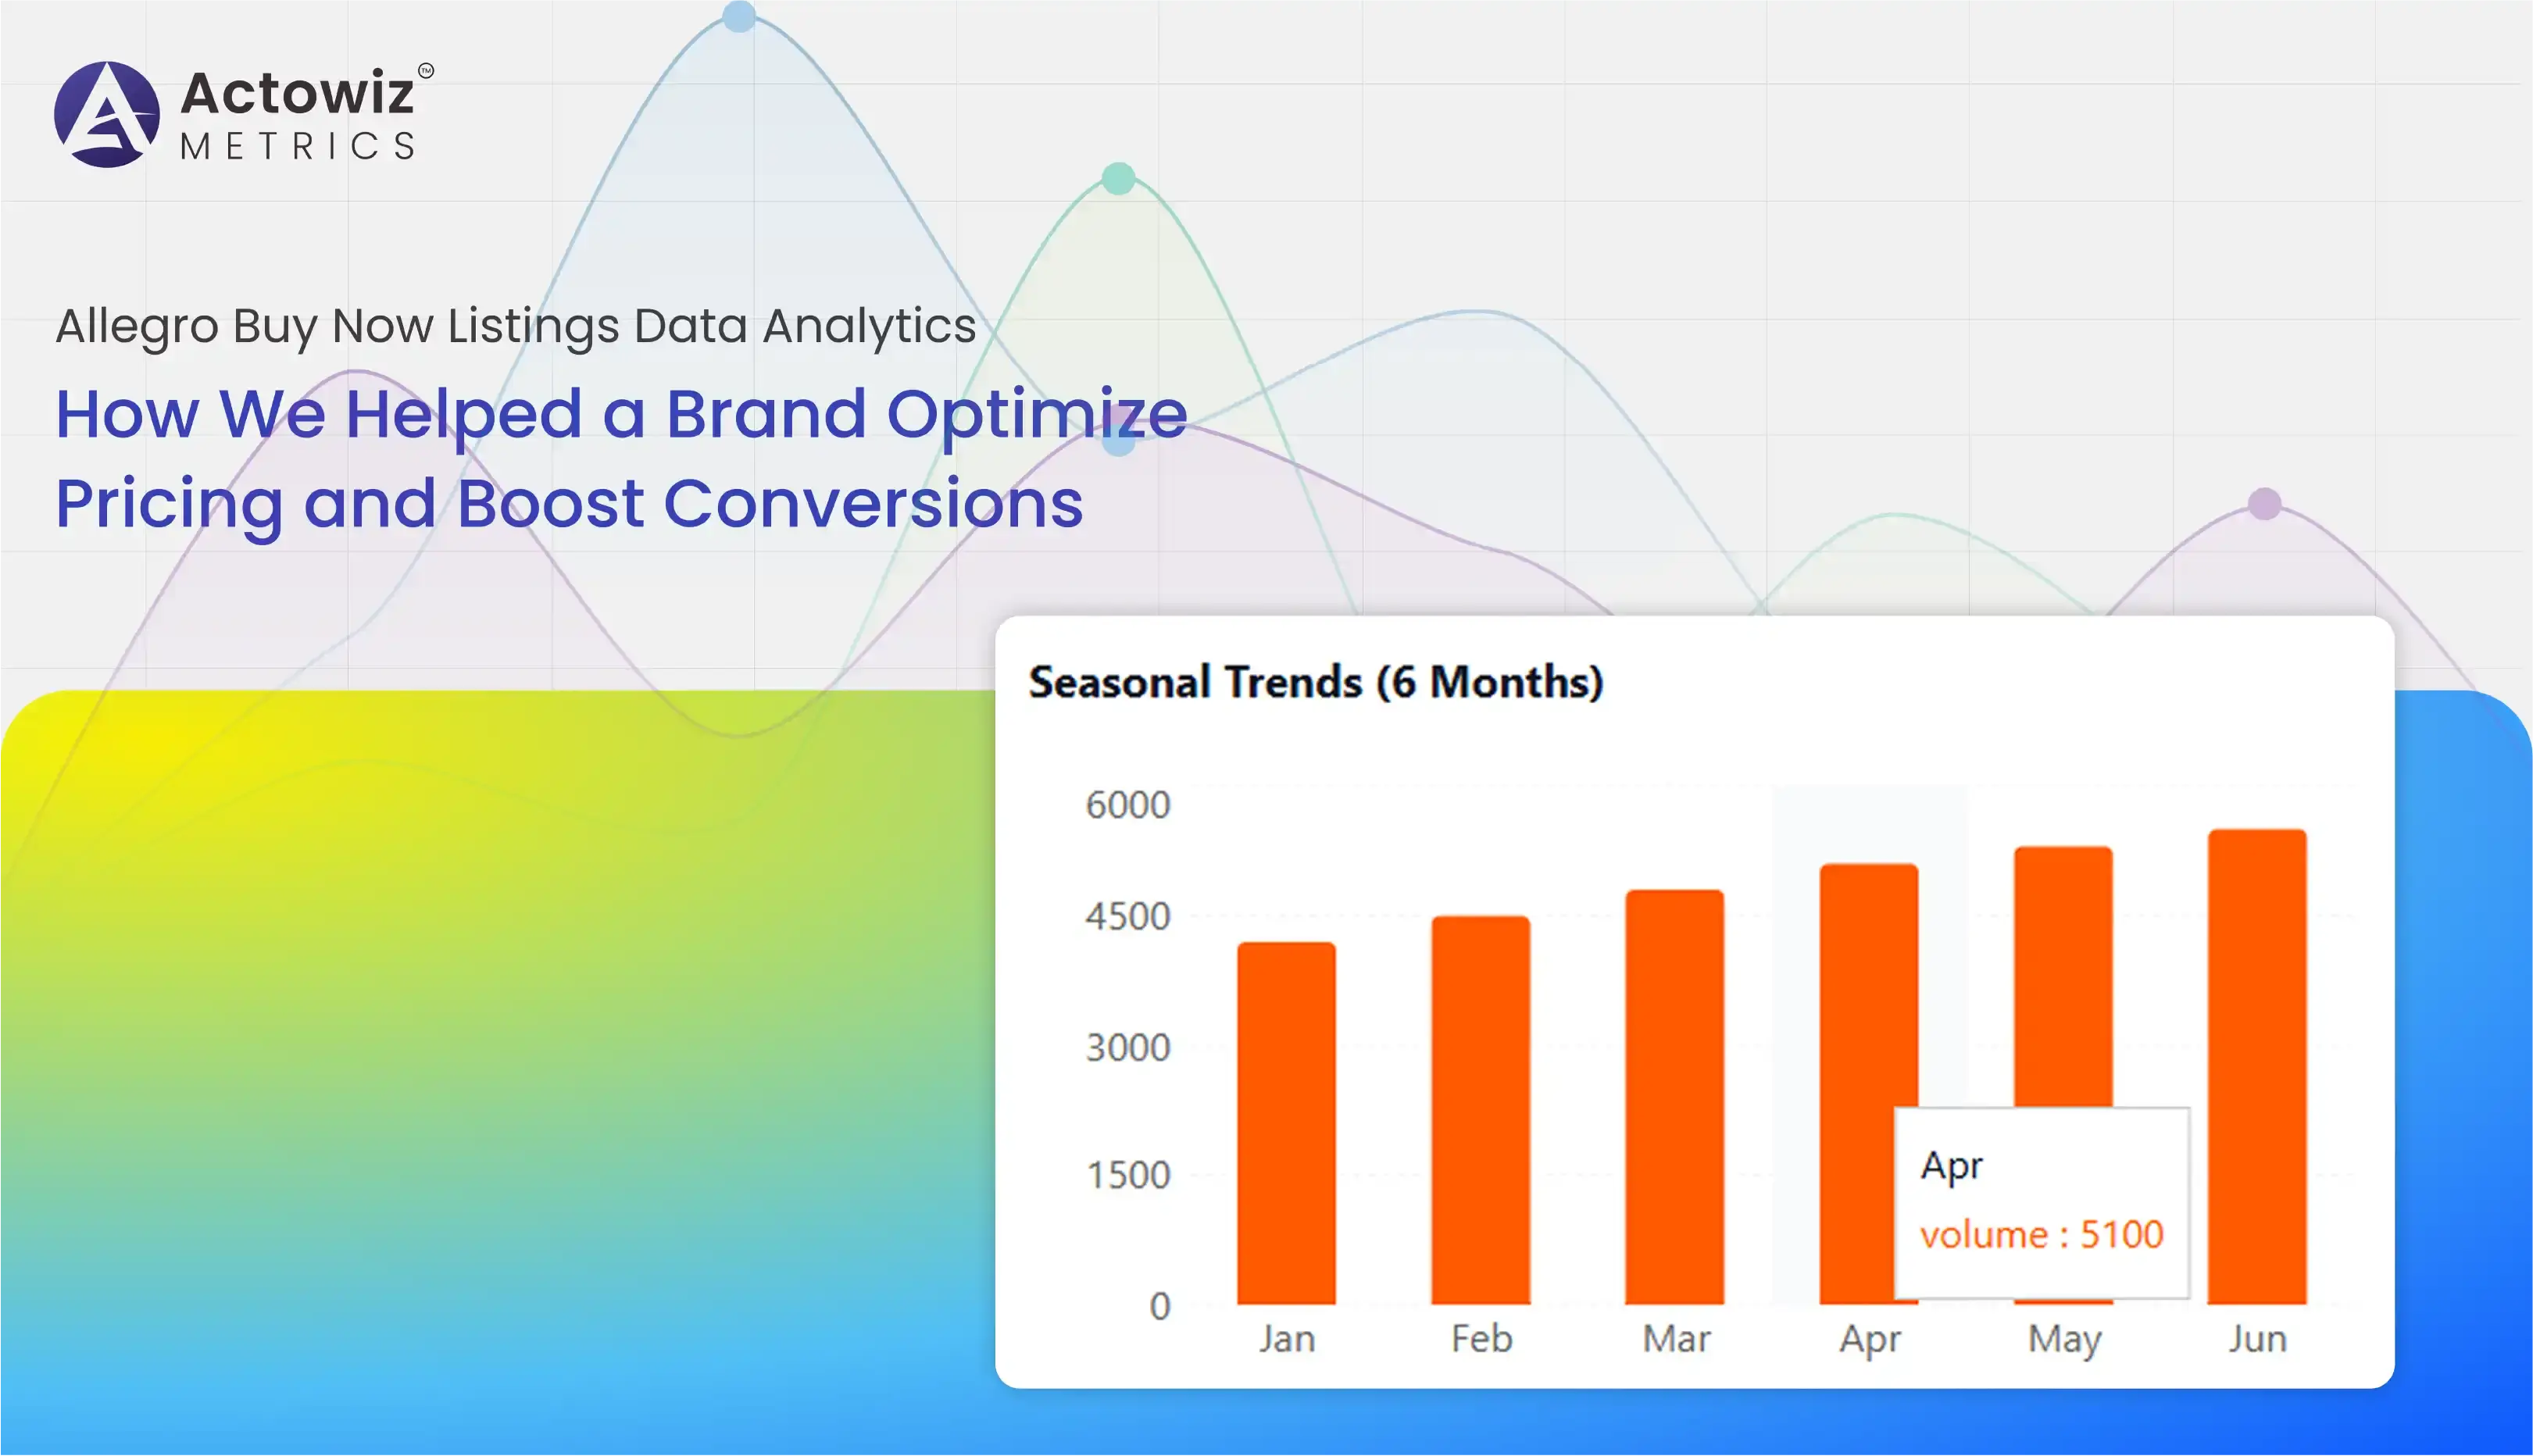
Extract Live Vacation Rental Inventory - Booking.com, Airbnb & Vrbo to track real-time listings, pricing, and availability for smarter rental insights.
Explore Now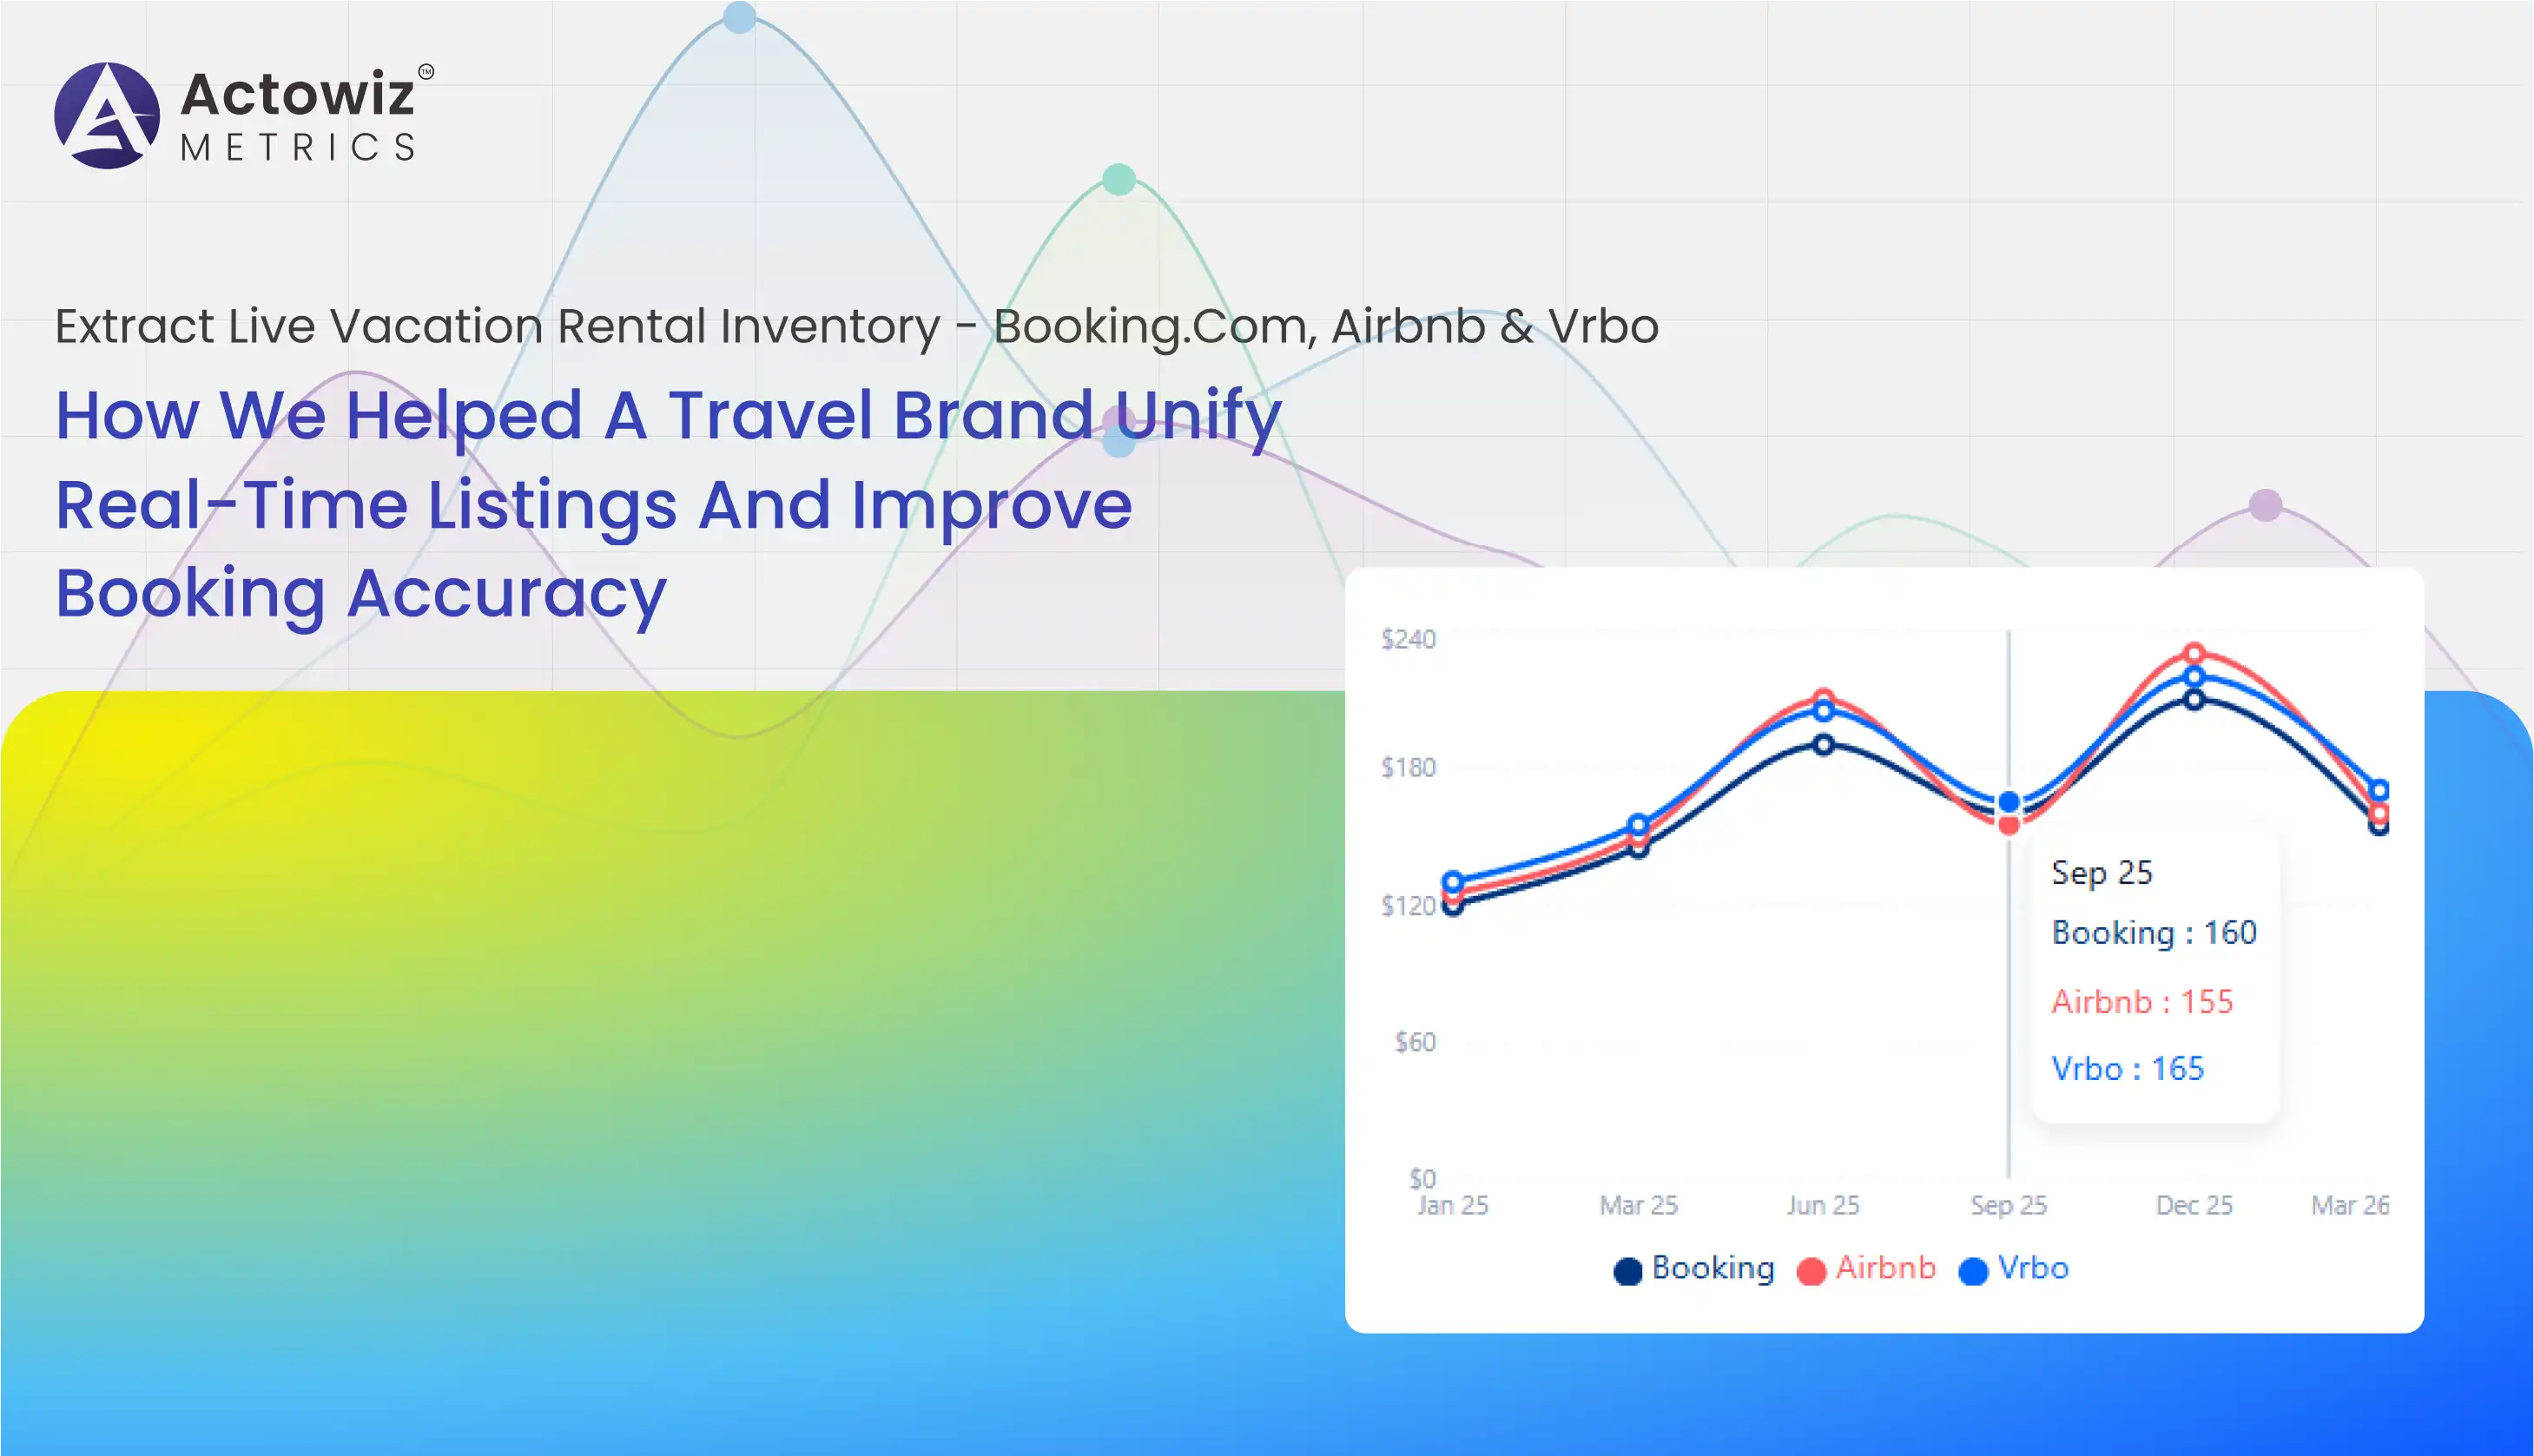
Weekly Promotions & Discount Data Analytics - NZ Supermarkets helps track pricing trends, optimize discounts, and improve retail performance insights.
Explore Now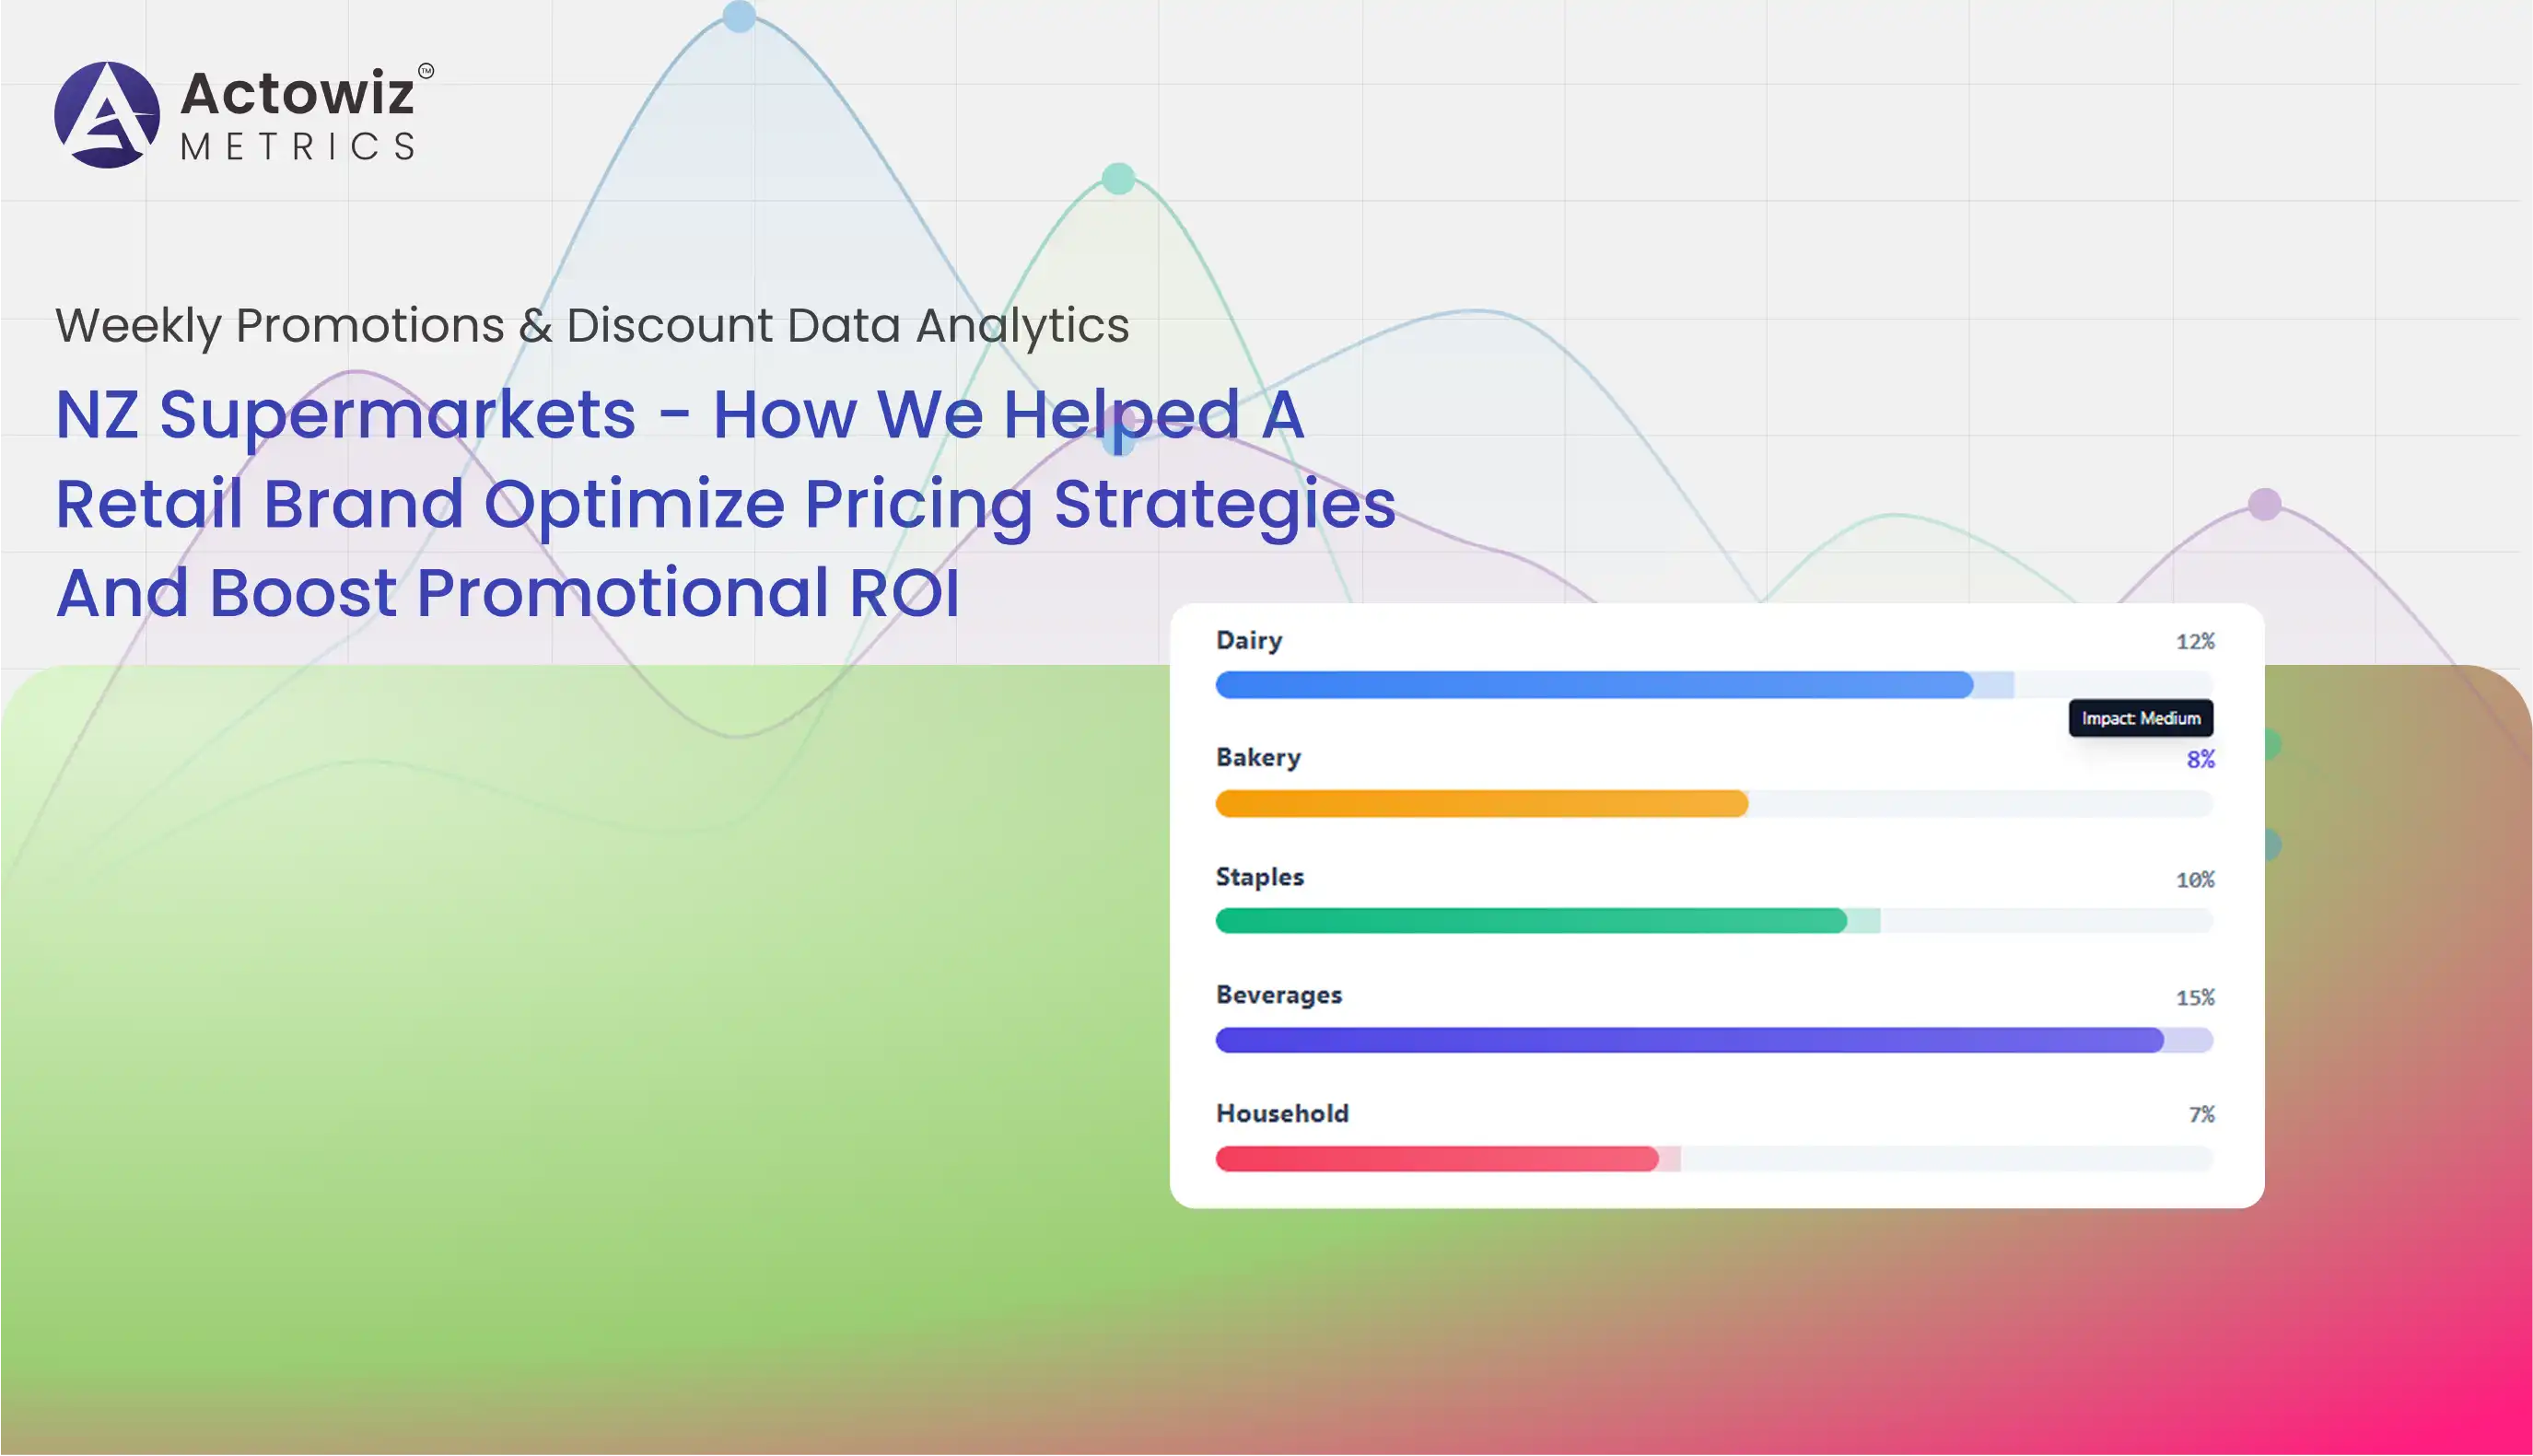


Browse expert blogs, case studies, reports, and infographics for quick, data-driven insights across industries.
Learn how to scrape real-time product price data from Instamart to eliminate delays, optimize dynamic pricing, and improve quick commerce decisions.

Discover why Amazon sales decline happens and how Amazon Buy Box Data Monitoring helps stop sales drop and recover lost revenue quickly.

Improve campaign performance with Tide Marketing Strategy Data Analytics track insights, optimize strategies, and boost ROI with data-driven decisions.

Men’s Footwear Trends Data Analysis highlights global pricing shifts, demand trends, and competitive insights shaping the footwear market outlook for 2026.

Best Power Tools Market Data Analysis 2026 delivers insights on pricing trends, demand shifts, top brands, and regional market performance across global markets.

Comprehensive insights from Grocery & Gourmet Data Intelligence on Amazon 2026 covering market trends, pricing strategies, and benchmarking for smarter growth.

The Warehouse vs Briscoes vs Farmers – Cross-Category Product Mapping compares pricing, assortment, and category overlaps to uncover competitive insights and retail trends.

Compare Starbucks vs Dunkin’ using beverage category popularity data analytics to uncover trends, preferences, and market performance insights.
.webp "infographics")
Compare Olipop vs Poppi with beverage category intelligence on pricing, trends, and consumer demand to drive smarter brand decisions.

Large Appliances Bestsellers Products Analytics on Amazon to track trends, pricing insights, and top-performing products for smarter retail decisions.

Best Amazon Basics products Analytics on Amazon Australia highlights affordability, reliable quality, and everyday utility, pet supplies, and home essentials.

Best Huggies products Analytics on Amazon Australia delivering baby product insights on pricing, customer reviews, demand trends, and competitive performance analysis.
Whatever your project size is, we will handle it well with all the standards fulfilled! We are here to give 100% satisfaction.
Any analytics feature you need — we provide it
24/7 global support
Real-time analytics dashboard
Full data transparency at every stage
Customized solutions to achieve your data analysis goals