BLOG




















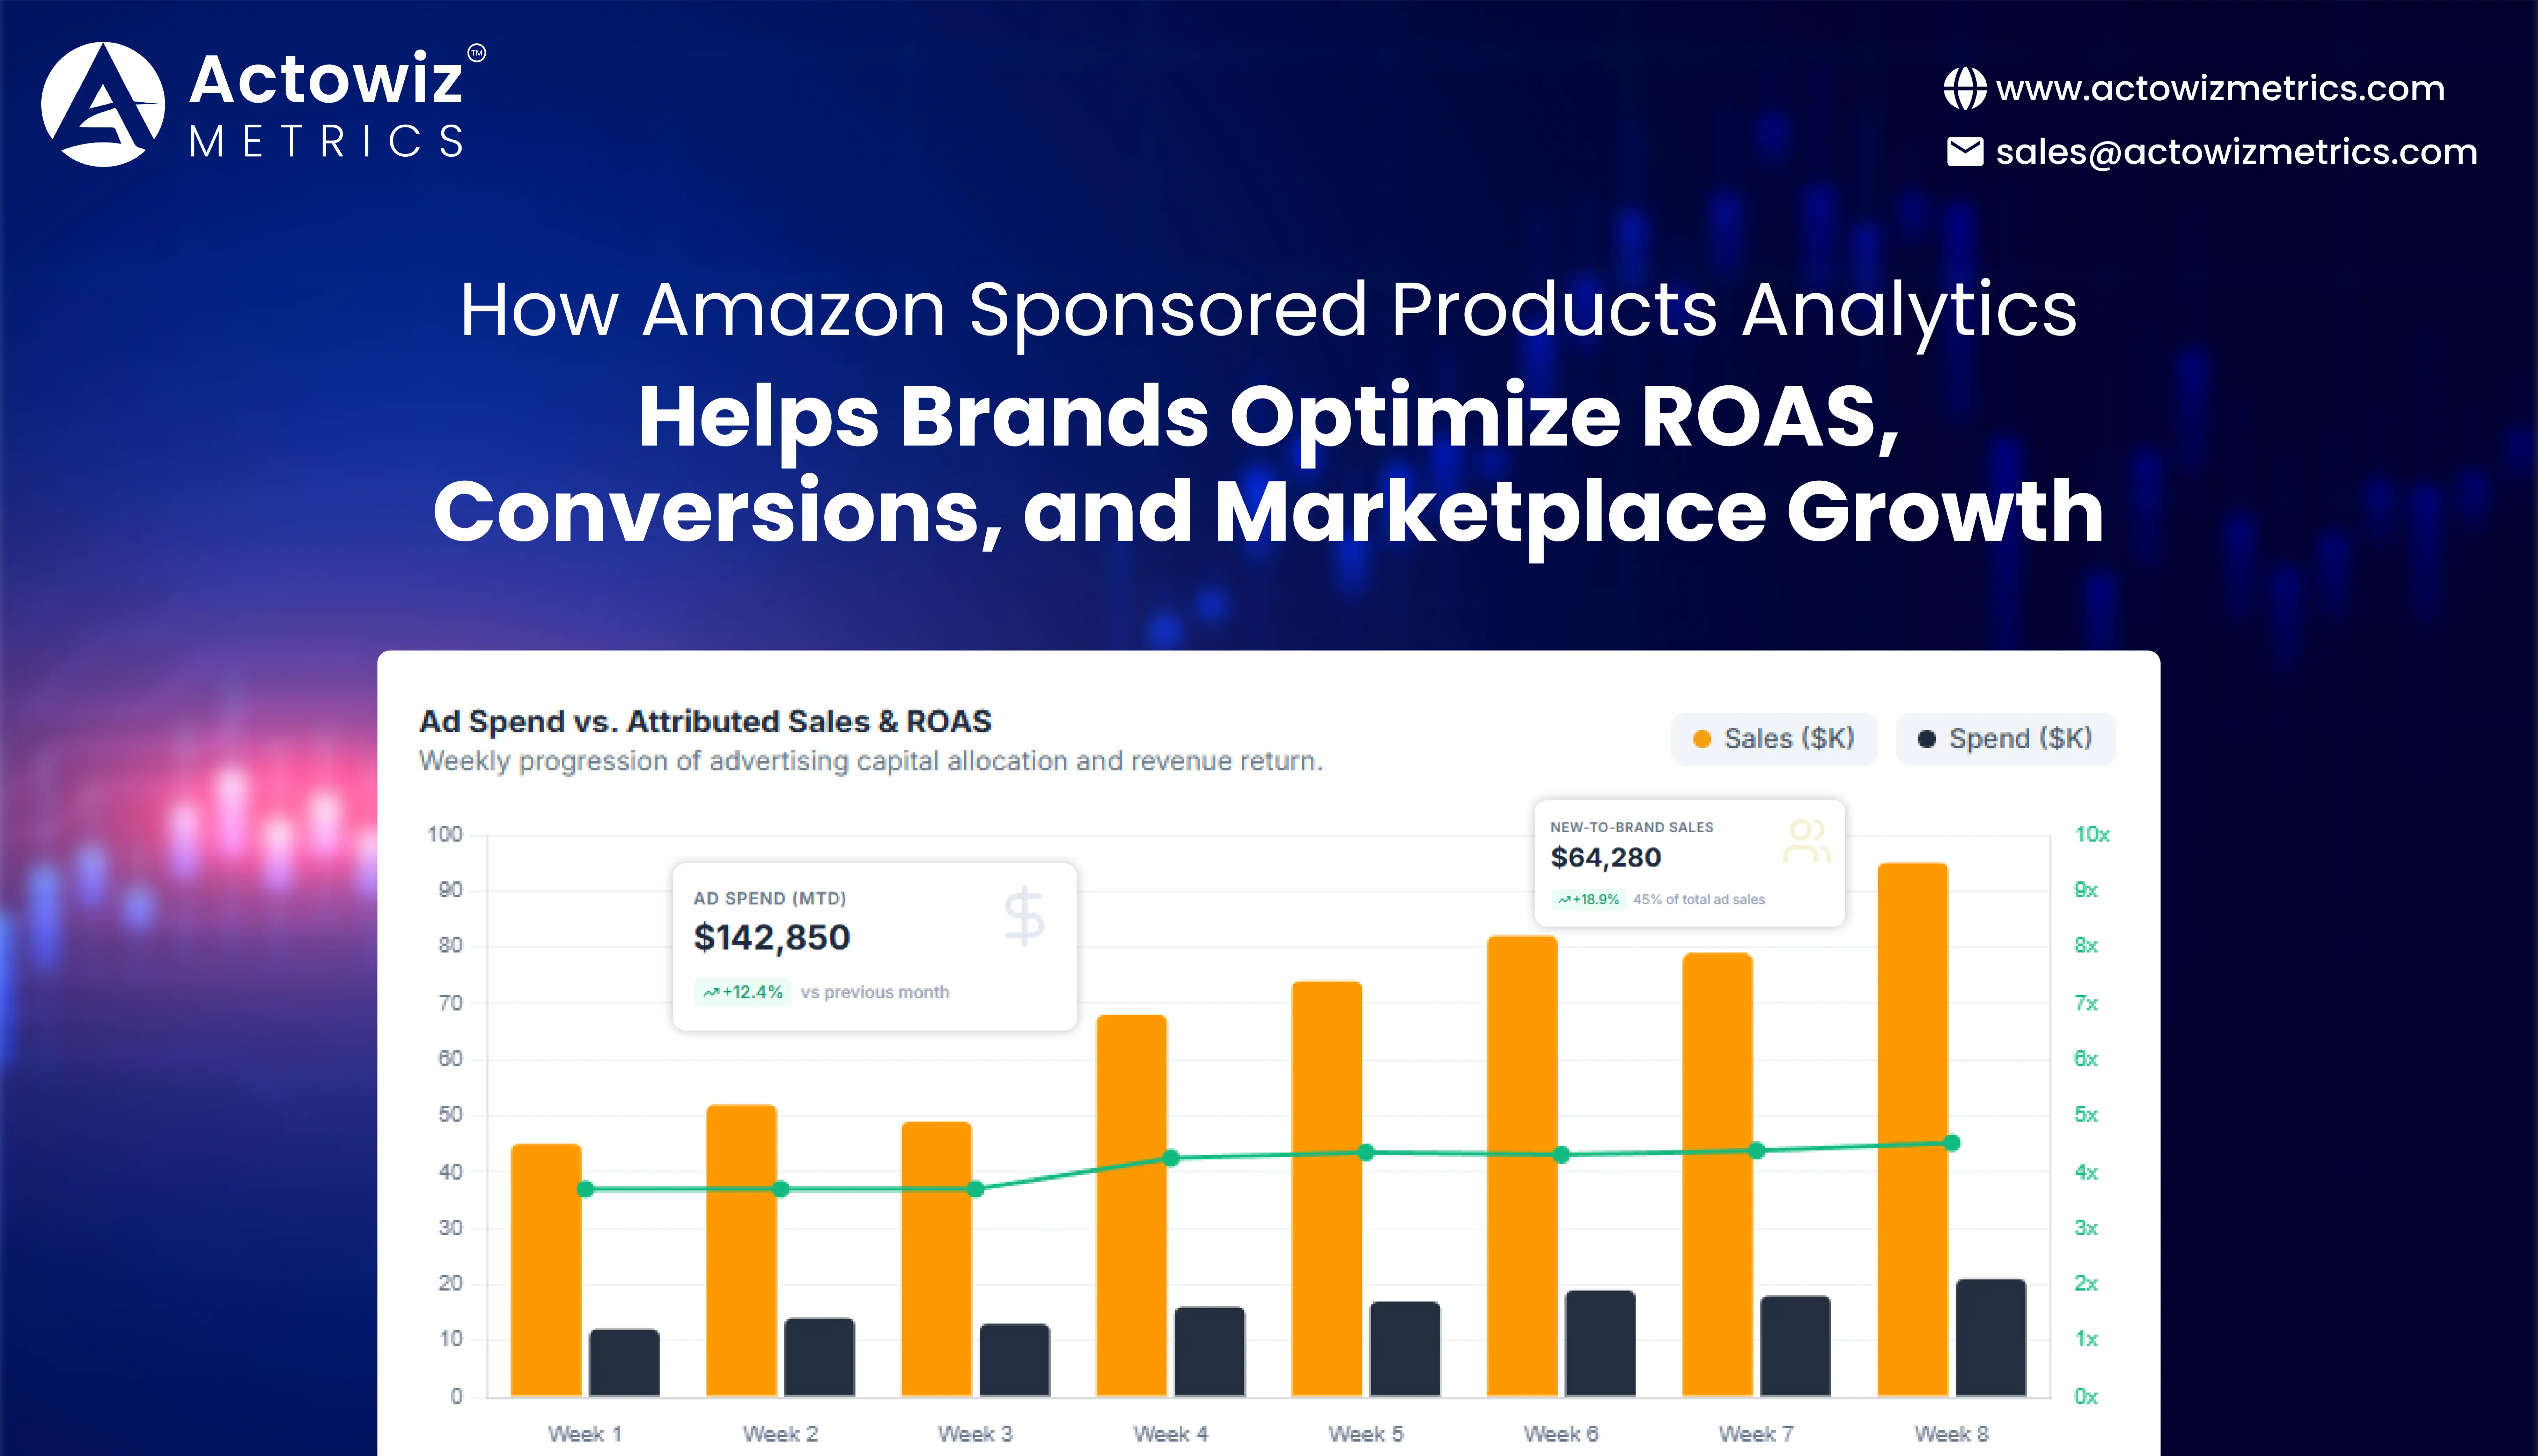
Amazon has evolved from an online marketplace into a major retail media environment where product discovery, advertising, pricing, reviews, promotions, and conversion increasingly interact. For brands, this creates an opportunity to reach shoppers close to the point of purchase—but it also creates a measurement challenge. A campaign can generate impressions and clicks while still underperforming on profitability, conversion rate, or incremental growth.
Amazon Sponsored Products Analytics helps brands move beyond basic campaign reporting by connecting advertising spend with search behavior, product visibility, keyword performance, placement, sales, and competitive signals. Sponsored Products operate on a cost-per-click model and can appear in shopping results and on product pages, allowing advertisers to promote individual products when shoppers are actively browsing or searching.
The scale of the opportunity is significant. Amazon Ads reports that advertisers using Sponsored Products saw, on average, 34% more sales growth compared with advertisers that did not use Sponsored Products, four weeks after adoption. Amazon also reports that sellers who continuously ran Sponsored Products campaigns for 12 months saw an average 11.2% higher ROAS compared with their first month. These are Amazon-reported aggregate results, not guaranteed outcomes for individual brands.
For businesses managing hundreds or thousands of ASINs, however, the challenge is not simply launching campaigns. The real challenge is understanding why performance changes and identifying which products, keywords, placements, prices, promotions, and competitors are contributing to those changes.
That is where Retail Media & Ad Intelligence becomes valuable. By combining advertising metrics with marketplace and digital shelf signals, brands can build a more complete picture of advertising efficiency and marketplace growth.
Advertising teams often monitor impressions, clicks, CPC, spend, attributed sales, ACOS, ROAS, and conversion rate. These metrics are important individually, but they become more useful when analyzed together.
Amazon Sponsored Products Monitoring enables brands to continuously evaluate how campaigns perform across ASINs, campaigns, targeting types, search terms, placements, categories, and time periods. Instead of looking at monthly totals alone, brands can identify performance changes at the product and keyword level.
For example, suppose a campaign's sales increase by 20% while spend increases by 45%. The headline growth figure appears positive, but ROAS has deteriorated. A deeper analysis may reveal that the additional spending is concentrated on broad-match keywords or lower-converting ASINs.
Amazon's reporting ecosystem supports campaign, placement, product, search-term, and impression-share analysis. Its search term impression-share report, introduced for Sponsored Products, allows advertisers to compare their percentage of Sponsored Products impressions for individual search terms with other advertisers.
| Metric | What it measures | Analytical question |
|---|---|---|
| Impressions | Ad exposure | Are priority products visible? |
| CTR | Shopper engagement | Do placements attract attention? |
| CPC | Cost per click | Is auction pressure increasing? |
| Conversion rate | Click-to-purchase efficiency | Are shoppers converting? |
| ACOS | Ad spend relative to attributed sales | Is advertising cost controlled? |
| ROAS | Revenue generated per advertising dollar | Is investment producing efficient revenue? |
| NTB sales | New-to-brand sales | Is advertising acquiring new shoppers? |
| Impression share | Visibility against other advertisers | Are competitors taking more search exposure? |
Real-world examples illustrate the potential impact of disciplined optimization. Amazon Ads reports that Juna, a wellness brand, achieved 300% sales growth and a 5.5 ROAS after developing its Sponsored Products strategy. The company expanded campaigns from one successful product to additional products and used campaign data to refine keywords and targeting.
The analytical lesson is not that every brand should expect a 5.5 ROAS. Instead, Juna's case demonstrates how product-level performance data can guide campaign expansion.
Brands can establish thresholds for identifying underperforming campaigns, such as:
This turns advertising reporting into a decision system rather than a historical scorecard.
Amazon is a highly competitive marketplace. Multiple brands can target the same shopper intent, promote comparable products, and compete for the same search visibility.
Amazon Sponsored Ads Competitor Analysis helps brands understand this competitive environment by examining competitor advertising presence, search-term impression share, product positioning, pricing, promotions, reviews, ratings, and assortment.
Amazon's search-term impression-share reporting provides a direct way for advertisers to understand how much of the available Sponsored Products impression opportunity they capture for specific search terms. A 20% impression share, for example, means the advertiser received 20% of Sponsored Products ad impressions for that search term during the selected period.
| Signal | Brand observation | Competitive implication |
|---|---|---|
| Impression share | Brand captures 18% | Competitors capture remaining opportunity |
| Search rank | Competitor repeatedly appears | Competitor may have stronger relevance/bid combination |
| CPC | CPC rises 25% | Auction pressure may be increasing |
| Competitor price | Competitor sells 8% cheaper | Conversion pressure may increase |
| Reviews | Competitor has substantially more reviews | Trust advantage may influence conversion |
| Promotion | Competitor activates coupons | Temporary conversion advantage |
| Availability | Competitor remains in stock | Higher ability to convert traffic |
Competitor analysis becomes particularly important during major retail events. Prime Day, Black Friday, Cyber Monday, seasonal holidays, and category-specific promotional periods can create sudden changes in search volume and advertising competition.
A real example comes from Lavazza. Amazon Ads reported that an analytics-driven Prime Day strategy helped the brand achieve a 136% increase in ad revenue, a 28% improvement in ROAS, and 104% growth in new-to-brand orders compared with the previous Prime Day. The strategy used hourly retail analytics to understand product velocity, price, stock, and conversion patterns and then adjust bids and budgets around peak shopping periods.
For competitors, the analytical question becomes: Did performance improve because demand increased across the category, or because the brand captured a larger portion of that demand? That distinction matters when measuring sustainable marketplace growth.
Product visibility is one of the most important links between advertising and conversion. A product cannot generate a click if shoppers do not see it, but visibility alone does not guarantee sales.
Amazon Sponsored Placement Visibility Tracking enables brands to monitor where promoted products appear and how those placements perform over time. This is particularly important because top-of-search visibility can behave differently from other placements.
Amazon Sponsored Products Analytics can connect placement-level visibility with CTR, conversion, CPC, sales, and ROAS to determine whether premium visibility is translating into commercial results.
| Placement dimension | Metrics to monitor | Business use |
|---|---|---|
| Top of search | Impressions, CTR, CVR, ROAS | Measure premium search visibility |
| Other search | CTR, CPC, conversion | Compare broader search efficiency |
| Product pages | Clicks, sales, CPC | Evaluate cross-product discovery |
| Device | Mobile vs. desktop performance | Identify shopper behavior differences |
| Category | Placement and conversion | Find category-specific opportunities |
| Time | Hour/day/week | Detect demand patterns |
Amazon's reporting capabilities have become increasingly sophisticated. In 2025, Amazon Ads introduced unified reporting that standardizes metrics and dimensions across advertising products and allows advertisers to analyze daily or weekly data for up to 15 months and monthly, yearly, or summary-level data for up to six years.
This longer historical window has important implications for marketplace analytics. Brands can compare current campaign performance with prior years, seasonal peaks, promotional periods, and category trends.
For example, a 30% decline in conversion during November should not automatically trigger a campaign reduction. If the same product historically experiences a temporary November conversion decline because of category-level competition, the appropriate response may differ.
Historical placement data can therefore help separate:
This distinction is essential when brands make decisions about budgets and bids.
Advertising does not operate independently from price. A product receiving strong advertising visibility can still struggle if its price is significantly higher than comparable products.
Amazon Competitor Price and Promotion Monitoring helps brands connect advertising performance with marketplace pricing conditions.
Suppose a product has:
A potential explanation could be price rather than advertising.
Similarly, if a competitor activates a coupon and the brand's conversion rate falls shortly afterward, advertising data alone may not reveal the cause.
| Advertising signal | Marketplace signal | Potential interpretation |
|---|---|---|
| High impressions | Price above category median | Visibility but weak value perception |
| High CTR | Low conversion | Investigate price, content, reviews, availability |
| Rising CPC | Competitor promotion | Increased competitive pressure |
| Falling sales | Competitor discount | Potential demand diversion |
| Higher conversion | Coupon active | Promotion may be supporting ad efficiency |
| High ROAS | Low stock | Growth may be constrained by availability |
Amazon's own guidance highlights the relationship between promotions and advertising. Amazon reports that products with deals or coupons that were advertised with Sponsored Products saw an average 65% increase in sales and 75% increase in units sold compared with periods when the deal or coupon product was not advertised.
Again, this is an Amazon-reported aggregate result and should not be treated as a guaranteed lift.
For brands, the more useful approach is to analyze price and advertising simultaneously. A dataset can track:
This allows analysts to investigate whether advertising efficiency changes when a product moves from full price to promotional price.
For example, a campaign with 4x ROAS during a promotion and 2x ROAS at full price tells a different story from a campaign that maintains 4x ROAS regardless of price. The first may be highly promotion-dependent; the second may have stronger underlying demand.
Search terms represent shopper intent. They show what consumers are looking for and provide brands with information about how products are discovered.
Amazon Sponsored Keyword Intelligence allows brands to analyze search terms, match types, impressions, clicks, CPC, conversions, attributed sales, and impression share to identify opportunities for optimization.
Amazon's reporting infrastructure provides search-term-level visibility, while its impression-share report enables advertisers to compare their share of Sponsored Products impressions with other advertisers.
| Keyword condition | Recommended analytical interpretation |
|---|---|
| High impressions + high conversion | Core growth keyword |
| High impressions + low conversion | Relevance/listing issue |
| Low impressions + high conversion | Visibility opportunity |
| High CPC + low conversion | Efficiency concern |
| Rising impressions + rising conversion | Emerging demand |
| Falling impressions + stable conversion | Competitive visibility loss |
| High sales + declining impression share | Competitor pressure |
The keyword layer can also be connected with product-level data.
Imagine a brand selling 100 ASINs across five categories. Instead of optimizing every keyword equally, analysts can prioritize:
This creates a prioritization framework for advertising teams.
A 2026 Amazon Ads case study involving Lamicall provides an example of how detailed analytics can support optimization. Amazon reported that its Germany portfolio achieved a 65.3% increase in ad-attributed sales within 28 days and a 33.6% ROAS uplift after using lifecycle-based intelligence to optimize bids, budgets, keywords, and retail-readiness signals. Analysis and optimization time reportedly fell by 90%.
The case demonstrates an important principle: keyword optimization becomes more powerful when it is connected with product lifecycle, retail readiness, and ASIN-level performance rather than treated as a standalone task.
Retail media performance should not be evaluated using ROAS alone. A product can have strong immediate ROAS while contributing little to new customer acquisition, while another campaign may produce lower short-term ROAS but significantly expand brand discovery.
Amazon Retail Media Performance Analytics provides a framework for evaluating advertising across awareness, consideration, conversion, new-to-brand acquisition, and repeat purchase behavior.
| Funnel stage | Key metrics | Strategic purpose |
|---|---|---|
| Awareness | Impressions, reach | Build product/brand visibility |
| Discovery | CTR, search engagement | Generate product interest |
| Consideration | Detail-page views, branded searches | Strengthen evaluation |
| Conversion | Orders, CVR, ROAS | Generate sales |
| Acquisition | NTB sales/orders | Reach new customers |
| Retention | Repeat purchase | Support long-term value |
Amazon case studies show how multiple advertising formats can influence the customer journey. In one Aveeno Baby campaign in India, Amazon reported a 6x increase in the brand's browser base, a 22% increase in branded searches, and an 8x increase in conversion rates among customers exposed to multiple ad formats compared with customers exposed to a single ad format. The results were campaign-specific and based on Amazon/internal and third-party measurement.
Another example is L'Oreal Professionnel's 2024 campaign on Amazon.ae. Amazon reported 8.1 ROAS for sponsored ads during the product campaign, while a launch-day homepage takeover generated 32.13 ROAS and a 63% increase in daily sell-out versus the pre-activation period.
These examples demonstrate why brands should analyze advertising as a connected ecosystem rather than judging every campaign against a single ROAS target.
From 2020 through 2026, Amazon advertising moved toward increasingly granular measurement, automation, and cross-channel analysis. During the early 2020s, brands increasingly treated marketplace advertising as a direct sales channel rather than only a promotional tool. Amazon's Sponsored Products ecosystem expanded its reporting capabilities, including search-term and impression-share measurement; in 2021, Amazon introduced search-term impression-share reporting so advertisers could compare their Sponsored Products impression share against other advertisers.
Amazon subsequently expanded analytics, automation, APIs, and measurement capabilities around its advertising ecosystem. By 2024, Amazon Ads case studies were increasingly emphasizing ROAS, new-to-brand sales, incremental growth, and full-funnel measurement. For example, Juna reported 300% sales growth and 5.5 ROAS after scaling its Sponsored Products strategy, while HP reported an 80% year-over-year increase in revenue associated with a Sponsored Brands video campaign and a 60% increase in units sold.
In 2025, Amazon introduced unified reporting that standardized metrics and enabled advertisers to work with up to six years of monthly, yearly, or summary-level data. By 2026, Amazon Ads case studies increasingly showed AI-assisted optimization and real-time retail analytics being connected with Sponsored Products. The Lamicall case reported a 33.6% ROAS uplift and 90% reduction in optimization time, while the Gala case reported 200% sales growth and a 37% ROAS improvement through AI-powered analytics and Amazon Ads solutions.
The broader evolution is from campaign reporting toward continuous marketplace intelligence, where advertising data is interpreted alongside search, pricing, availability, competitive activity, and product-level performance.
Actowiz Metrics can help brands transform fragmented marketplace signals into structured datasets and analytical dashboards that support advertising and digital commerce decisions.
Share of Search can be evaluated alongside Amazon Sponsored Products Analytics to understand whether advertising investment is translating into greater visibility for strategically important search terms.
A comprehensive analytics framework can combine:
| Stage | Actowiz Metrics capability | Business output |
|---|---|---|
| Data collection | Product and advertising data extraction | Centralized marketplace dataset |
| Data normalization | SKU/ASIN standardization | Consistent product records |
| Competitive monitoring | Price and placement tracking | Competitive benchmark |
| Keyword analysis | Search and advertising signals | Keyword opportunity map |
| Historical storage | Daily/weekly/monthly datasets | Trend analysis |
| Validation | Data quality checks | Reliable reporting |
| Analytics | KPI calculations and segmentation | Performance insights |
| Dashboarding | Interactive reporting | Faster decisions |
For a large FMCG, electronics, beauty, or home-products portfolio, this approach can reduce the need to manually compare individual campaigns and competitor listings.
For example, Actowiz Metrics can help build an analytical dataset where each ASIN is associated with:
ASIN → Product → Category → Keyword → Placement → Competitor → Price → Promotion → Availability → Advertising Metric → Sales Trend
This structure makes it easier to identify relationships that conventional advertising dashboards may not show.
A brand could use the resulting intelligence to identify products with high conversion but low visibility, competitors gaining impression share, categories experiencing CPC inflation, or products where promotions are materially changing advertising efficiency.
The objective is not simply to collect more marketplace data. It is to establish a repeatable intelligence layer that allows advertising, ecommerce, sales, and category teams to work from consistent evidence.
Amazon's advertising ecosystem has become increasingly measurable, but the growing volume of data also makes performance analysis more complex. Brands need to understand not only how much they spend, but where that spend generates visibility, which keywords produce conversions, how competitors affect auction dynamics, and how pricing and promotions influence the final purchase decision.
Digital Shelf Analytics provides the broader framework for connecting advertising performance with product-level marketplace conditions. When advertising metrics are analyzed alongside price, promotion, availability, competitor visibility, search demand, and product content, brands can identify the commercial factors behind changes in ROAS and conversion.
Amazon Sponsored Products Analytics therefore becomes most valuable when treated as part of a wider marketplace intelligence system. Instead of relying on isolated campaign reports, brands can build historical benchmarks, detect competitive changes, identify emerging search opportunities, and understand which products deserve additional investment.
Amazon's reported examples demonstrate the potential of data-driven optimization: Juna achieved 300% sales growth with a reported 5.5 ROAS, Lavazza reported 136% ad-revenue growth during Prime Day alongside a 28% ROAS improvement, and Lamicall reported a 33.6% ROAS uplift using lifecycle-based intelligence. These are individual case-study results, so they should be viewed as examples rather than benchmarks that every advertiser should expect.
The strategic opportunity for brands is to connect advertising intelligence with the wider marketplace environment. By doing so, advertising teams can better understand the relationship between investment, visibility, shopper intent, competitive pressure, and sales performance.
Want to turn Amazon marketplace and advertising data into actionable growth intelligence? Connect with Actowiz Metrics to build a customized analytics solution for your brand!
Expert blogs, research reports and infographics — practical, data-driven reading across e-commerce and quick-commerce.
Most fields are optional — the more you share, the better your sample.
.webp "infographics")
.webp "infographics")