BLOG




















India's quick-commerce market has evolved from a convenience-led urban service into a major retail channel, with pricing increasingly influenced by location, inventory availability, demand density, promotions, fulfilment costs, and competitive intensity. As platforms expand their dark-store networks across metros, Tier 1 cities, and emerging markets, the same SKU may not necessarily carry identical pricing, discounts, or availability across every serviceable area.
The Pincode Price Variance in Indian Quick Commerce has therefore become an important research area for brands, retailers, marketplaces, and consumer-goods companies. Pincode-level monitoring can reveal how prices shift between neighbouring locations and how local market conditions influence the final consumer proposition.
The scale of the channel makes this increasingly important. Redseer reported that India's quick-commerce market exceeded $10 billion in GMV in 2025, with more than 30 million monthly users, while metro markets continued to account for more than 80% of GMV. Bain and Flipkart data reported by Reuters also found that quick commerce represented more than two-thirds of India's e-grocery orders in 2024.
For brands, Price & promotion intelligence can turn these location-level signals into actionable insights. Comparing prices across pincodes can help identify regional pricing gaps, promotional differences, assortment variations, and competitive opportunities.
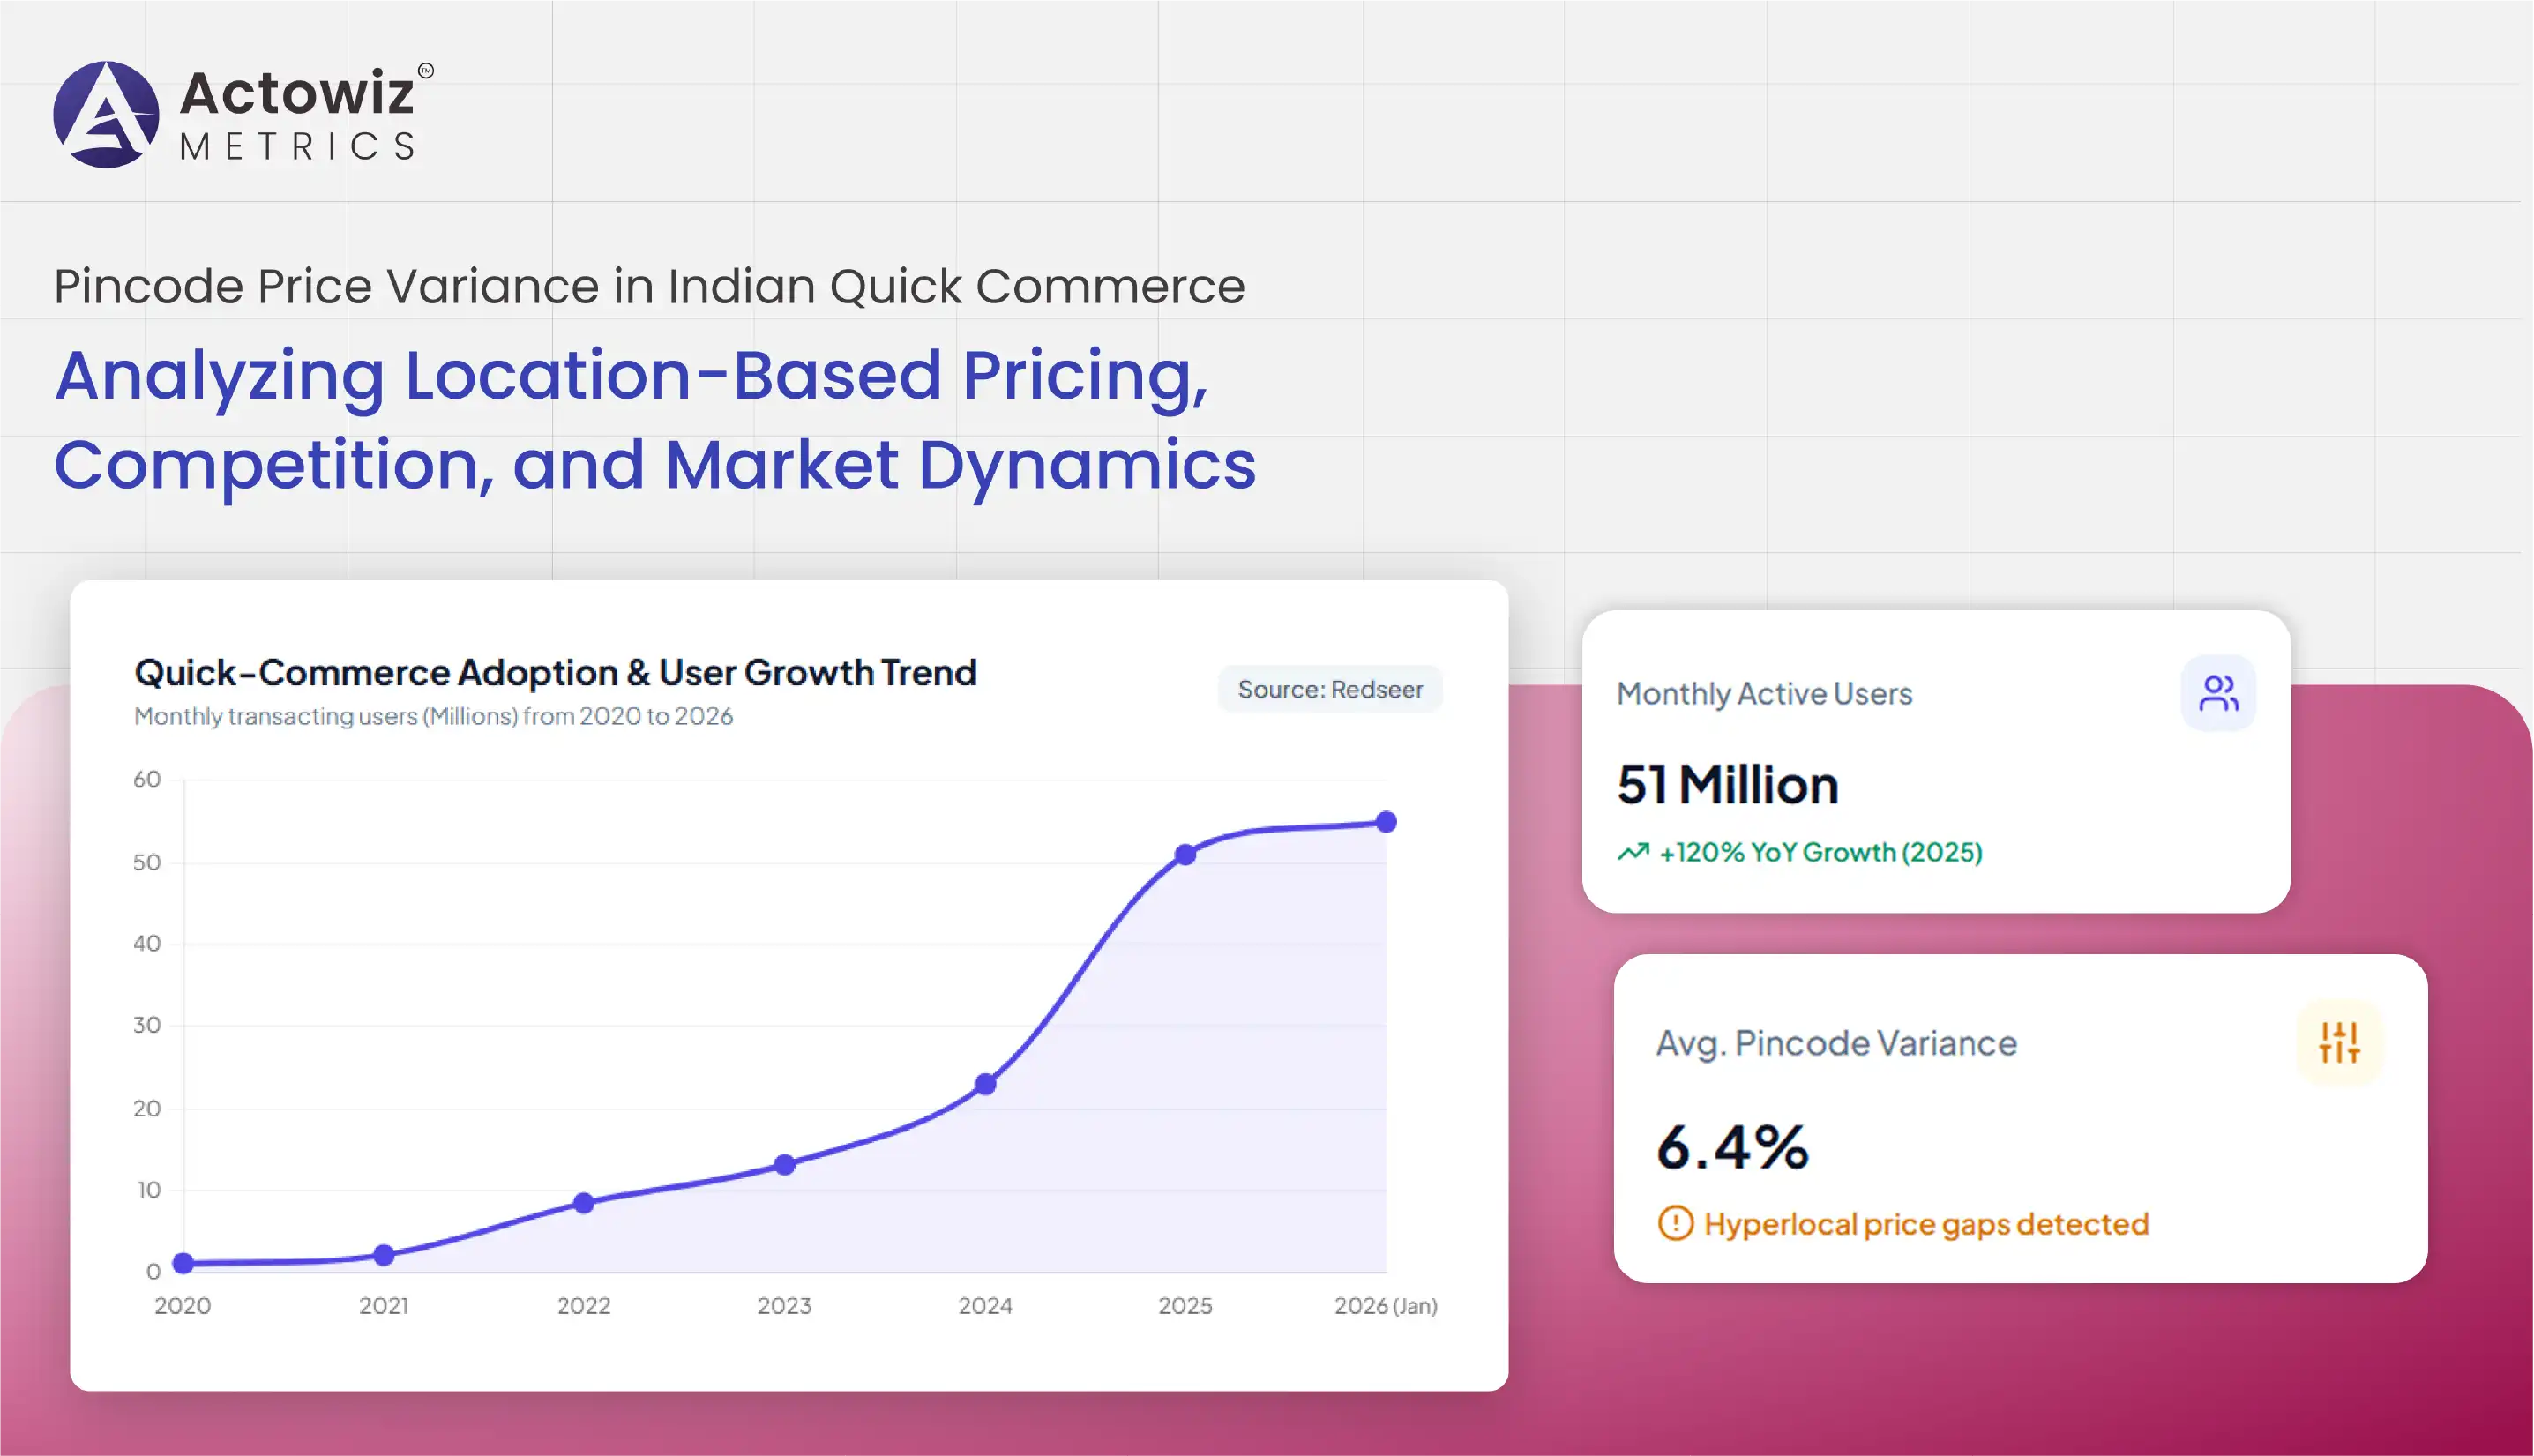
The rapid expansion of quick commerce has made geographic pricing analysis substantially more important. Between 2020 and 2021, the category was concentrated largely in major metropolitan markets. As adoption accelerated during 2022–2023, platforms expanded dark-store coverage and increased SKU breadth. By 2024–2025, quick commerce had moved into a much broader set of cities.
Redseer reported that monthly transacting users increased from 2.2 million in CY2021 to 23 million in CY2024 and 51 million in CY2025. This expansion means pricing decisions increasingly need to account for local demand and operating economics.
The Multi-City Quick Commerce Pincode Price Analysis India approach enables companies to compare identical SKUs across multiple cities and serviceable pincodes. Rather than looking only at national average prices, businesses can examine whether a product is priced differently in Mumbai, Bengaluru, Delhi, Ahmedabad, Hyderabad, Pune, or smaller markets.
| Year | Key Indicator |
|---|---|
| 2020 | Early-stage quick-commerce adoption |
| 2021 | 2.2M monthly transacting users |
| 2022 | 8.5M monthly transacting users |
| 2023 | 13.2M monthly transacting users |
| 2024 | 23.0M monthly transacting users |
| 2025 | 51.0M monthly transacting users |
| 2026 | ~₹11,000 crore GMV in January |
Sources: Redseer Research and Analysis.
Pincode-level analysis becomes particularly useful when companies want to distinguish national pricing strategy from localized commercial decisions. A ₹10–₹20 difference may appear insignificant at SKU level, but repeated across hundreds of products and thousands of locations, it can materially affect revenue, promotion effectiveness, and consumer perception.
Quick-commerce pricing is rarely determined by a single factor. Local demand, inventory position, competitor pricing, promotional budgets, delivery economics, assortment strategy, and store-level performance can all influence the consumer-facing price.
During 2020–2022, geographic differences were primarily connected to market availability and the limited reach of quick-commerce networks. By 2023–2024, greater platform competition created stronger incentives to optimize pricing and promotions. In 2025–2026, the expansion into non-metro markets introduced another layer of complexity.
Redseer reported that quick commerce grew approximately 150% year-on-year during the first five months of 2025, while leading platforms expanded to more than 100 cities. However, non-metro cities outside the eight major metros contributed just over 20% of GMV.
| Metric | Reported Figure |
|---|---|
| Q-commerce growth, first 5 months of 2025 | ~150% YoY |
| Cities covered by leading platforms | 100+ |
| Non-metro cities represented | 90+ |
| Non-metro share of GMV | 20%+ |
| Metro share of GMV | 80%+ |
This environment makes Quick commerce price variance by location an important competitive metric. Businesses can use location-level observations to determine whether price gaps are caused by promotional intensity, inventory differences, competitive matching, or localized demand.
For example, if a detergent SKU sells at ₹199 in one pincode and ₹189 in another, the difference may reflect a temporary promotion. If the same gap persists for several weeks, it may indicate a structural pricing decision. Repeated observations allow analysts to distinguish temporary discounts from consistent regional pricing strategies.
National-level price comparisons can hide substantial differences between cities. A product may appear competitively priced when evaluated against a national average while being significantly more expensive or cheaper within a particular local market.
Between 2020 and 2023, India's quick-commerce ecosystem was heavily metro-centric. Redseer reported that metro cities represented approximately 90% of the quick-commerce pie in FY24. By 2025 and 2026, expansion into non-metro markets had become a major growth theme.
The City-wise quick commerce price comparison model can therefore provide a more granular view of market competitiveness. Businesses can compare SKU-level prices across cities and then drill down to individual pincodes.
| Period | Market Development |
|---|---|
| 2020 | Early hyperlocal adoption |
| 2021 | Rapid consumer experimentation |
| 2022 | Expansion of dark-store networks |
| 2023 | Increasing category and SKU breadth |
| 2024 | Strong metro penetration |
| 2025 | 150+ city reach reported |
| 2026 | Accelerating non-metro expansion |
Redseer reported in late 2025 that quick commerce had reached 33 million monthly users across more than 150 cities. By January 2026, Redseer reported approximately ₹11,000 crore in monthly GMV and around 95% year-on-year order-volume growth.
City comparisons can reveal several commercial patterns. A brand may have strong price competitiveness in one city but weaker positioning in another. Promotions may be aggressive in high-competition locations but less frequent in markets with fewer alternatives. Likewise, premium SKUs may receive stronger discounts in affluent urban markets while value products dominate smaller locations.
This makes city-level comparison useful for pricing teams seeking to understand where their products are winning, losing, or experiencing unexplained price movements.
The value of pincode-level analysis depends heavily on the quality and frequency of the underlying data. Grocery prices can change quickly because quick-commerce platforms continuously adjust promotions, inventory, and local offers.
From 2020 to 2022, businesses commonly relied on manual checks or limited market observations. As quick commerce expanded in 2023–2024, manual monitoring became increasingly difficult because the number of locations, SKUs, and competing platforms grew simultaneously. By 2025–2026, automated collection became more practical for large-scale monitoring.
Pincode-level grocery pricing data Scraping can capture publicly visible product information such as product name, SKU, listed price, discounted price, MRP, promotion, availability, seller, location, and timestamp, subject to applicable website terms and legal requirements.
| Period | Typical Monitoring Approach |
|---|---|
| 2020 | Manual price checks |
| 2021 | Spreadsheet-based tracking |
| 2022 | Scheduled collection |
| 2023 | Automated SKU monitoring |
| 2024 | Multi-platform tracking |
| 2025 | Pincode-level intelligence |
| 2026 | Continuous competitive monitoring |
A structured dataset can create a historical record of price movements. This makes it possible to calculate average prices, minimum and maximum prices, price gaps, discount frequency, promotion duration, and location-specific trends.
For FMCG brands, such intelligence can also reveal whether promotions are concentrated in particular markets. A product receiving frequent discounts in one region may require different trade or promotional planning than an identical SKU that maintains a stable price elsewhere.
The crucial requirement is consistency. Product identifiers must be standardized, locations accurately mapped, timestamps retained, and price observations separated from temporary promotional effects.
As the number of tracked pincodes and SKUs increases, manual analysis becomes inefficient. API-based delivery provides a mechanism for moving structured pricing and availability information into dashboards, databases, business-intelligence systems, and analytical workflows.
The Quick Commerce Price Monitoring API model can support recurring delivery of structured observations across selected platforms, products, and locations. Instead of analysts repeatedly visiting individual applications, data can be organized into machine-readable records.
| Component | Example Output |
|---|---|
| Product identification | SKU, brand, category |
| Location | City, pincode, service area |
| Pricing | MRP, selling price, discount |
| Promotion | Offer type, discount value |
| Availability | In stock/out of stock |
| Timestamp | Collection date and time |
| Competitive view | Platform-level comparison |
This becomes particularly valuable as the quick-commerce market grows. PayNXT360 estimates India's quick-commerce market reached approximately $6.78 billion in 2025 and projects growth from $5.48 billion in 2024 to about $12.97 billion by 2029.
API delivery can also support alert-based workflows. For example, a business can establish thresholds for unusually large price movements. When a tracked SKU moves beyond the threshold, an automated process can flag the change for review.
The result is a transition from static research toward continuous market intelligence. Pricing teams can monitor competitors, merchandising teams can identify assortment gaps, and category managers can evaluate promotion performance without waiting for a manually prepared report.
Quick-commerce expansion has created a large and increasingly complex dataset of products, prices, promotions, availability, and locations. The commercial opportunity is no longer simply to observe this information but to convert it into decisions.
The Quick-commerce analytics, Pincode Price Variance in Indian Quick Commerce framework combines location intelligence with SKU-level monitoring to identify patterns that may not be visible through national averages.
Redseer reported that India's quick-commerce GMV reached approximately $10 billion+ in 2025, with more than 30 million monthly users and more than 80% of GMV coming from metros. Meanwhile, 2026 research shows that non-metro daily orders increased 328% year-on-year, illustrating how quickly the geographic structure of demand is changing.
| Metric | Business Application |
|---|---|
| Average pincode price | Local pricing benchmark |
| Price variance | Detect regional gaps |
| Discount frequency | Promotion analysis |
| MRP-to-selling-price gap | Discount monitoring |
| Out-of-stock frequency | Availability benchmarking |
| Competitor price gap | Competitive positioning |
| Price volatility | Market stability analysis |
| City-level variance | Regional strategy |
A brand could discover that its product is consistently priced above competitors in one cluster of pincodes but below them in another. Such a pattern can support more targeted commercial planning.
Location-level analytics can also support demand forecasting. If price reductions repeatedly coincide with inventory build-up in certain markets, the relationship may indicate local demand sensitivity. Conversely, stable premium pricing in high-demand locations may signal stronger willingness to pay.
The strategic objective is therefore to connect price, promotion, inventory, competition, and geography into one analytical framework. As quick commerce becomes increasingly important to Indian retail, this level of granularity can help brands make faster and more localized decisions.
Actowiz Metrics can help businesses transform fragmented quick-commerce information into structured competitive intelligence. The objective is not simply to collect prices but to create usable datasets that support pricing, promotion, assortment, availability, and market analysis.
Digital shelf analytics can provide a broader perspective by connecting product visibility, pricing, promotional execution, availability, and competitive positioning across digital retail channels.
For organizations studying Pincode Price Variance in Indian Quick Commerce, a structured monitoring framework can combine product-level observations with city and pincode information. This allows businesses to identify local price gaps, promotional differences, competitor movements, and recurring market patterns.
Actowiz Metrics can support automated data collection, normalization, historical tracking, and structured delivery for retail intelligence initiatives. This approach enables brands and retailers to move beyond occasional price checks toward scalable market monitoring.
As India's quick-commerce ecosystem expands beyond its traditional metro concentration, the ability to understand local pricing becomes increasingly important. Businesses that can identify where prices differ, why those differences occur, and how competitors respond can make more informed decisions around pricing and promotion.
India's quick-commerce sector has progressed rapidly from an emerging convenience format in 2020 to a major component of the country's digital retail ecosystem in 2026. The expansion of users, dark stores, categories, cities, and SKUs has made location increasingly important to competitive analysis.
The Pincode Price Variance in Indian Quick Commerce is not simply a measurement of price differences. It is a window into regional demand, competitive intensity, promotion strategy, inventory conditions, and localized retail economics. As quick commerce expands into more non-metro markets, these differences are likely to become increasingly important for brands and retailers.
Pincode-level monitoring can help organizations understand how products are positioned across markets, identify unusual pricing movements, measure promotion intensity, and benchmark competitors. When connected through automated data pipelines and APIs, these insights can become part of continuous pricing and competitive-intelligence workflows.
The next stage of Indian quick commerce will depend not only on faster delivery but also on smarter localization. Companies that understand how pricing and availability behave at the city and pincode level can respond more effectively to changing consumer demand and competitive conditions.
Want to uncover location-level pricing gaps and competitive opportunities? Partner with Actowiz Metrics to build scalable quick-commerce data intelligence for smarter pricing, promotion, assortment, and market decisions!
Expert blogs, research reports and infographics — practical, data-driven reading across e-commerce and quick-commerce.
Most fields are optional — the more you share, the better your sample.

.webp "infographics")
.webp "infographics")