BLOG


Retailers can monitor Target's pricing strategies by comparing advertised prices, product assortments, promotions, availability, and digital shelf visibility across relevant products and locations. Target Competitor Analysis turns these observations into structured evidence that helps brands, retailers, and consumer packaged goods (CPG) teams evaluate their market position and make informed commercial decisions.
For businesses selling through Target, Target Marketplace Data can provide useful context for understanding product listings, displayed prices, promotional messaging, and assortment changes where this information is publicly available or accessible through authorized sources. The objective is to identify meaningful differences—not simply collect large volumes of retail data.
For example, a brand may need to know whether its product is priced competitively, whether competing products offer different sizes, whether an advertised discount is limited to a particular promotion, or whether an item is listed but unavailable to shoppers in a given market. These questions require consistent product matching, location-aware observations, and historical records.
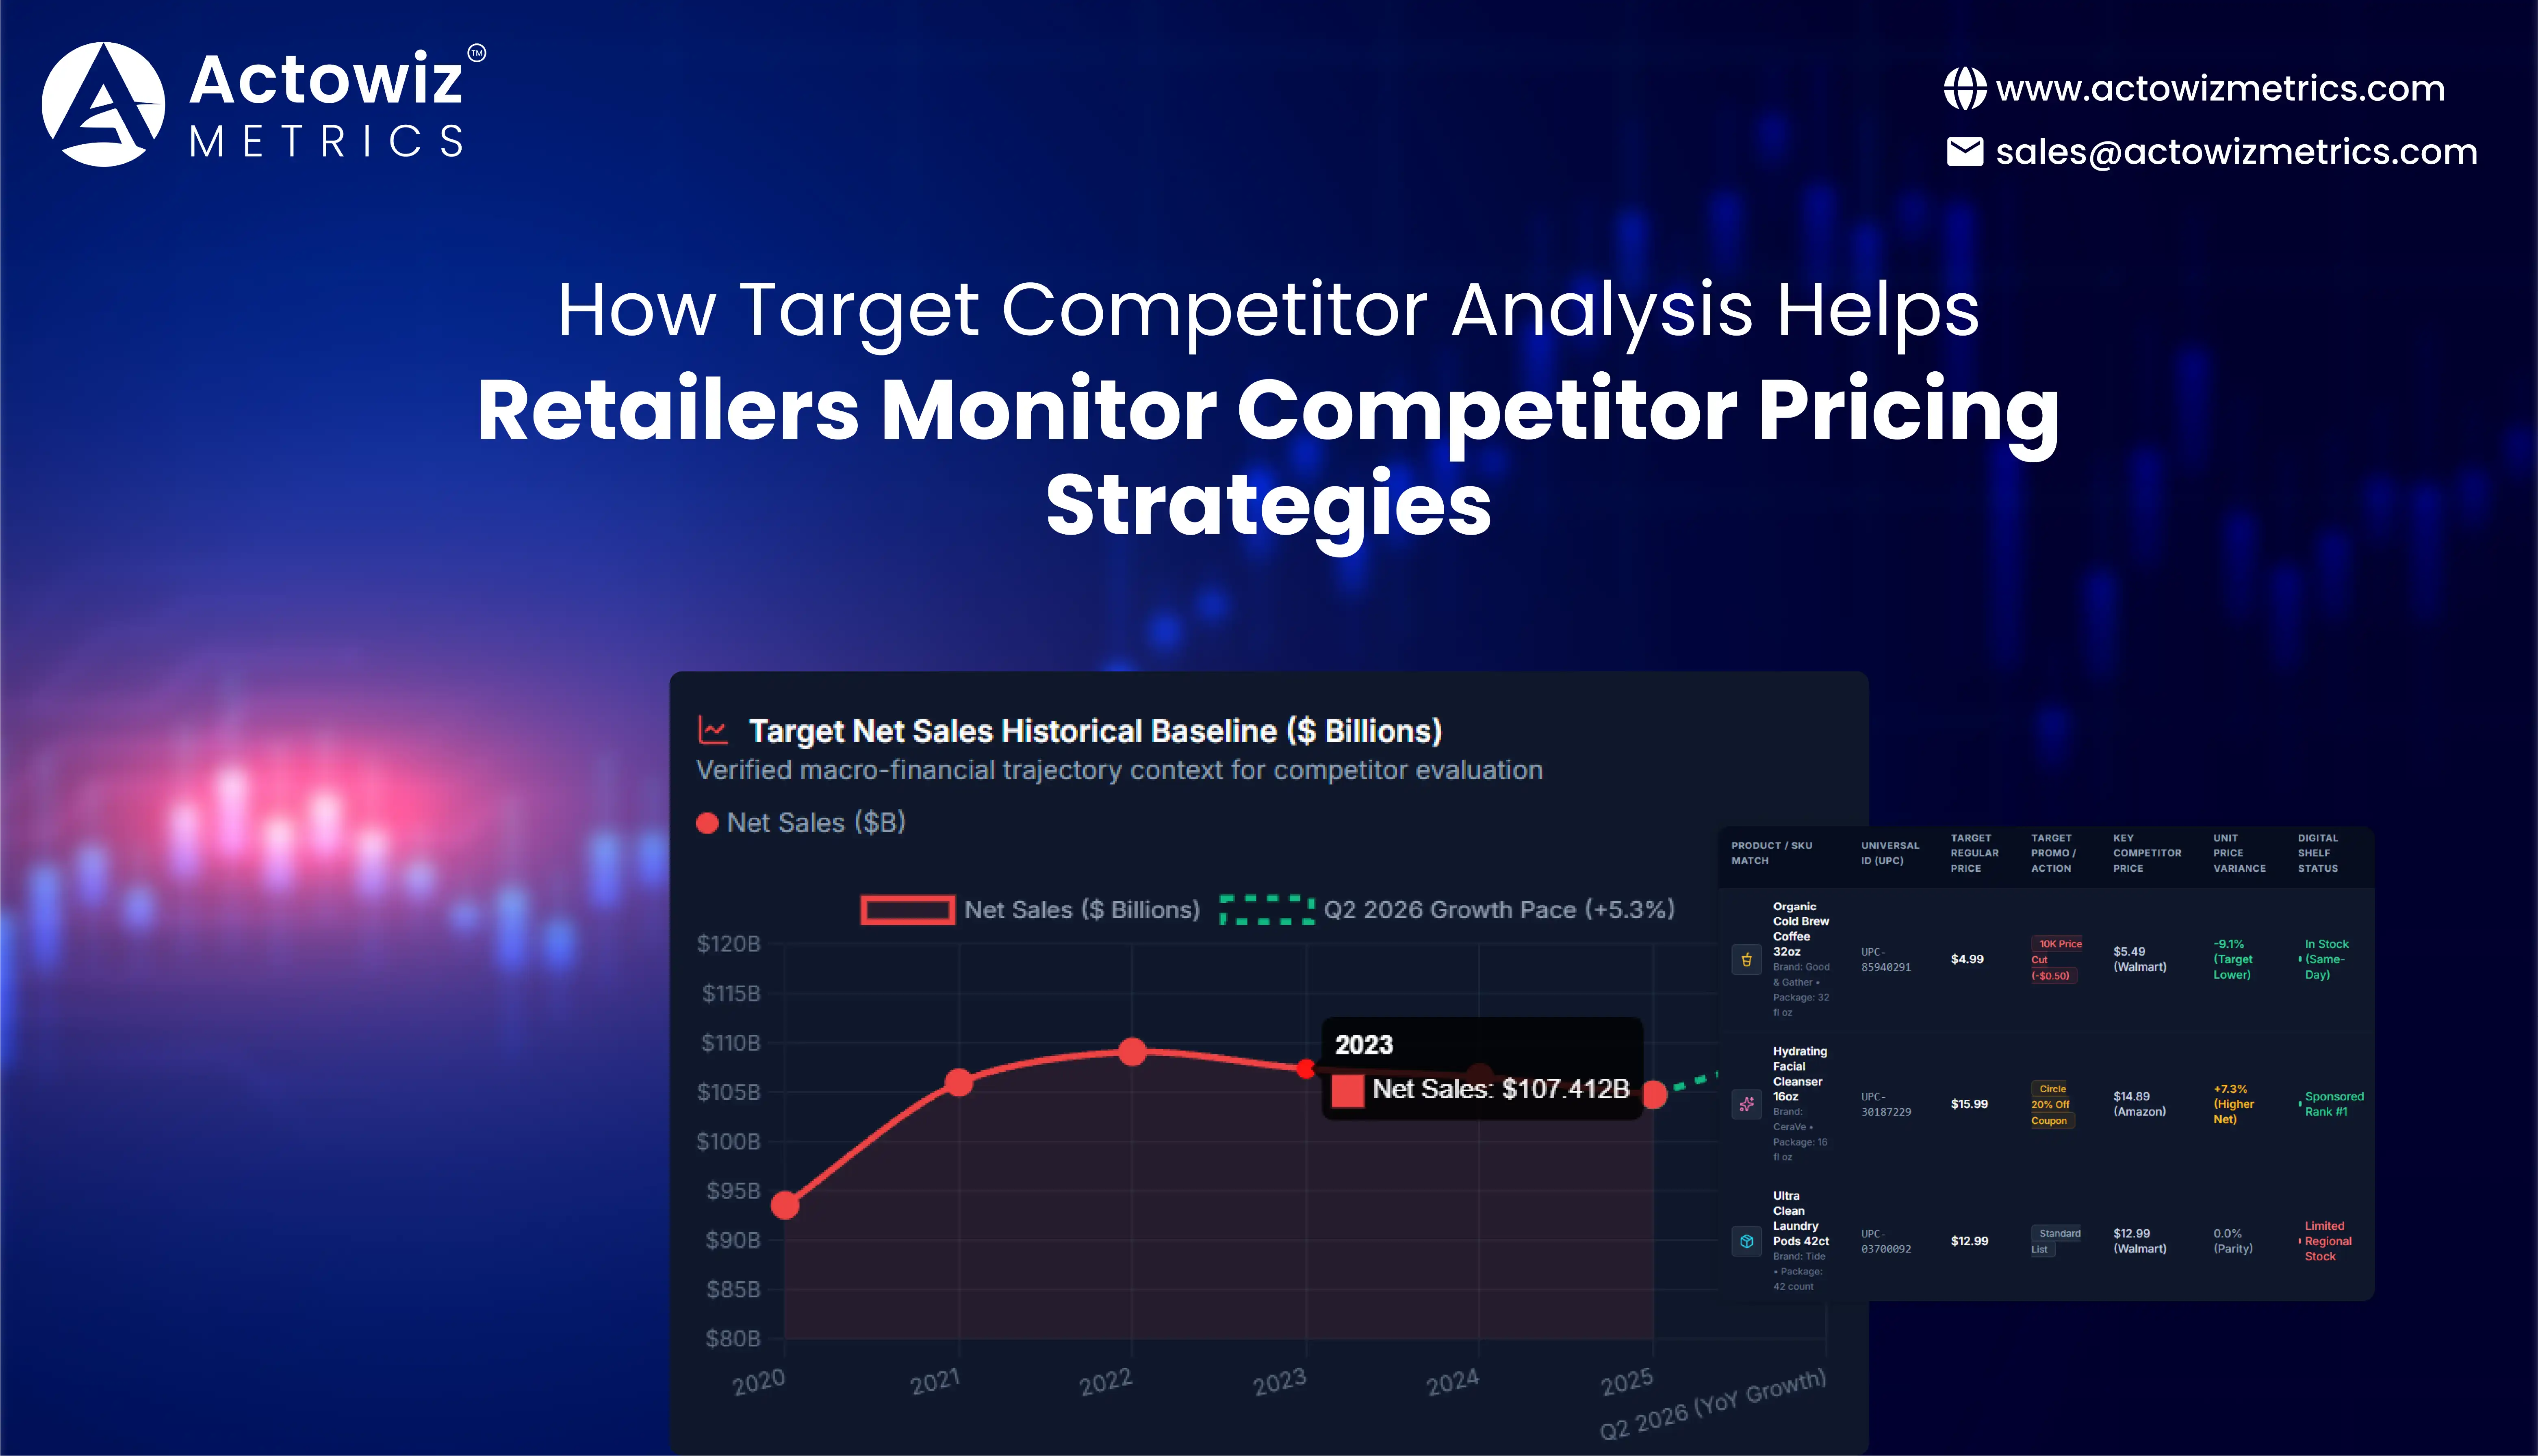
Target's financial performance also shows why ongoing monitoring matters. The company reported net sales of $104.78 billion in 2025, down from $106.57 billion in 2024. In the second quarter of 2026, net sales increased 5.3% year over year, while comparable sales grew 3.8%. These are company-wide results, not direct measures of competitor pricing, but they provide context for understanding changes in the retail environment. Target investor relations and Q2 2026 results.
Target Competitor Price Tracking helps retailers compare Target's displayed prices with those of competing sellers for equivalent products. Effective monitoring should capture the product identifier, brand, package size, price, promotion terms, location where available, and observation timestamp. Without these fields, a comparison may confuse different product configurations or compare a regular price with a conditional offer.
Digital Shelf Analytics adds context by examining how products appear online, including listing details and availability signals. Together, these practices can help pricing teams identify price differences that deserve review and distinguish temporary promotions from more persistent changes.
Target's published annual financial results offer a verified measure of its wider business trajectory. The figures below are net sales, not product-level price observations. The 2026 figure is a second-quarter year-over-year change, not a full-year sales total.
| Period | Target net sales or reported change | Interpretation |
|---|---|---|
| 2020 | $93.561 billion | Annual net sales |
| 2021 | $106.005 billion | Annual net sales |
| 2022 | $109.120 billion | Annual net sales |
| 2023 | $107.412 billion | Annual net sales |
| 2024 | $106.566 billion | Annual net sales |
| 2025 | $104.780 billion | Annual net sales |
| Q2 2026 | +5.3% year over year | Quarterly net sales growth |
Sources: Target financial highlights and Target Q2 2026 results.
For actionable analysis, compare like-for-like items and preserve the source evidence. If package sizes differ, calculate a consistent unit price only when quantities are verified. If a discount requires membership or a coupon, record that condition separately. This creates a more reliable basis for pricing reviews than headline prices alone.
Assortment monitoring helps brands understand which products Target lists, how product ranges change, and how competing products are presented. Relevant signals may include new listings, removed products, title changes, package-size differences, brand coverage, and changes to category placement. These observations can inform assortment reviews, but a listing disappearing from a page does not automatically prove that a product has been discontinued.
A structured Target Product Assortment Monitoring process should keep retailer-specific product identifiers separate from universal product identifiers and retain a record of when each listing was observed. This helps teams distinguish a genuine assortment change from a page update or a temporary data issue.
Target's annual report groups merchandise into categories including food and beverage, beauty, apparel and accessories, home furnishings and décor, hardlines, and household essentials. Its 2025 report recorded $24.136 billion in food and beverage merchandise sales, compared with $23.828 billion in 2024 and $23.899 billion in 2023. These figures describe category sales, not the number of products listed.
| Fiscal year | Target food and beverage merchandise sales |
|---|---|
| 2023 | $23.899 billion |
| 2024 | $23.828 billion |
| 2025 | $24.136 billion |
Source: Target 2025 annual report, financial statements.
For brand managers, the practical next step is to build a category-level record of matched products and review assortment changes alongside price and availability. Use consistent definitions for "new," "removed," and "unavailable," and require repeated observations or additional evidence before labeling a product discontinued.
Target Digital Shelf Performance Analysis examines how products are presented on digital shopping channels. Brands can review titles, descriptions, images, product attributes, displayed prices, and available stock indicators to identify inconsistencies that may affect the shopping experience. The analysis is particularly useful when the same product appears across multiple sellers or when product information changes over time.
Target Competitor Analysis can combine these observations with competitor listings to help teams evaluate whether their product pages are complete and how their offerings compare. However, public listing data does not reveal every factor behind a product's search placement or sales performance. Teams should distinguish observed page elements from assumptions about the retailer's ranking algorithm.
Target's second-quarter 2026 results reported 8.7% growth in digital comparable sales, with same-day delivery growing more than 25%. These are company-reported digital performance indicators, not proof that a particular product listing or competitor-monitoring tactic caused the growth. Target Q2 2026 results.
| Period | Verified digital or company performance indicator | What it can tell analysts |
|---|---|---|
| 2020 | Digital sales grew 145% | Digital shopping expanded sharply during the pandemic |
| 2021 | Comparable sales grew 12.7% | Target reported continued company-wide sales growth |
| 2022 | Annual net sales were $109.120 billion | Provides company-wide sales context |
| 2023 | Annual net sales were $107.412 billion | Provides a baseline for later comparisons |
| 2024 | Annual net sales were $106.566 billion | Shows the direction of annual sales |
| 2025 | Annual net sales were $104.780 billion | Shows a further year-over-year decline |
| Q2 2026 | Digital comparable sales grew 8.7% | Indicates quarterly digital-channel growth |
Sources: Target 2020 annual report, Target 2021 annual report, Target 2025 financial highlights, and Target Q2 2026 results.
For practical use, review listing completeness and presentation changes at regular intervals. Record the date and source for every observation, then prioritize issues such as missing images, inconsistent specifications, or unclear pack sizes. These checks support better catalog management without claiming that public page observations explain all digital performance outcomes.
Target Product Availability Tracking helps businesses understand whether products appear available, unavailable, or subject to location-specific restrictions on the monitored source. For retailers and brands, this information can support assortment reviews, stock-visibility checks, and investigations into differences between markets.
A product page alone may not confirm inventory at every store. Availability can vary by location, fulfillment method, delivery address, and time of observation. A robust monitoring process should therefore record the location context, fulfillment option, timestamp, and exact status displayed by the source. It should also distinguish "out of stock" from "not listed" or "status unavailable."
Target's financial reporting provides context for its physical retail footprint. The company reported 1,995 stores in 2025, compared with 1,978 in 2024 and 1,956 in 2023. Store counts show the scale of its network, but they do not indicate the availability of individual products at those locations. Target corporate overview.
| Year or period | Reported store or sales indicator | Relevance to monitoring |
|---|---|---|
| 2020 | Net sales of $93.561 billion | Company-wide baseline |
| 2021 | Net sales of $106.005 billion | Company-wide sales growth period |
| 2022 | Net sales of $109.120 billion | Annual sales context |
| 2023 | 1,956 Target stores | Reported physical footprint |
| 2024 | 1,978 Target stores | Reported physical footprint |
| 2025 | 1,995 Target stores | Reported physical footprint |
| Q2 2026 | Same-day delivery grew more than 25% year over year | Reported fulfillment-related growth indicator |
Sources: Target financial highlights, Target corporate overview, and Target Q2 2026 results.
For actionable reporting, track the same product across selected locations and fulfillment methods, and preserve each observation. Treat changes as signals requiring validation—not as definitive evidence of supply-chain problems. This helps commercial teams separate a regional availability difference from a temporary page issue or an incomplete data capture.
Target Competitor Promotion Monitoring helps teams observe advertised discounts, coupon conditions, promotional dates, and changes in featured products. Brands can use these records to assess how often competing products are promoted and whether their own offers are positioned competitively. Comparisons should account for package sizes, loyalty requirements, and eligibility restrictions before determining which deal provides better value.
Target Competitor Analysis is most useful when promotional observations are stored historically. A single price snapshot cannot establish whether an offer is unusual, recurring, or part of a seasonal pattern. By maintaining dated records, analysts can distinguish a temporary markdown from a change that persists across several observation periods.
Target reported lowering prices on more than 10,000 items over the year leading into its second-quarter 2026 results. This is a company-reported pricing action, not a measure of its average discount or evidence that every product's price decreased by the same amount. Target Q2 2026 results.
| Period | Verified company metric | How to interpret it |
|---|---|---|
| 2020 | Net sales of $93.561 billion | Annual business context |
| 2021 | Net sales of $106.005 billion | Annual business context |
| 2022 | Net sales of $109.120 billion | Annual business context |
| 2023 | Net sales of $107.412 billion | Annual business context |
| 2024 | Net sales of $106.566 billion | Annual business context |
| 2025 | Net sales of $104.780 billion | Annual business context |
| 2026 | More than 10,000 items had price reductions over the preceding year, according to Target | Reported pricing action, not a discount-rate estimate |
Sources: Target financial highlights and Target Q2 2026 earnings release.
A useful promotion dashboard should capture the displayed price, regular price when shown, promotion dates, coupon or membership conditions, and source URL. Analysts should calculate percentage discounts only when the comparison price is clearly identified and comparable. This prevents the team from overstating savings or comparing offers with different eligibility rules.
Target Share of Search Analysis can help brands examine how often their products appear in defined search-result samples compared with selected competitors. A defensible method needs a consistent search-term list, market or location settings, observation dates, and a documented rule for what counts as a visible result.
Search placement can change according to query wording, personalization, location, sponsored placements, availability, and other factors. Public observations therefore represent a snapshot rather than a complete explanation of Target's search algorithm. Teams should distinguish organic results from sponsored placements whenever the source makes that distinction visible.
Target's digital business provides a relevant backdrop. The company reported 8.7% digital comparable sales growth in Q2 2026, while same-day delivery grew more than 25%. These company-level figures indicate activity across digital channels, but they do not disclose Target's product-level search rankings or a brand's share of search. Target Q2 2026 results.
| Reporting period | Verified Target indicator | What it does not establish |
|---|---|---|
| 2020 | Digital sales grew 145% | Product-level search rank |
| 2021 | Comparable sales grew 12.7% | Share of search for any brand |
| 2022 | Net sales reached $109.120 billion | Search-result visibility |
| 2023 | Net sales were $107.412 billion | Organic ranking factors |
| 2024 | Net sales were $106.566 billion | Brand-level search share |
| 2025 | Net sales were $104.780 billion | Search conversion rates |
| Q2 2026 | Digital comparable sales grew 8.7% | Product-specific search placement |
Sources: Target 2020 annual report, Target 2021 annual report, Target financial highlights, and Target Q2 2026 results.
For reliable comparisons, repeat the same searches under consistent conditions, record result positions and visible placement types, and compare equivalent periods. Report the method and sample size alongside any share-of-search estimate. This makes the measure more transparent and reduces the risk of presenting a limited observation as a complete view of retail search visibility.
Brands and retailers need structured competitive data that connects product-level observations to clear business questions. Competitor Analysis for Brands can include price comparisons, product catalog monitoring, promotional tracking, availability observations, and digital shelf reviews, depending on source coverage and the agreed project scope.
Actowiz Metrics can be considered for a workflow that organizes permitted retail data into consistent fields and historical records. A useful setup should preserve source URLs, timestamps, product identifiers, location context where available, and validation status. These controls help analysts investigate discrepancies and distinguish confirmed observations from uncertain matches.
Target Competitor Analysis should be designed around the client's category, competitor set, market coverage, and reporting frequency. Before implementation, define which sources are in scope, which fields are actually available, how data quality will be assessed, and how results will be delivered. Any specific coverage, refresh rate, or performance outcome should be confirmed rather than assumed.
Retailers can make more informed decisions by monitoring comparable prices, product assortments, promotions, availability, and visible search results. Historical records help reveal changes over time, while product matching and source validation make comparisons more trustworthy. Company-wide financial and digital performance data provide context, but they should not be mistaken for product-level competitive measurements.
Price & Promotion Intelligence gives teams a framework for organizing these observations and identifying differences that deserve further review. Target Competitor Analysis is most valuable when its metrics are transparent, repeatable, and tied to specific commercial decisions.
Contact Actowiz Metrics to discuss a tailored retail intelligence workflow for monitoring prices, promotions, assortment, availability, and digital shelf performance across your target markets!
Expert blogs, research reports and infographics — practical, data-driven reading across e-commerce and quick-commerce.
Most fields are optional — the more you share, the better your sample.
.webp "infographics")
.webp "infographics")