BLOG


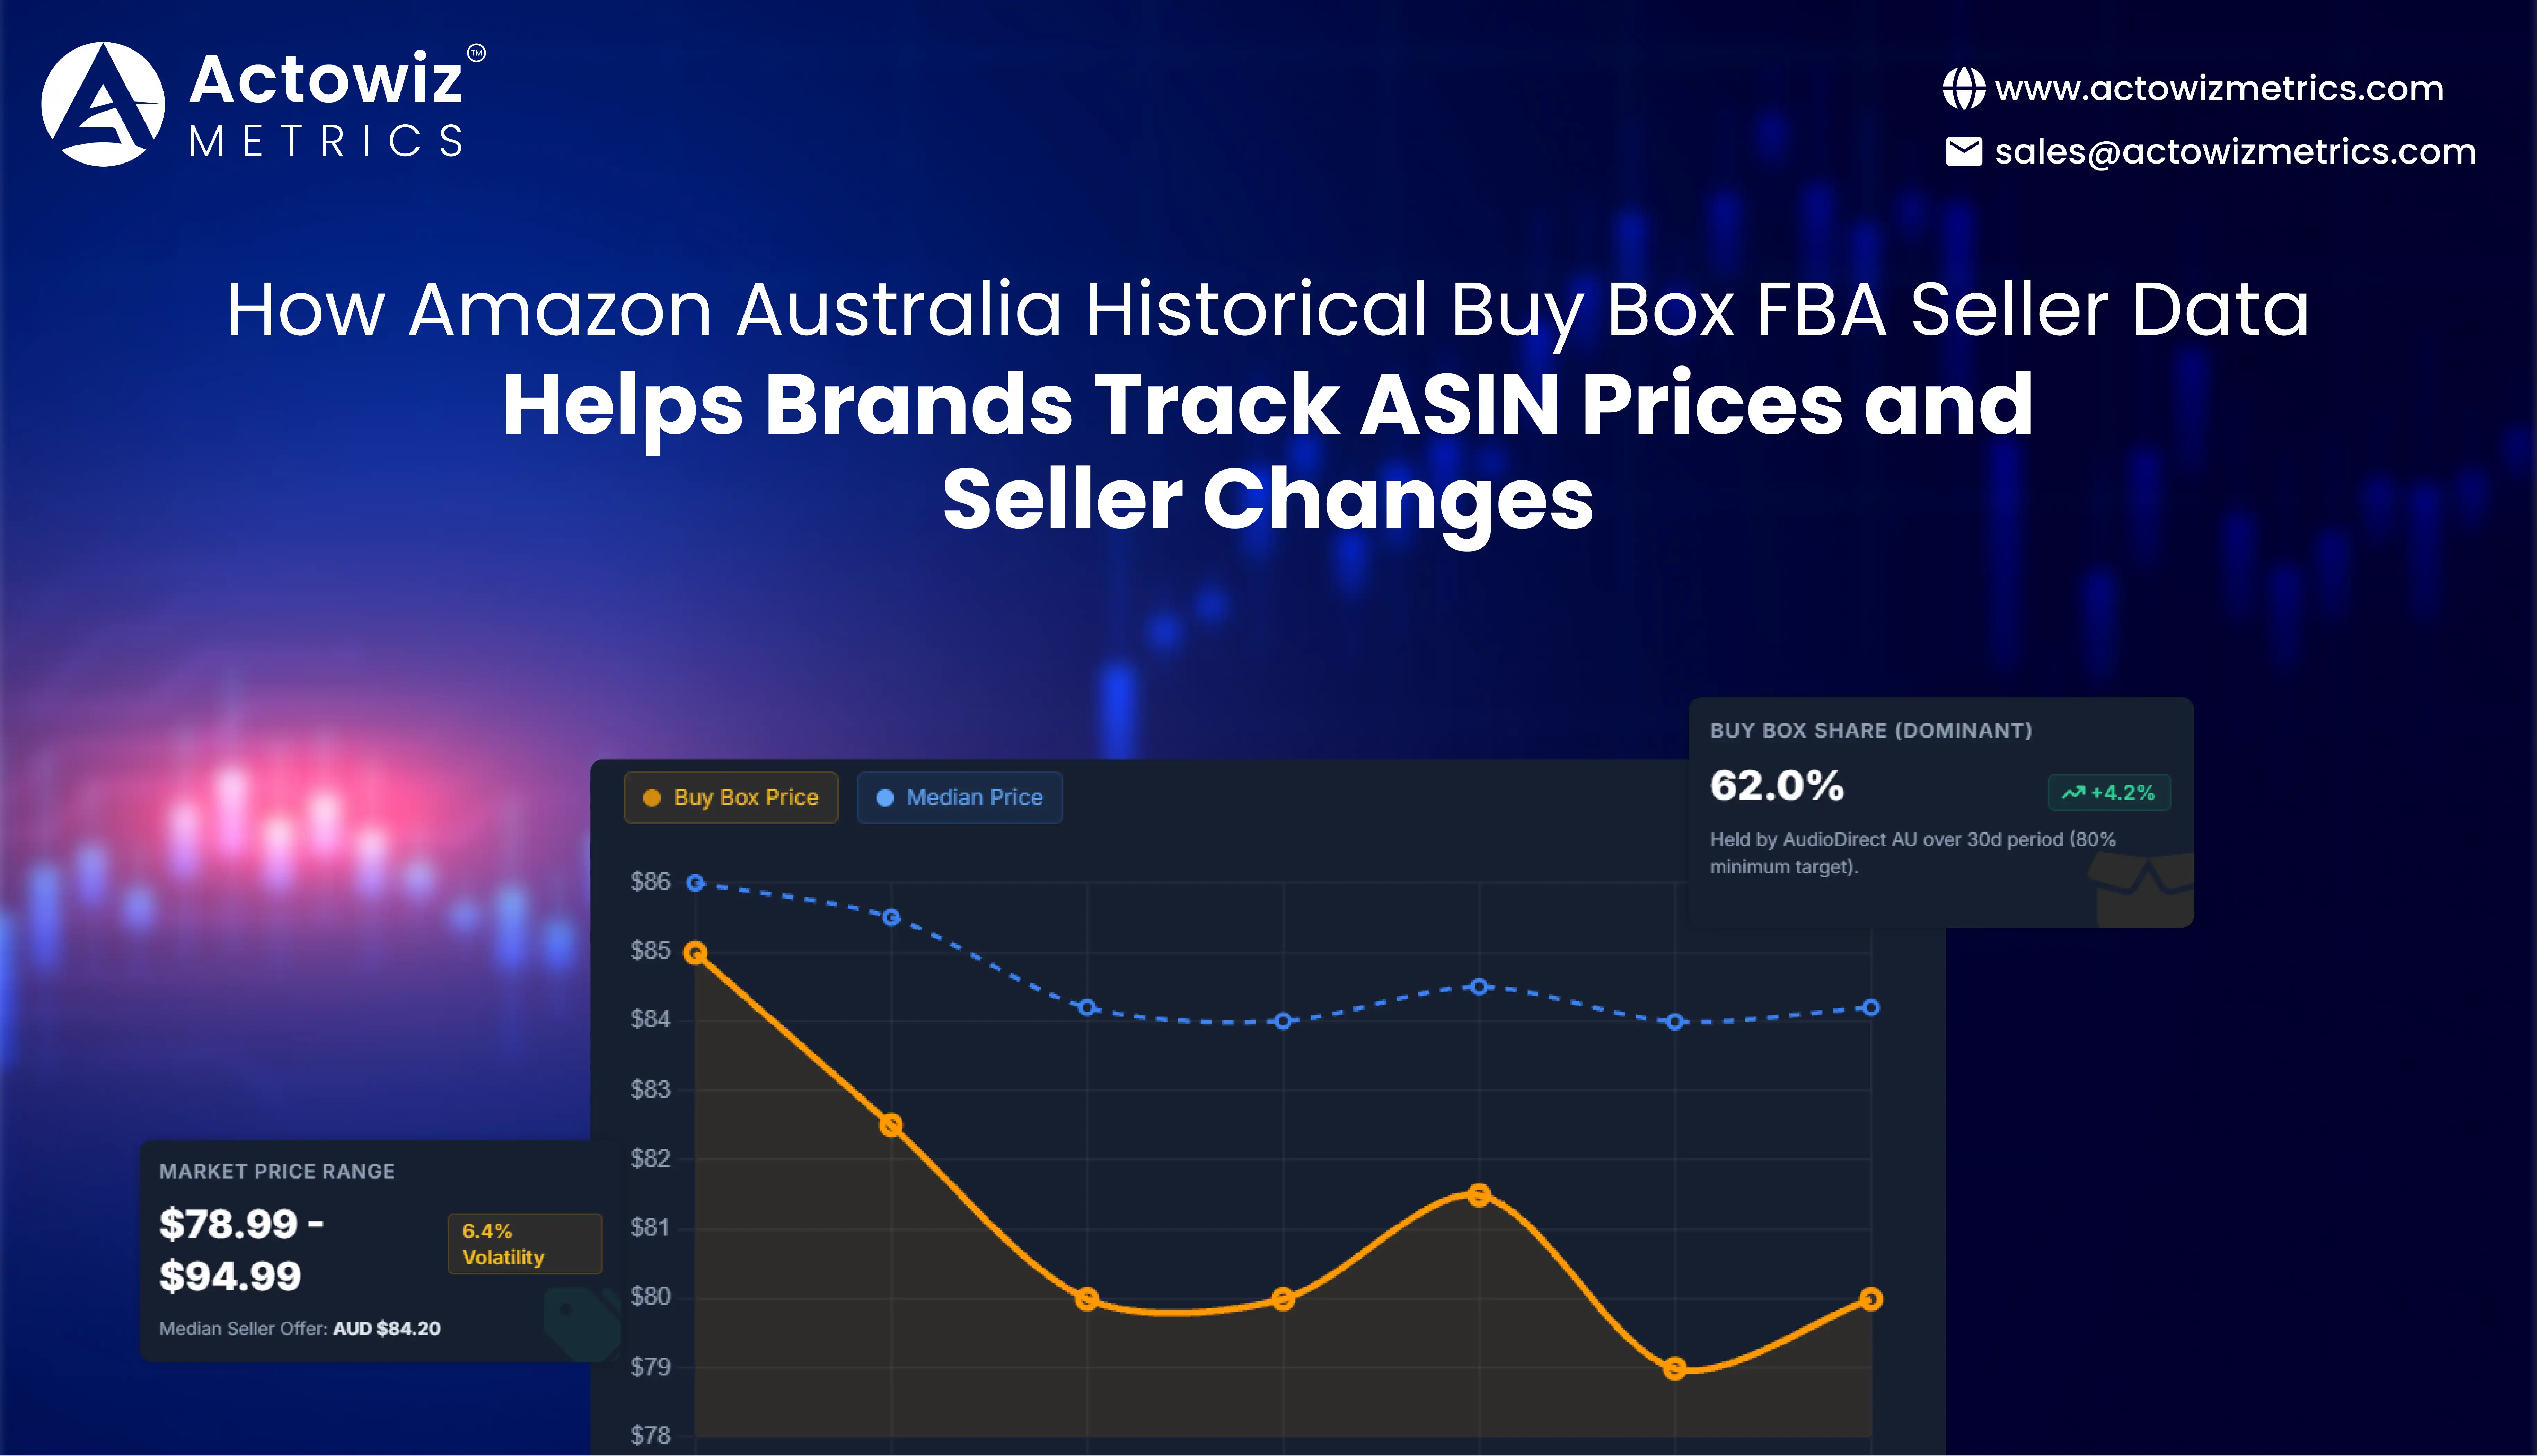
Bottom line: Brands can make better pricing and seller decisions when they track Buy Box movement, FBA offers, seller changes, and ASIN-level price history instead of relying on one-time marketplace snapshots. Amazon Australia Historical Buy Box FBA Seller Data creates this historical view, while Price & promotion intelligence helps brands understand why prices change and when competitive action is required.
Australia's online market has become substantially larger and more competitive since 2020. Australians spent a record $82.6 billion online in 2025, up 14% year over year, and online spending represented about 24% of total retail spending. Online marketplaces alone generated $18.9 billion, while 82% of Australian households shopped online.
For Amazon sellers and brands, this creates a more demanding environment. A product's price can change multiple times while the Featured Offer moves between sellers. A competing FBA seller can enter an ASIN, reduce price, win the Buy Box, and change the competitive position of every other seller.
Amazon itself explains that the Featured Offer, commonly called the Buy Box, is where customers begin the purchase process. Multiple sellers can offer the same product, and Amazon evaluates seller performance when determining Featured Offer eligibility and placement.
That means brands need more than a current price.
They need to know:
Historical ASIN monitoring turns these questions into measurable data.
Amazon Australia historical FBA seller price tracking by ASIN gives brands a structured way to understand how individual products behave over time. Instead of comparing today's price with yesterday's price, businesses can analyze weeks or months of observations to identify persistent pricing patterns.
Amazon's marketplace model makes this especially important because several sellers can offer the same product. Amazon's seller guidance confirms that the same product can have multiple offers with different prices and shipping options, while eligible sellers compete for Featured Offer placement.
A useful ASIN-level dataset should capture:
| Data Point | Purpose |
|---|---|
| ASIN | Product-level identification |
| Product title | Product verification |
| Brand | Brand-level analysis |
| Seller name | Seller identification |
| Seller type | FBA/MFN classification |
| Buy Box price | Primary competitive price |
| Other seller prices | Market-price comparison |
| Discount | Promotion measurement |
| Availability | Stock-position analysis |
| Prime/FBA status | Fulfilment comparison |
| Timestamp | Historical tracking |
| Seller count | Competitive-density measurement |
Australian e-commerce experienced an exceptional acceleration in 2020. Australia Post's historical data shows online spending increased from $28.5 billion in 2019 to $47.4 billion in 2020, a 66.2% jump. It then reached $60.9 billion in 2021 before growth slowed to $61.6 billion in 2022 and $61.5 billion in 2023. In 2024, spending recovered strongly to $68.9 billion, up 12%.
By 2025, online spending reached $82.6 billion, up another 14%.
This progression matters for ASIN monitoring because more online demand means greater commercial value attached to product visibility, pricing, availability, and seller positioning.
Actionable insight: Brands should assign monitoring frequency according to ASIN importance. High-revenue or highly competitive ASINs may require multiple daily observations, while stable long-tail products can be monitored less frequently.
Amazon Australia Buy Box competitor price analytics helps brands identify the difference between simply having a competitive price and actually maintaining a strong marketplace position.
The Buy Box should be analyzed alongside other seller attributes because price alone does not explain every Featured Offer movement. Amazon states that Featured Offer eligibility and placement depend on performance-based criteria, while multiple sellers may compete for the same product detail page.
Consider an illustrative ASIN:
| Seller | Fulfilment | Price | Buy Box Status | Availability |
|---|---|---|---|---|
| Seller A | FBA | AUD $79.99 | Featured | In stock |
| Seller B | FBA | AUD $81.49 | Competing | In stock |
| Seller C | MFN | AUD $78.99 | Competing | In stock |
| Seller D | FBA | AUD $84.99 | Competing | In stock |
A monitoring system can then answer:
Amazon's Australian seller resources also provide product-level pricing details, competitor offers, Featured Offer information, and profitability tools to sellers.
Australia's marketplace environment has expanded substantially. In 2025, marketplaces generated $18.9 billion in online spending, up 13% year over year. Australia Post also reported that 73% of online shoppers spent through online marketplaces during the year.
As marketplace usage increases, small changes in seller positioning can have greater commercial consequences.
Actionable insight: Track the Buy Box share of time rather than only the Buy Box winner at a single point in time. If a seller controls the Featured Offer for 80% of observed periods, that is a stronger competitive signal than simply knowing who won it during one check.
Amazon Australia FBA seller price monitoring allows brands to track seller-level movements before those changes become persistent market trends. Amazon Australia Historical Buy Box FBA Seller Data adds the historical context required to distinguish short-term fluctuations from structural changes.
Amazon describes FBA as a model in which sellers send inventory to Amazon fulfilment centres while Amazon handles picking, packing, shipping, customer service, refunds, and returns. Amazon also notes that FBA is generally the easiest route to Prime badge eligibility for applicable offers.
This makes fulfilment status an important analytical dimension.
| Signal | What It Can Indicate |
|---|---|
| New FBA seller | Competitive entry |
Australia's e-commerce growth changed the economics of marketplace competition. Online spending rose dramatically during 2020-2021, stabilized in 2022-2023, and returned to stronger growth in 2024-2025. The latest Australia Post report shows 2025 online spending reached $82.6 billion and marketplace spending reached $18.9 billion.
At the same time, Amazon's Australian seller ecosystem continues to support FBA expansion. In 2026, Amazon's Australian seller incentives included benefits tied to eligible FBA sales and new FBA selection, demonstrating the ongoing strategic importance of fulfilment within the marketplace ecosystem.
Actionable insight: Create an FBA seller-entry alert. When a new FBA seller appears on a strategically important ASIN, compare its initial price against the current Buy Box and historical median. This can identify potential price disruption before it becomes a sustained trend.
Amazon Australia historical Buy Box seller intelligence transforms seller observations into competitive profiles. Instead of maintaining a simple list of sellers, brands can measure how each seller behaves across time.
For example, seller intelligence can identify whether a competitor is:
A practical seller scorecard can look like this:
| KPI | Seller A | Seller B | Seller C |
|---|---|---|---|
| Buy Box share | 62% | 24% | 14% |
| Average price index | 98 | 101 | 96 |
| Price changes/month | 18 | 7 | 25 |
| FBA availability | 96% | 91% | 78% |
| Promotion frequency | High | Medium | High |
| ASIN coverage | 240 | 125 | 185 |
This approach helps pricing managers distinguish between competitors who merely appear on a product page and competitors who actively influence the marketplace.
The expansion of online shopping has increased the strategic importance of marketplace visibility. Australia Post's data shows online spending increased from $47.4 billion in 2020 to $60.9 billion in 2021, remained around $61.5-$61.6 billion in 2022-2023, then increased to $68.9 billion in 2024.
The acceleration continued in 2025, when spending reached $82.6 billion. Australia Post also reported that the average Australian household purchased from 16 different retailers during 2025, more than double the figure from a decade earlier.
This behavior reinforces the importance of competitive visibility: shoppers can move between sellers and retailers more easily, making pricing and offer quality increasingly transparent.
Actionable insight: Rank competitors by Buy Box influence, not simply seller count. A competitor with fewer listings but a high Buy Box share may deserve more attention than a large seller with limited Featured Offer visibility.
Amazon Australia ASIN FBA seller data analysis allows brands to connect product-level pricing with seller behavior, availability, and competitive intensity. Amazon Australia Historical Buy Box FBA Seller Data provides the time dimension necessary to make these observations meaningful.
An ASIN-level analysis can answer questions such as:
A useful competitive dashboard could include:
| Metric | Example Output |
|---|---|
| Active sellers | 14 |
| FBA sellers | 9 |
| Average seller price | AUD $84.20 |
| Buy Box price | AUD $81.99 |
| Market price range | AUD $78.99–$94.99 |
| 30-day price volatility | 6.4% |
| Buy Box changes | 11 |
| Promotion events | 5 |
| Lowest-price seller | Seller C |
| Highest Buy Box share | Seller A |
The market environment moved from pandemic-driven demand acceleration toward a more mature and value-focused marketplace. Online spending grew 66.2% in 2020 and 28.4% in 2021 before essentially flattening in 2022-2023. Growth returned in 2024 and accelerated further in 2025.
Australia Post's 2026 report describes shoppers as increasingly selective and value-focused. The average online basket fell to $96 in 2025, while shoppers made smaller but more frequent purchases.
For brands, this means price changes can carry greater strategic significance because consumers are actively comparing value.
Actionable insight: Build an ASIN competitive pressure score using seller count, Buy Box volatility, price dispersion, promotion frequency, and FBA availability. Use the score to determine which products require high-frequency monitoring.
Digital shelf analytics provides the broader framework for understanding how products appear and perform on an online marketplace. Price is important, but it is only one part of the digital shelf.
A product can have an attractive price and still lose competitiveness because of:
This is why digital shelf monitoring should combine price, content, seller, fulfilment, and availability data.
| Digital Shelf Metric | Competitive Question |
|---|---|
| Buy Box price | Are we competitively priced? |
| Seller count | How crowded is the ASIN? |
| FBA coverage | How strong is fulfilment competition? |
| Availability | Is the product consistently buyable? |
| Rating | How does customer perception compare? |
| Review count | How established is the offer? |
| Promotion | Are competitors actively discounting? |
| Product content | Is our listing competitive? |
The transformation is visible in Australia's online spending trajectory. Spending rose from $47.4 billion in 2020 to $60.9 billion in 2021, stabilized around $61.5 billion in 2023, and then climbed to $68.9 billion in 2024.
In 2025, Australians spent $82.6 billion online, and marketplaces accounted for $18.9 billion. Australia Post reported that marketplaces grew 13% year over year and 73% of online shoppers spent through marketplaces.
The implication is clear: the digital shelf is no longer simply a product page. It is a competitive environment where price, fulfilment, seller reputation, availability, and promotions interact.
Actionable insight: Combine price alerts with availability alerts. A competitor's price reduction should be treated differently when its product is fully stocked versus when its offer is frequently unavailable.
Actowiz Metrics can help brands transform fragmented Amazon Australia marketplace observations into structured, historical, analytics-ready datasets. Availability & assortment tracking can be combined with seller, price, Buy Box, FBA, promotion, and ASIN-level observations to create a more complete competitive view.
A scalable monitoring workflow can include:
1. ASIN identification
Create a monitored universe of brand-owned, competitor, and strategically important ASINs.
2. Seller discovery
Identify active sellers associated with each ASIN and classify their fulfilment status where observable.
3. Price and Buy Box tracking
Capture Featured Offer pricing, competing seller offers, discounts, and timestamps at scheduled intervals.
4. Historical data storage
Maintain every observation rather than overwriting previous values. This enables trend analysis and event reconstruction.
5. Seller intelligence
Measure seller entry, exit, price behavior, Buy Box share, and ASIN coverage.
6. Competitive alerts
Flag events such as:
7. Dashboard and analytics integration
Deliver structured datasets for BI dashboards, pricing systems, category management, or internal analytics environments.
The result is a repeatable intelligence layer rather than a collection of disconnected price snapshots.
For pricing and marketplace teams, the biggest benefit is decision speed. Instead of discovering a competitive problem after sales decline, teams can see the underlying marketplace movement and investigate earlier.
Amazon Australia Historical Buy Box FBA Seller Data gives brands the historical context needed to understand pricing, seller, fulfilment, and Featured Offer changes at the ASIN level.
Australia's e-commerce market has expanded dramatically since 2020. Online spending increased from $47.4 billion in 2020 to $82.6 billion in 2025, while marketplace spending reached $18.9 billion in 2025.
At the same time, Amazon's Featured Offer system means several sellers can compete for the same product detail page, making seller behavior and price positioning important competitive signals.
For brands, the strongest approach is not simply to monitor today's Buy Box price. It is to understand the history behind the price:
With structured historical data, these questions can become measurable business intelligence.
Ready to strengthen your Amazon Australia pricing and seller strategy? Contact Actowiz Metrics to build a scalable ASIN-level monitoring solution that turns Buy Box, FBA seller, pricing, promotion, and availability data into actionable competitive insights!
Expert blogs, research reports and infographics — practical, data-driven reading across e-commerce and quick-commerce.
Most fields are optional — the more you share, the better your sample.
.webp "infographics")
.webp "infographics")