BLOG
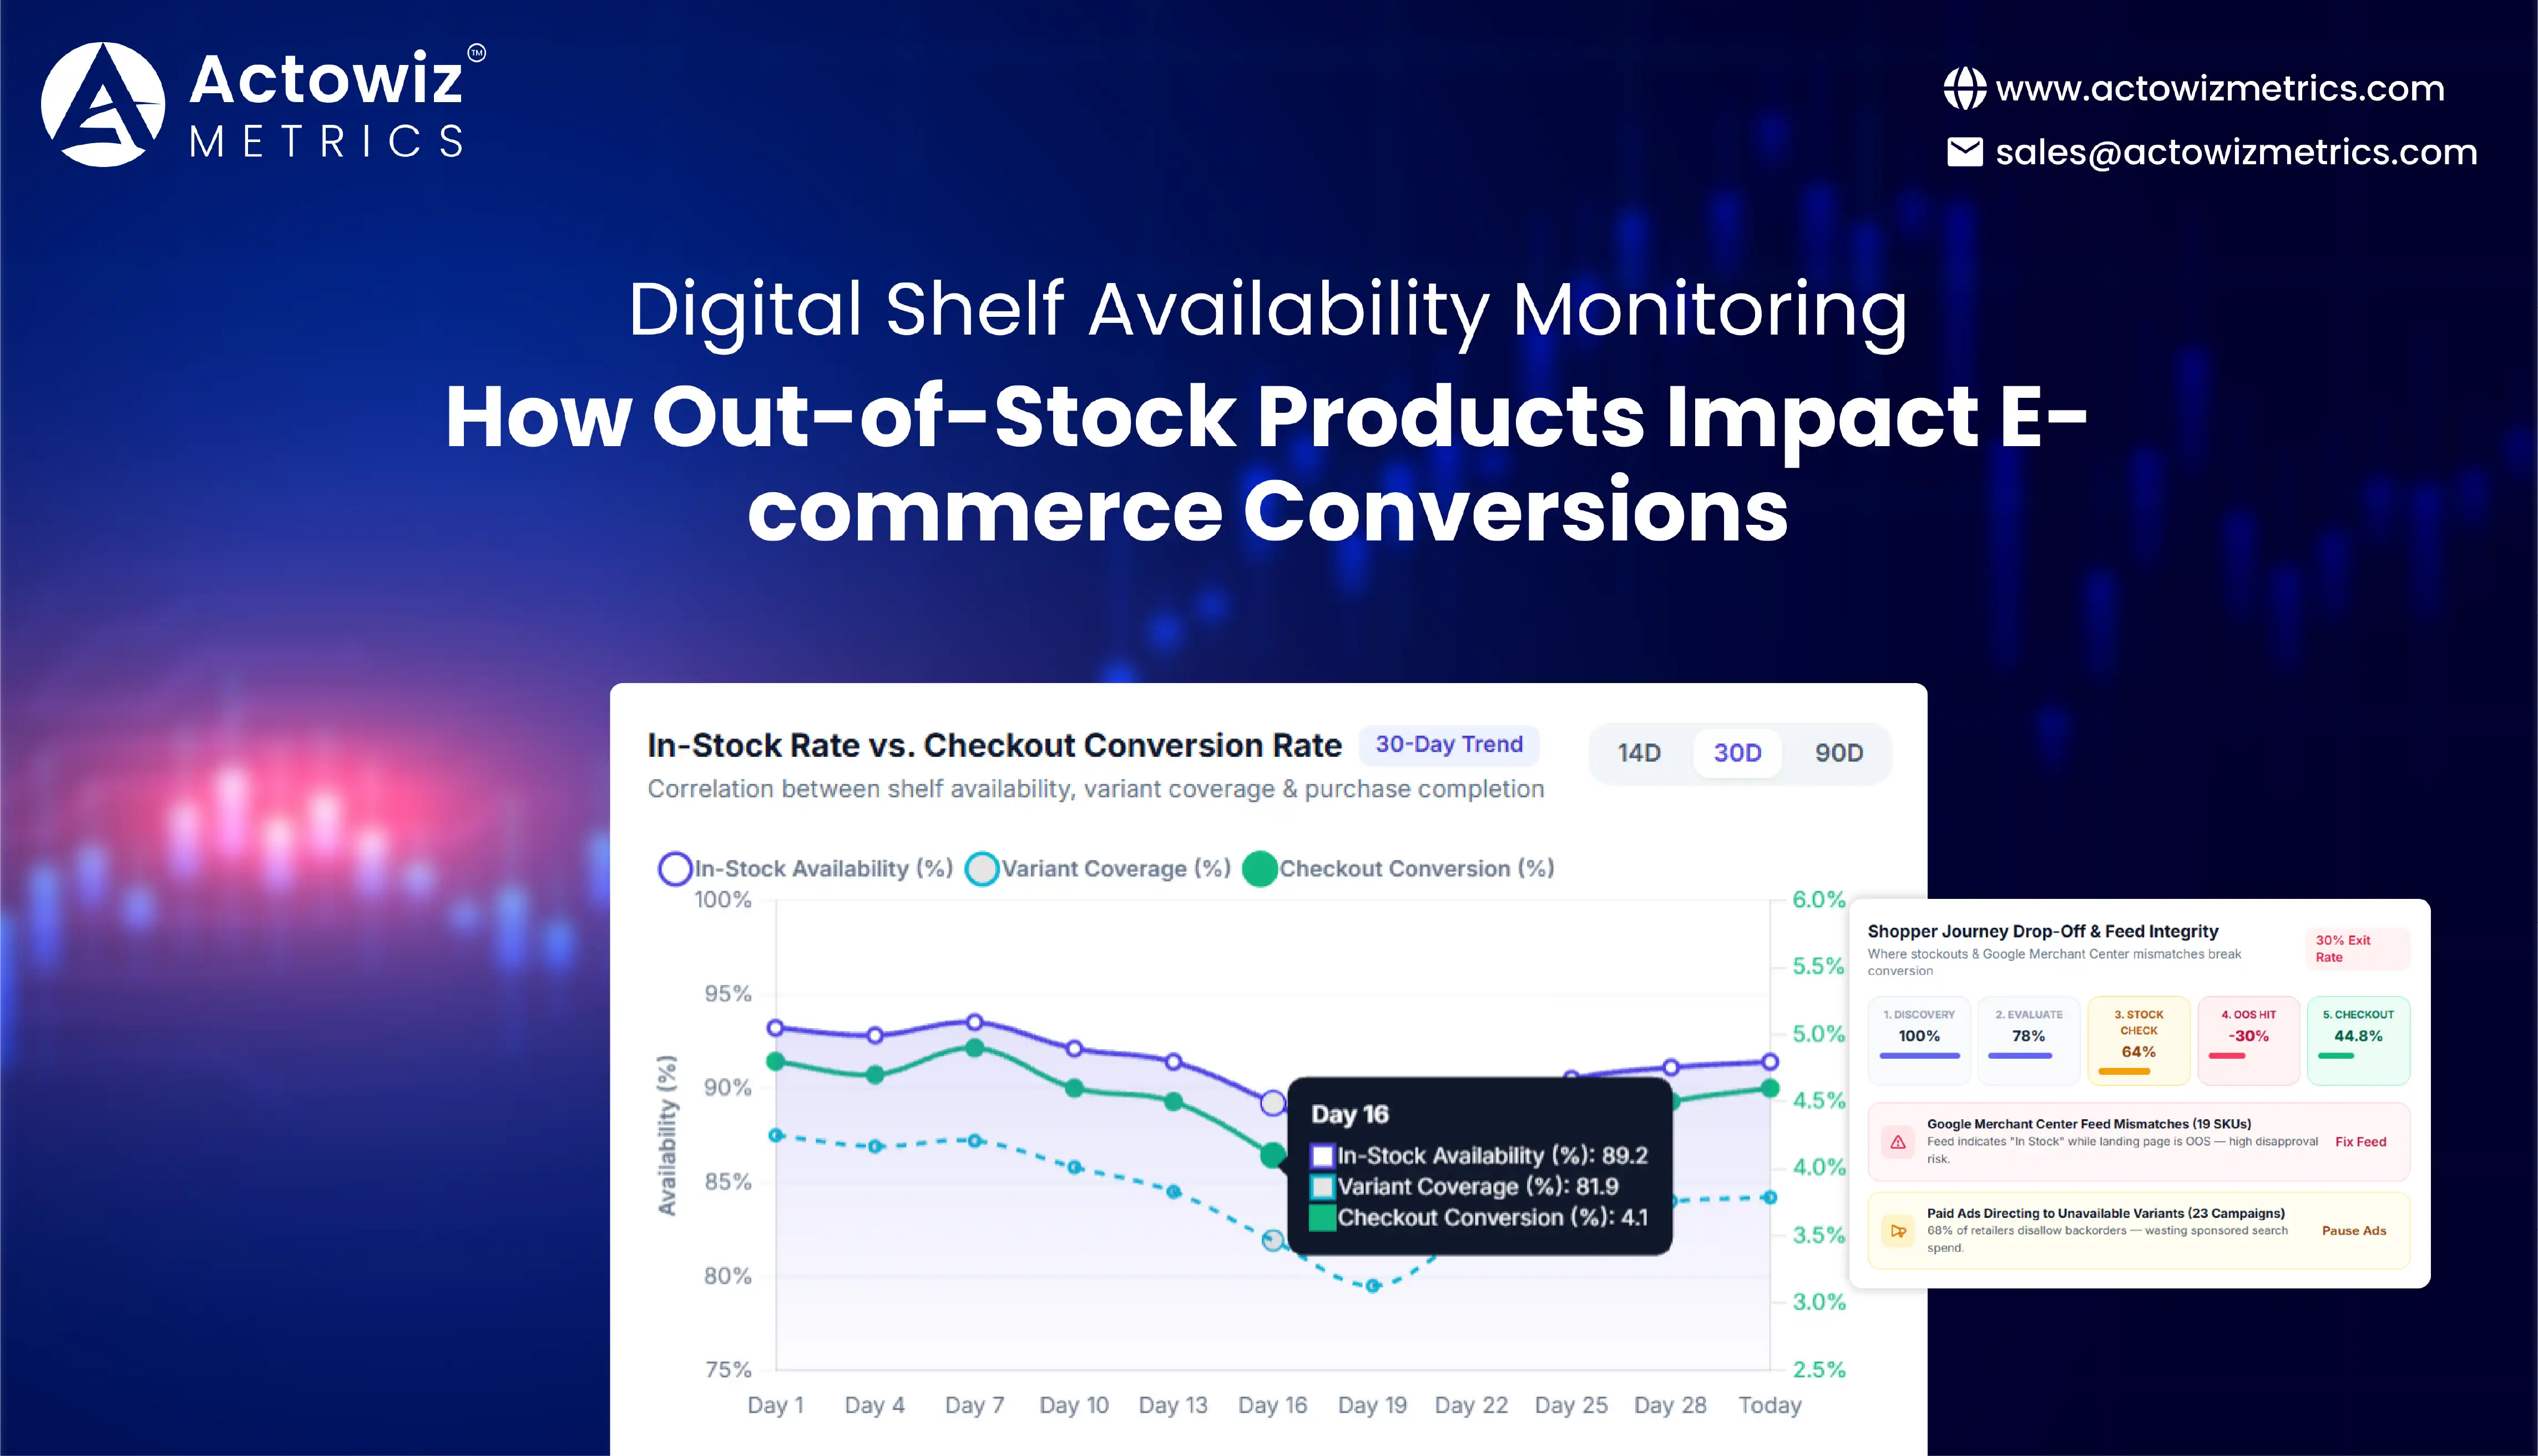


Out-of-stock products directly affect e-commerce conversions by preventing customers from completing purchases, encouraging them to explore competing retailers, and weakening product availability across digital marketplaces. Digital shelf availability monitoring helps brands detect stockouts, identify availability gaps, and take corrective action before lost sales opportunities become prolonged business problems.
As online shopping becomes an increasingly important retail channel, product availability has become a critical factor in customer experience and marketplace performance. Shoppers expect accurate stock information, convenient purchasing options, and reliable delivery estimates. When a product appears available in search results but becomes unavailable on its product page or during checkout, customers may lose confidence in the retailer.
According to the U.S. Census Bureau, U.S. retail e-commerce sales reached $340.2 billion in the second quarter of 2026, representing 17.1% of total retail sales. E-commerce sales also increased 12.2% compared with the second quarter of 2025. These figures demonstrate the scale of the online retail opportunity and the importance of maintaining product availability across digital channels.
Digital shelf analytics enables brands, manufacturers, and retailers to understand how their products appear across online stores. By combining stock availability, product listings, pricing, assortment, and competitor information, businesses can identify operational problems and improve marketplace execution.
For e-commerce directors, category managers, supply-chain teams, and digital commerce leaders, availability intelligence provides an important foundation for protecting conversions. It helps answer essential questions: Which products are unavailable? Where are stockouts occurring? Are competitors offering alternatives? How long does replenishment take? Which products require immediate attention?
Sources: U.S. Census Bureau – Quarterly Retail E-Commerce Sales | NielsenIQ – The Availability Challenge for CPGs.
Product availability influences whether shoppers can move from product discovery to purchase. When customers find an item through search engines, marketplace listings, or retailer websites but discover that it is unavailable, the purchasing journey can stop immediately.
E-commerce product availability analytics helps businesses identify these interruptions by examining stock status across product listings, retailers, and online channels. Instead of depending on occasional manual checks, brands can establish structured monitoring processes that reveal where availability problems occur.
Out-of-stock situations create several commercial challenges. First, customers may abandon a product page when the item cannot be purchased. Second, shoppers may switch to competing products or retailers. Third, unavailable products can weaken promotional campaigns because advertising and merchandising efforts generate interest without providing a purchasable offer.
Baymard Institute’s product-page research, updated with findings in 2025, reports that 30% of users encountering an out-of-stock product or variation are likely to leave the site to look for the product elsewhere. Its benchmark also found that 68% of sites did not allow orders for temporarily out-of-stock products. These findings illustrate why availability management should be treated as a conversion issue, not merely an inventory responsibility.
The following official figures provide context for the growing importance of digital retail availability.
| Year | U.S. retail e-commerce sales milestone |
|---|---|
| 2020 | Exceptional acceleration in online shopping during the pandemic |
| 2021 | Continued expansion of online retail |
| 2022 | E-commerce remained an established retail channel |
| 2023 | Online sales continued to increase |
| 2024 | Annual online retail sales reached a new record |
| 2025 | U.S. e-commerce sales reached approximately $1.234 trillion |
| 2026 | Q2 sales reached $340.2 billion, seasonally adjusted |
The 2020–2024 entries describe market developments rather than numerical annual sales estimates. The 2025 figure is an annual total, while 2026 is a second-quarter figure; these are not directly comparable periods.
Source: U.S. Census Bureau – Historical E-commerce Sales Releases and Q2 2026 Report.
The business implication is clear: as online retail expands, brands need reliable information about product availability to protect purchasing opportunities. Monitoring stock status helps teams identify problems earlier and coordinate corrective actions across inventory, merchandising, and marketplace operations.
Brands frequently distribute products through multiple marketplaces, retailer websites, and e-commerce platforms. Each channel may have different inventory levels, fulfillment arrangements, product variations, and replenishment schedules. Consequently, a product can be available on one retailer’s website while remaining unavailable on another.
Digital shelf availability intelligence for retail brands provides a consolidated approach to understanding these differences. It helps businesses examine product availability across digital channels instead of treating each retailer as an isolated source of information.
With Digital shelf availability monitoring, organizations can identify missing products, unavailable variations, inaccurate stock indicators, and inconsistencies between retailer listings. This information is especially useful for consumer packaged goods manufacturers, electronics brands, beauty companies, fashion retailers, and businesses managing large product portfolios.
For example, a brand distributing the same product through several online retailers needs to know whether its products are consistently available across those channels. If a popular product disappears from one retailer’s listing while remaining available elsewhere, the brand can investigate whether the issue relates to retailer inventory, listing status, distribution, or product-data synchronization.
Google Merchant Center requires submitted product availability to match the information shown on the landing page. Google also explains that availability mismatches between product data and landing pages can lead to product disapprovals.
This requirement highlights a wider marketplace principle: customers should receive consistent information about whether a product can actually be purchased.
| Availability issue | Potential customer impact | Business priority |
|---|---|---|
| Product marked in stock but unavailable | Purchase interruption | Correct stock information |
| Product missing from retailer listing | Reduced product discoverability | Investigate listing coverage |
| One variant unavailable | Lost purchase opportunity for that selection | Monitor variant-level stock |
| Delayed stock updates | Inconsistent customer information | Improve data synchronization |
| Product available only in selected regions | Delivery restrictions | Check regional availability |
Sources: Google Merchant Center – Product Availability | Google – Mismatched Product Availability.
A stockout is not simply an inventory problem. It can also affect advertising efficiency, product discoverability, customer retention, and promotional performance. Businesses that identify stockouts quickly can investigate whether the problem is caused by demand changes, supply constraints, inaccurate product information, or retailer-level inventory issues.
E-commerce product availability analytics and stockout tracking helps organizations connect availability observations with product-level and retailer-level performance. This allows teams to identify which products experience repeated stockouts, where the problems occur, and how long products remain unavailable.
For example, a retailer may continue promoting a product even though its available inventory has been exhausted. Without regular availability checks, marketing teams may continue directing shoppers toward an item that cannot be purchased. Monitoring stock status alongside promotional activity helps businesses identify such inconsistencies.
| Observation | Recommended investigation | Business response |
|---|---|---|
| Repeated product stockouts | Demand and replenishment patterns | Review inventory planning |
| Stockout across multiple retailers | Supply or distribution constraints | Coordinate with supply-chain teams |
| One retailer shows unavailable stock | Retailer inventory or listing status | Contact the retailer |
| Product available but variant missing | Variant-level inventory | Review assortment availability |
| Promotional product unavailable | Campaign and stock synchronization | Adjust promotional activity |
The NielsenIQ analysis of product availability explains that consumer demand varies by channel, geography, seasonality, promotions, and other market conditions. Supply-network constraints can also create stockouts and lost sales opportunities. This reinforces the importance of analyzing availability in the context of both demand and supply.
A practical improvement is to create an exception-based monitoring process. Instead of treating every unavailable product equally, businesses can prioritize high-demand products, important promotional items, and products experiencing repeated availability problems.
This approach helps commercial teams focus on the stockouts most likely to interrupt customer purchasing journeys.
Source: NielsenIQ – The Availability Challenge for CPGs.
Selling through multiple digital channels increases the complexity of product availability management. Retailers may update inventory at different times, use different product identifiers, and display different delivery conditions. These differences can make it difficult for brands to understand their actual digital shelf position.
Online product availability monitoring across marketplaces helps businesses compare product stock information across multiple e-commerce destinations. It provides a consolidated view of where products are available, where listings are missing, and where stock information requires investigation.
With Digital shelf availability monitoring, brands can evaluate marketplace-level availability instead of depending on individual retailer reports. This is particularly valuable for manufacturers and distributors working with several retail partners.
| Monitoring dimension | Information collected | Business application |
|---|---|---|
| Marketplace | Retailer or platform | Compare channel coverage |
| Product | SKU or product identifier | Match listings |
| Availability | In stock or out of stock | Identify purchase barriers |
| Variant | Size, color, or configuration | Detect selection gaps |
| Geography | Supported location | Identify regional restrictions |
| Timestamp | Observation date and time | Evaluate update freshness |
| Competitor | Competing product availability | Understand alternative options |
Google Merchant Center’s documentation provides an important example of why cross-channel data consistency matters. Google requires product availability information to align with landing pages and checkout information. It also recommends maintaining current product data and ensuring variant-level availability matches the corresponding product page.
For businesses operating across multiple marketplaces, the same principle is useful: availability information should be evaluated at the correct product, location, and channel level.
Source: Google Merchant Center – Availability Requirements.
Knowing that a product is out of stock is useful, but understanding how its availability compares with other products and retailers provides greater commercial value.
Product availability and digital shelf performance benchmarking helps businesses evaluate availability patterns across product categories, retailers, brands, and competitive sets. It enables teams to identify whether a particular product has an isolated inventory problem or whether broader availability gaps exist across an entire category.
For example, a manufacturer can compare the availability of its products across different retail partners. A category manager can examine whether important product variations are consistently available. A digital commerce team can investigate whether competing products remain available during periods when its own listings show stock interruptions.
A useful distinction is that availability measurements depend on the monitoring methodology. An observation-based in-stock rate is not necessarily equivalent to a true unit-level inventory rate.
For example, if a product is checked at scheduled intervals, the resulting data measures the proportion of those observations when the product appeared available. It does not automatically reveal the exact number of units in inventory or every moment when a stockout occurred.
| Benchmarking result | Possible interpretation | Suggested response |
|---|---|---|
| Low availability across several retailers | Potential supply constraint | Investigate distribution and replenishment |
| Low availability for one retailer | Channel-specific issue | Review retailer inventory |
| High availability for competitors | Competitive purchasing advantage | Investigate assortment and supply |
| Repeated variation-level gaps | Incomplete product assortment | Review variant replenishment |
| Availability improves after replenishment | Stock recovery | Continue monitoring |
| Product remains unavailable | Persistent supply or listing problem | Escalate investigation |
U.S. Census Bureau e-commerce reporting provides a useful market-level reference for understanding the growth of digital retail.
| Period | Seasonally adjusted U.S. e-commerce sales | Share of total retail sales |
|---|---|---|
| Q2 2020 | $208.1 billion | 16.3% |
| Q2 2021 | $236.0 billion | 14.6% |
| Q2 2022 | $248.0 billion | 14.2% |
| Q2 2023 | $269.7 billion | 15.3% |
| Q2 2024 | $288.8 billion | 16.1% |
| Q2 2025 | $303.3 billion | 16.3% |
| Q2 2026 | $340.2 billion | 17.1% |
Figures are rounded and represent second-quarter observations. E-commerce sales are nominal, seasonally adjusted estimates. Source: U.S. Census Bureau quarterly retail e-commerce sales series, available through FRED and the Census Bureau.
The figures show the expansion of online retail over this period, although the share of total retail sales did not increase continuously every year. For retailers, the implication is that digital availability needs to be managed as an ongoing operational priority.
Benchmarking also helps businesses set measurable internal objectives. Teams can identify priority categories, compare retailers, monitor recurring stockouts, and evaluate whether availability improves following operational changes.
The objective should not simply be to maximize the number of products marked in stock. It should be to maintain accurate, purchasable product offers that meet customer expectations across relevant channels.
Product availability and assortment management are closely connected. A retailer may have sufficient overall inventory while still experiencing shortages in popular sizes, colors, models, or pack configurations. Monitoring only the parent product can therefore hide important purchasing barriers.
Availability & assortment tracking helps brands evaluate whether the right product variations are available across relevant marketplaces. It connects assortment coverage with stock observations, retailer listings, and competitive product information.
With Digital shelf availability monitoring, businesses can identify missing variations, unavailable products, and inconsistent assortment coverage across digital retailers.
| Metric | What it measures | Why it matters |
|---|---|---|
| In-stock rate | Available observations | Measures observed availability |
| Out-of-stock rate | Unavailable observations | Highlights purchase interruptions |
| Assortment coverage | Listed products versus expected assortment | Identifies missing products |
| Variant availability | Available product configurations | Reveals selection gaps |
| Stockout duration | Time between observed stockout and recovery | Helps prioritize persistent issues |
| Retailer coverage | Number of monitored retailers carrying a product | Evaluates distribution presence |
| Data freshness | Time since the last valid observation | Helps assess information reliability |
This approach transforms stock monitoring from a reactive inventory check into a structured digital commerce process. It also creates a shared information foundation for merchandising, supply-chain, sales, and marketplace teams.
Actowiz Metrics helps brands, manufacturers, retailers, and e-commerce businesses gain better visibility into product availability, competitor activity, pricing, and digital shelf performance.
Through Price & promotion intelligence, businesses can connect product availability observations with pricing changes, promotional activity, and competitor information. This supports a more comprehensive understanding of the factors affecting product discoverability and purchasing opportunities.
Combining these insights with Digital shelf availability monitoring helps organizations identify availability gaps and prioritize products requiring attention.
Out-of-stock products create more than inventory challenges. They interrupt purchasing journeys, reduce conversion opportunities, encourage customers to explore competing retailers, and weaken the effectiveness of digital merchandising campaigns.
Brands need consistent product availability information to understand where stockouts occur, which product variations are affected, and how different retailers perform. Combining availability observations with pricing, assortment, and competitor intelligence makes it easier to identify problems and prioritize corrective action.
Digital shelf availability monitoring provides businesses with a structured way to track product availability, detect stockout patterns, evaluate retailer coverage, and maintain better visibility across e-commerce channels.
For brands looking to strengthen marketplace performance, Actowiz Metrics offers data intelligence solutions that support product availability research, competitor monitoring, price intelligence, and digital shelf analysis.
Ready to identify product availability gaps and protect e-commerce conversion opportunities?
Partner with Actowiz Metrics to build a customized product availability intelligence solution. Contact our team today to explore scalable data collection, stockout monitoring, and digital shelf analytics for your e-commerce business!
Expert blogs, research reports and infographics — practical, data-driven reading across e-commerce and quick-commerce.
Most fields are optional — the more you share, the better your sample.
.webp "infographics")
.webp "infographics")