BLOG


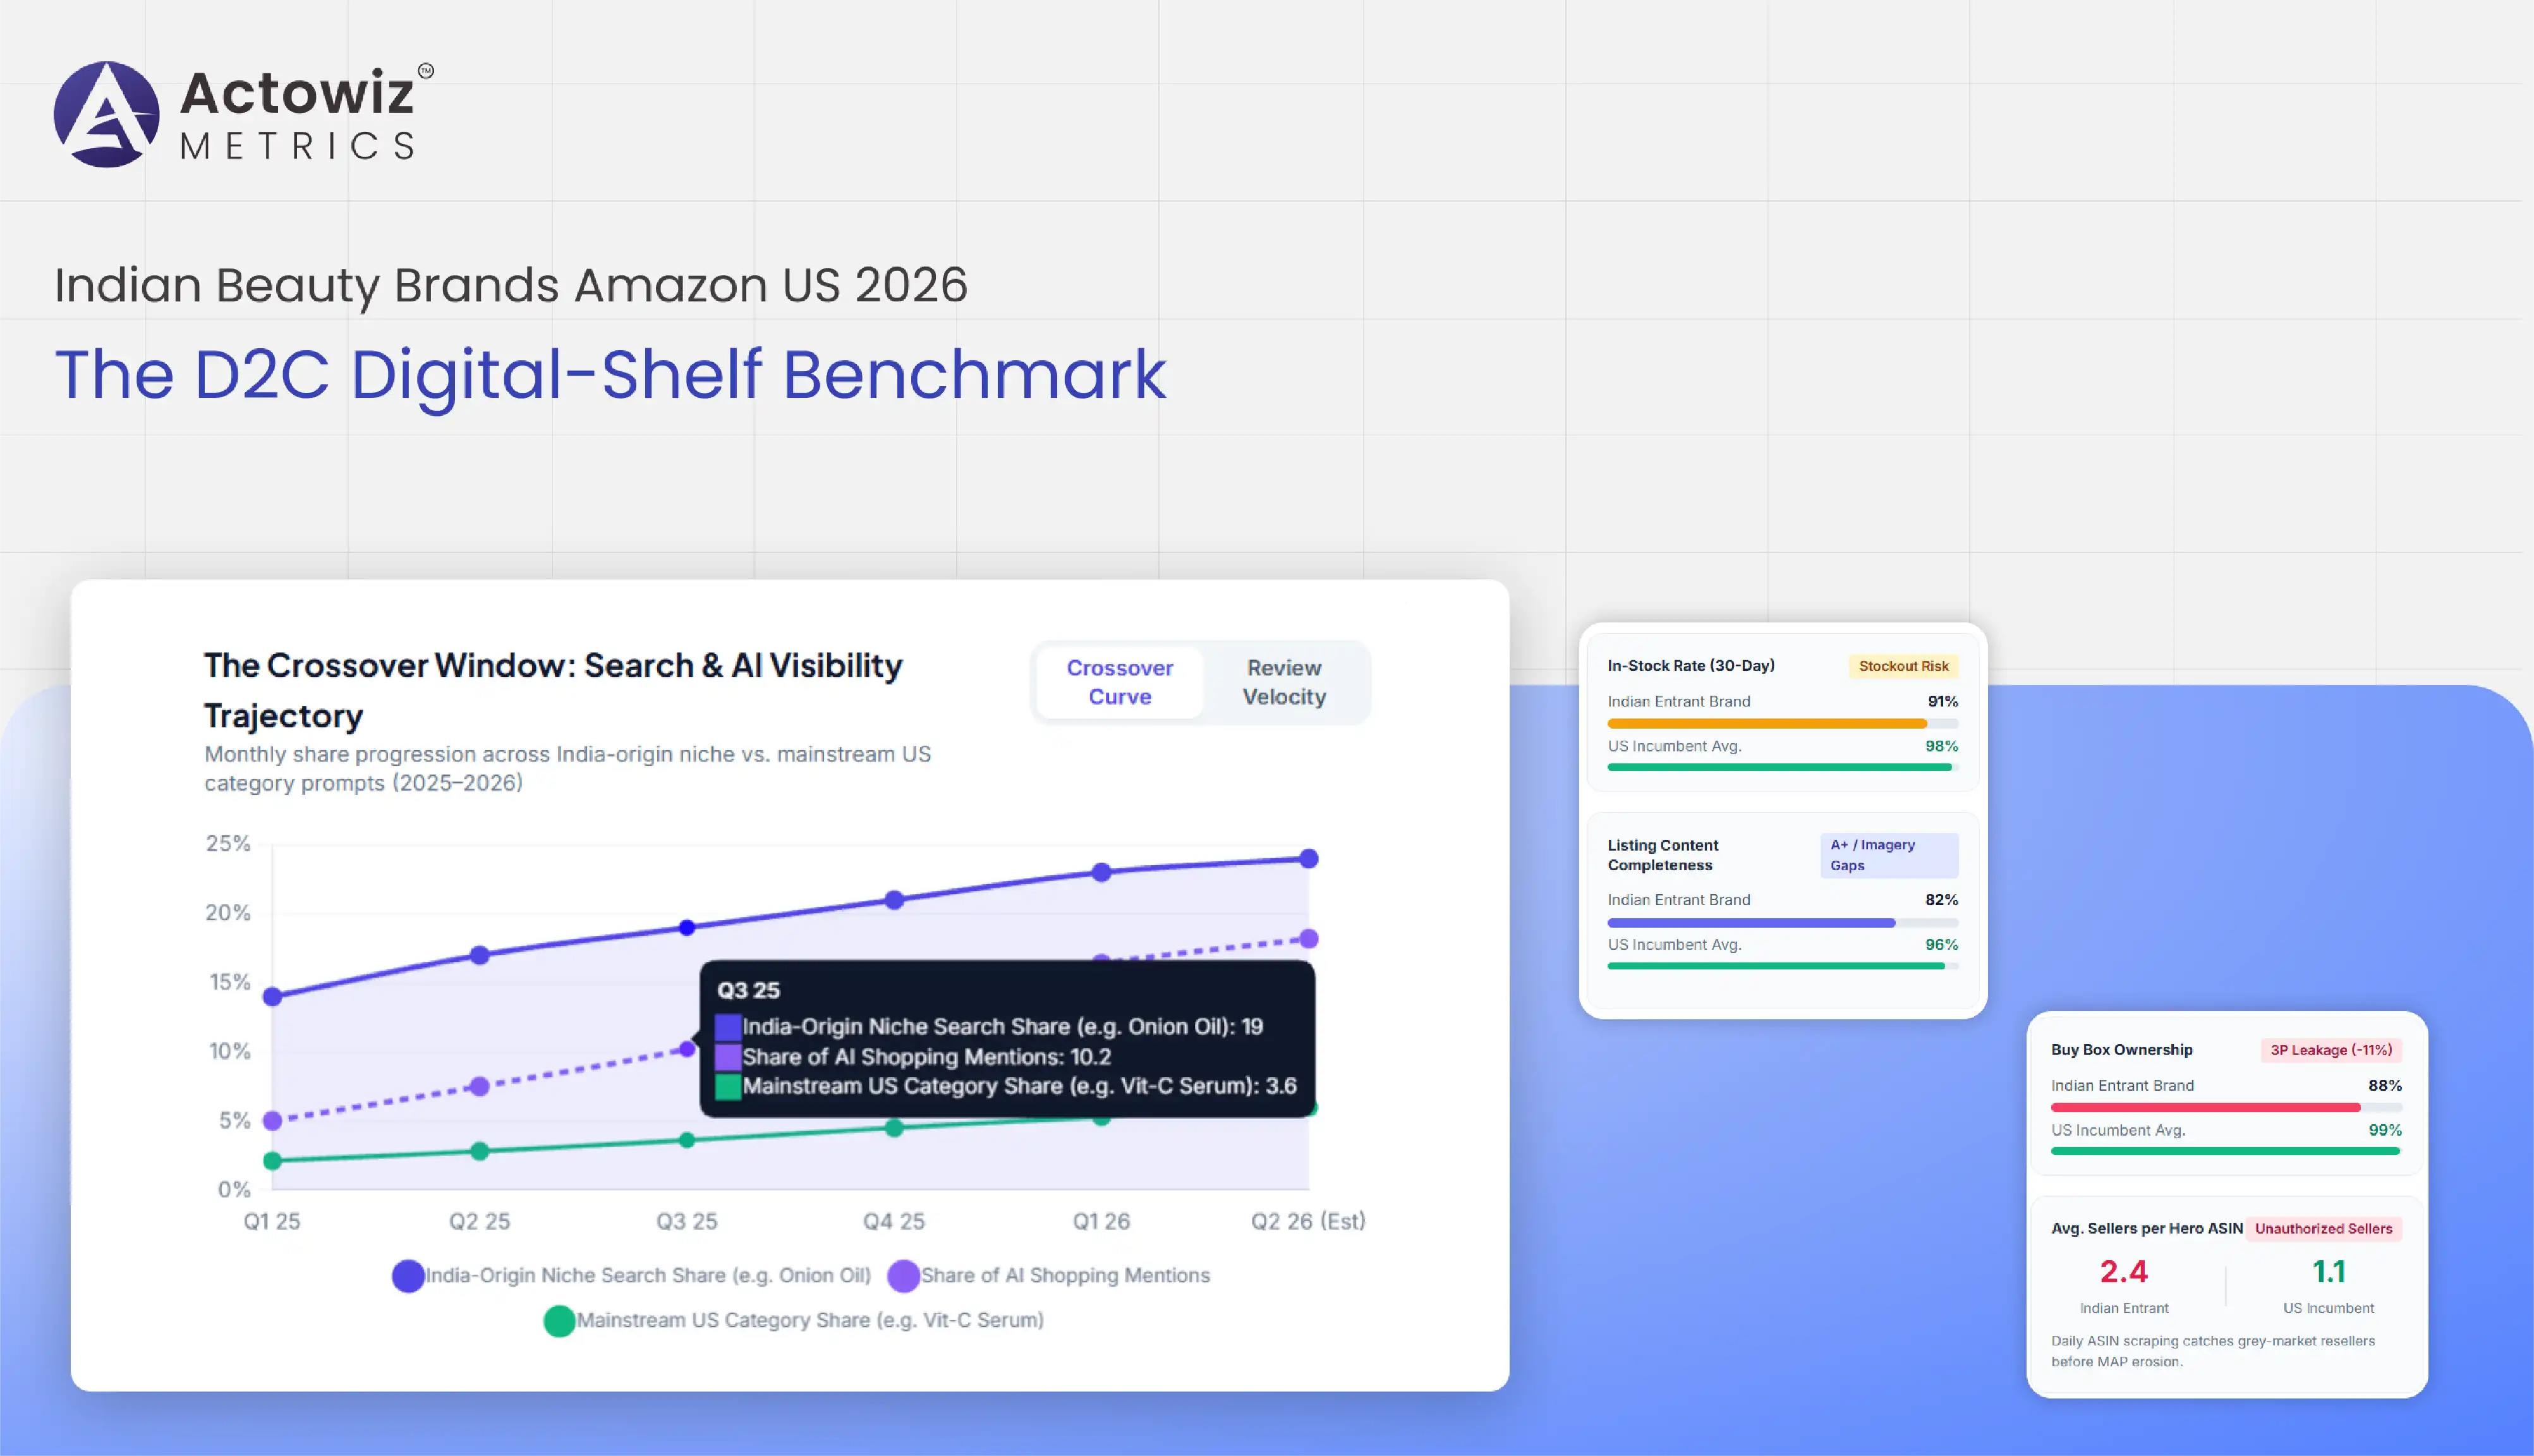
How Mamaearth, WOW Skin Science, mCaffeine and their peers compete against US incumbents on price, discoverability, reviews, and AI answer visibility — and what the public digital-shelf data reveals about the next phase of India’s beauty export story.
Indian direct-to-consumer (D2C) beauty has crossed a threshold. What began as a home-market phenomenon — brands built on content, performance marketing, and “clean” or naturals positioning — is now a deliberate export play, and the United States is the prize. For brands weighing or already running a US marketplace program, the question is no longer whether to be on Amazon US, but how to win a shelf already crowded with deep-pocketed incumbents.
This report uses public digital-shelf signals to benchmark how Indian beauty brands are performing on Amazon US heading into 2026. It looks at five levers that decide marketplace outcomes: price and pack positioning, share of search, ratings and review velocity, availability and Buy Box control, and the newest battleground — Share of AI, or how often a brand surfaces inside AI-generated shopping answers. All figures in this report are illustrative samples that show the shape of the analysis Actowiz Metrics delivers; live engagements use each brand’s current marketplace data.
Three forces are pushing Indian beauty brands toward the US shelf at the same time. First, home-market economics: customer-acquisition costs in India have climbed, and the most advanced D2C houses have already captured the easy domestic demand. Second, the diaspora: the US has one of the largest and most affluent South-Asian populations in the world, which gives an Indian beauty brand a warm first cohort of buyers who already know the name. Third, category tailwinds: “naturals”, Ayurveda-inspired actives, and ingredient-led skincare are mainstream growth stories in the US, and that is exactly where many Indian brands are strongest.
The catch is that Amazon US is a mature, saturated market. An Indian brand is not competing against a blank shelf — it is competing against established naturals players, DTC-native US brands, and global majors with large retail-media budgets. Winning requires knowing, precisely and continuously, where you stand on every shelf signal that drives the Buy Box and the search result. That is the gap this report illustrates.
The Indian beauty brands most visible on Amazon US fall into three loose tiers, based on how committed and how established their US marketplace presence is. The table below is an illustrative snapshot of the competitive set an enterprise brand would benchmark against.
| Brand (illustrative) | Core positioning | US presence tier | Hero categories on Amazon US |
|---|---|---|---|
| Mamaearth / Honasa | Toxin-free, natural, mom-and-baby heritage | Established | Face serums, hair oils, baby care |
| WOW Skin Science | Actives + naturals, apple-cider-vinegar hero | Established | Shampoo, vitamin-C serum, hair care |
| mCaffeine | Caffeine-led skincare, bold branding | Scaling | Body scrubs, under-eye, face wash |
| Minimalist / Deconstruct | Ingredient-led, transparent formulations | Scaling | Serums, actives, sunscreen |
| Sugar Cosmetics | Color cosmetics, bold-shade range | Testing | Lipstick, kajal, foundation |
| US incumbents (benchmark) | Naturals & DTC-native majors | Entrenched | Full-range skincare & hair |
Illustrative competitive set for methodology demonstration; tiers and categories are samples, not a ranking of actual market position.
A marketplace benchmark is only as good as the signals behind it. To build a report like this, Actowiz Metrics scrapes public, listing-level data across the full competitive set on a recurring cadence — the same Amazon product data scraping discipline it applies across quick-commerce and marketplace intelligence — then normalizes it into comparable metrics. The core signals are:
Every metric is derived from publicly visible marketplace data, aligned with GDPR principles, and contains no personal data — the same discipline Actowiz Metrics applies across its quick-commerce and digital-shelf intelligence work.
Each signal above comes from structured data extraction against public Amazon US listings. To scrape Amazon beauty data at benchmark quality, Actowiz Metrics runs a resilient, compliant data-extraction pipeline that captures price, rank, review, Buy Box, and availability fields for every ASIN in the competitive set, de-duplicates and normalizes them, and refreshes on a schedule the brand defines — daily, weekly, or intraday. The result is a clean beauty-marketplace dataset a brand can plug straight into its own dashboards or BI stack, rather than a one-off export. Because every field is scraped from public product pages, the dataset carries no personal data and stays GDPR-aligned.
Price is the first place an Indian entrant either builds or burns margin. Indian beauty brands often enter the US with a value-versus-premium tension: the instinct is to undercut incumbents, but the diaspora buyer and the US naturals shopper both associate a credible price with a credible formulation. The illustrative benchmark below shows how a single hero category — vitamin-C face serum — might compare across the set.
| Brand (illustrative) | List price | Effective price/oz | Coupon / deal | Price index vs category |
|---|---|---|---|---|
| Mamaearth | $18.99 | $18.99 | 10% coupon | 92 |
| WOW Skin Science | $16.50 | $16.50 | Lightning deal | 80 |
| mCaffeine | $21.00 | $21.00 | None | 102 |
| Minimalist | $22.99 | $22.99 | Subscribe & save | 112 |
| US incumbent avg. | $20.60 | $20.60 | Varies | 100 |
Illustrative prices for a 1.0 oz vitamin-C serum; price index = brand price ÷ category average × 100. Sample data for demonstration.
The pattern this kind of view exposes is strategic, not cosmetic. A brand priced at an index of 80 is signaling value and may win price-sensitive search, but risks looking “cheap” next to ingredient-led incumbents. A brand at 112 is claiming premium — a claim the reviews and imagery must then justify. The point of continuous price tracking is to catch the moment a competitor’s coupon quietly resets the category’s effective price and erodes your conversion.
On Amazon US, the search result is the shelf. If an Indian brand does not appear on page one for its hero keywords, no amount of brand equity from India will rescue the US launch. Share of search measures the percentage of top results — organic and sponsored — that a brand owns across a defined keyword basket. The illustrative view below shows how thin the margin can be for a scaling entrant.
| Keyword cluster (illustrative) | Top-20 organic share | Sponsored presence | Gap vs leader |
|---|---|---|---|
| “natural vitamin c serum” | 6% | Yes | –14 pts |
| “caffeine body scrub” | 19% | Yes | –3 pts |
| “onion hair oil” | 24% | Yes | Leader |
| “toxin-free baby lotion” | 11% | No | –9 pts |
| “apple cider vinegar shampoo” | 17% | Yes | –6 pts |
Illustrative share-of-search snapshot for a single brand across a keyword basket. Sample data for demonstration.
The actionable story here is category-specific. An Indian brand may lead a niche it effectively created in the US (onion hair oil is a classic example of an India-origin benefit traveling well) while being nearly invisible in a broad, contested term like “natural vitamin c serum”. Knowing which keywords to defend and which to concede — and where a single sponsored push would move the needle — is the difference between an efficient US media budget and a wasted one.
Reviews are the compounding asset of a US marketplace launch. An Indian brand that arrives with a strong Indian review base cannot transfer it to the US catalog, so the US review count effectively starts near zero — and review velocity, not just the star rating, becomes the signal to watch. The illustrative benchmark shows why a high rating on a thin base is fragile.
| Brand (illustrative) | Avg. rating | US review count | New reviews / week | Trust momentum |
|---|---|---|---|---|
| Mamaearth | 4.3 | 12,400 | ~210 | Strong |
| WOW Skin Science | 4.2 | 9,800 | ~160 | Strong |
| mCaffeine | 4.1 | 2,300 | ~55 | Building |
| Minimalist | 4.4 | 1,100 | ~30 | Early |
| US incumbent avg. | 4.3 | 28,000 | ~240 | Entrenched |
Illustrative ratings and review velocity. Sample data for demonstration; not actual review counts.
Two insights fall out of a view like this. First, the scaling brands (mCaffeine, Minimalist) carry a review-base disadvantage of an order of magnitude against incumbents, which means their conversion is far more sensitive to a handful of negative reviews. Second, review velocity is the leading indicator: a brand adding 210 reviews a week is compounding trust faster than its star rating alone suggests, and that momentum — tracked weekly — is where an enterprise brand should set its US launch KPIs.
For a brand shipping inventory across an ocean, availability is a margin and ranking issue at once. An out-of-stock ASIN loses its organic rank and hands the category to a competitor; an unauthorized third-party seller on your listing can win the Buy Box at a price that breaks your US pricing strategy. The illustrative snapshot below shows the kind of exposure continuous monitoring surfaces.
| Signal (illustrative) | Entrant brand | US incumbent avg. | Risk flag |
|---|---|---|---|
| In-stock rate (30-day) | 91% | 98% | Stockout risk |
| Buy Box ownership | 88% | 99% | 3P leakage |
| Avg. sellers per hero ASIN | 2.4 | 1.1 | Unauthorized sellers |
| Listing content completeness | 82% | 96% | A+ / imagery gaps |
Illustrative availability and Buy Box signals. Sample data for demonstration.
A 7-point in-stock gap and a visible third-party-seller presence are exactly the issues that quietly cap a US launch. They are also invisible without daily listing-level monitoring — by the time they show up in a sales report, the rank and the Buy Box are already lost.
The fastest-moving shelf signal in 2026 is one that did not exist a few years ago. US shoppers increasingly ask an AI assistant to recommend “the best natural vitamin C serum” or “a good caffeine scrub for under $20”, and the brands named in those answers capture demand before the shopper ever reaches a search bar. Actowiz Metrics tracks Share of AI — how often each brand appears in AI-generated product recommendations — as a distinct metric, because it does not move in lockstep with organic search rank.
For Indian beauty brands this is both a risk and an opening. The risk is being absent from AI answers that incumbents dominate. The opening is that AI recommendation surfaces reward clearly structured, well-reviewed, benefit-specific listings — and an India-origin niche benefit (caffeine, onion, Ayurvedic actives) can earn an outsized AI mention if the listing is built for it. Measuring Share of AI early is how a brand turns this emerging layer into a defensible edge.
Most Indian beauty brands enter Amazon US through the diaspora — a warm, name-aware audience that delivers the first wave of reviews and rank. But the diaspora is a launchpad, not a destination. The brands that plateau are the ones that stay a diaspora product; the brands that scale are the ones that convert early diaspora momentum into mainstream discovery before the window closes.
The digital-shelf data shows exactly where that crossover is happening or stalling. A brand whose search share is concentrated in India-origin benefit terms (onion hair oil, kumkumadi, ubtan) but near zero in broad US category terms is still in the diaspora phase. A brand climbing in contested mainstream keywords, picking up reviews from non-diaspora buyers, and appearing in generic AI recommendations is crossing over. Tracking that shift — keyword by keyword, month by month — tells an enterprise brand whether its US media spend is buying real category expansion or just re-reaching the same known audience.
The crossover window matters because it is competitive. Once a US incumbent notices an India-origin niche gaining volume, it launches its own version and buys the keyword. The Indian brand that measured the shelf early, defended its niche, and moved into the mainstream term first is the one that keeps the category it created.
Read together, these five levers point to a clear playbook for an Indian beauty brand scaling on Amazon US:
For a brand with a US marketplace team, the value is not any single number — it is having all five signals, for the full competitive set, refreshed on a cadence fast enough to act on. That is the difference between reporting on a US launch and steering it.
Actowiz Metrics delivers digital-shelf and marketplace intelligence for brands, retailers, and sellers — price and promotion tracking, share of search, availability and Buy Box monitoring, MAP and seller-compliance alerts, ratings and reviews analytics, and Share of AI — all built on public retail data and aligned with GDPR principles. For an Indian beauty brand entering or scaling on Amazon US, that means a single, continuously refreshed view of exactly where you stand against every competitor on every shelf signal that moves the Buy Box.
Indian beauty D2C has the product, the positioning, and the diaspora demand to win share on Amazon US. What separates the brands that scale from the ones that stall is not ambition — it is the discipline of measuring the digital shelf continuously and acting on it faster than the competition. Price, search, reviews, availability, and Share of AI are the five levers, and each one is visible in public marketplace data today. The brands that treat that data as a weekly operating system, not a quarterly report, are the ones that will define the next chapter of India’s beauty export story.
Expert blogs, research reports and infographics — practical, data-driven reading across e-commerce and quick-commerce.
Most fields are optional — the more you share, the better your sample.
.webp "infographics")
.webp "infographics")