BLOG




















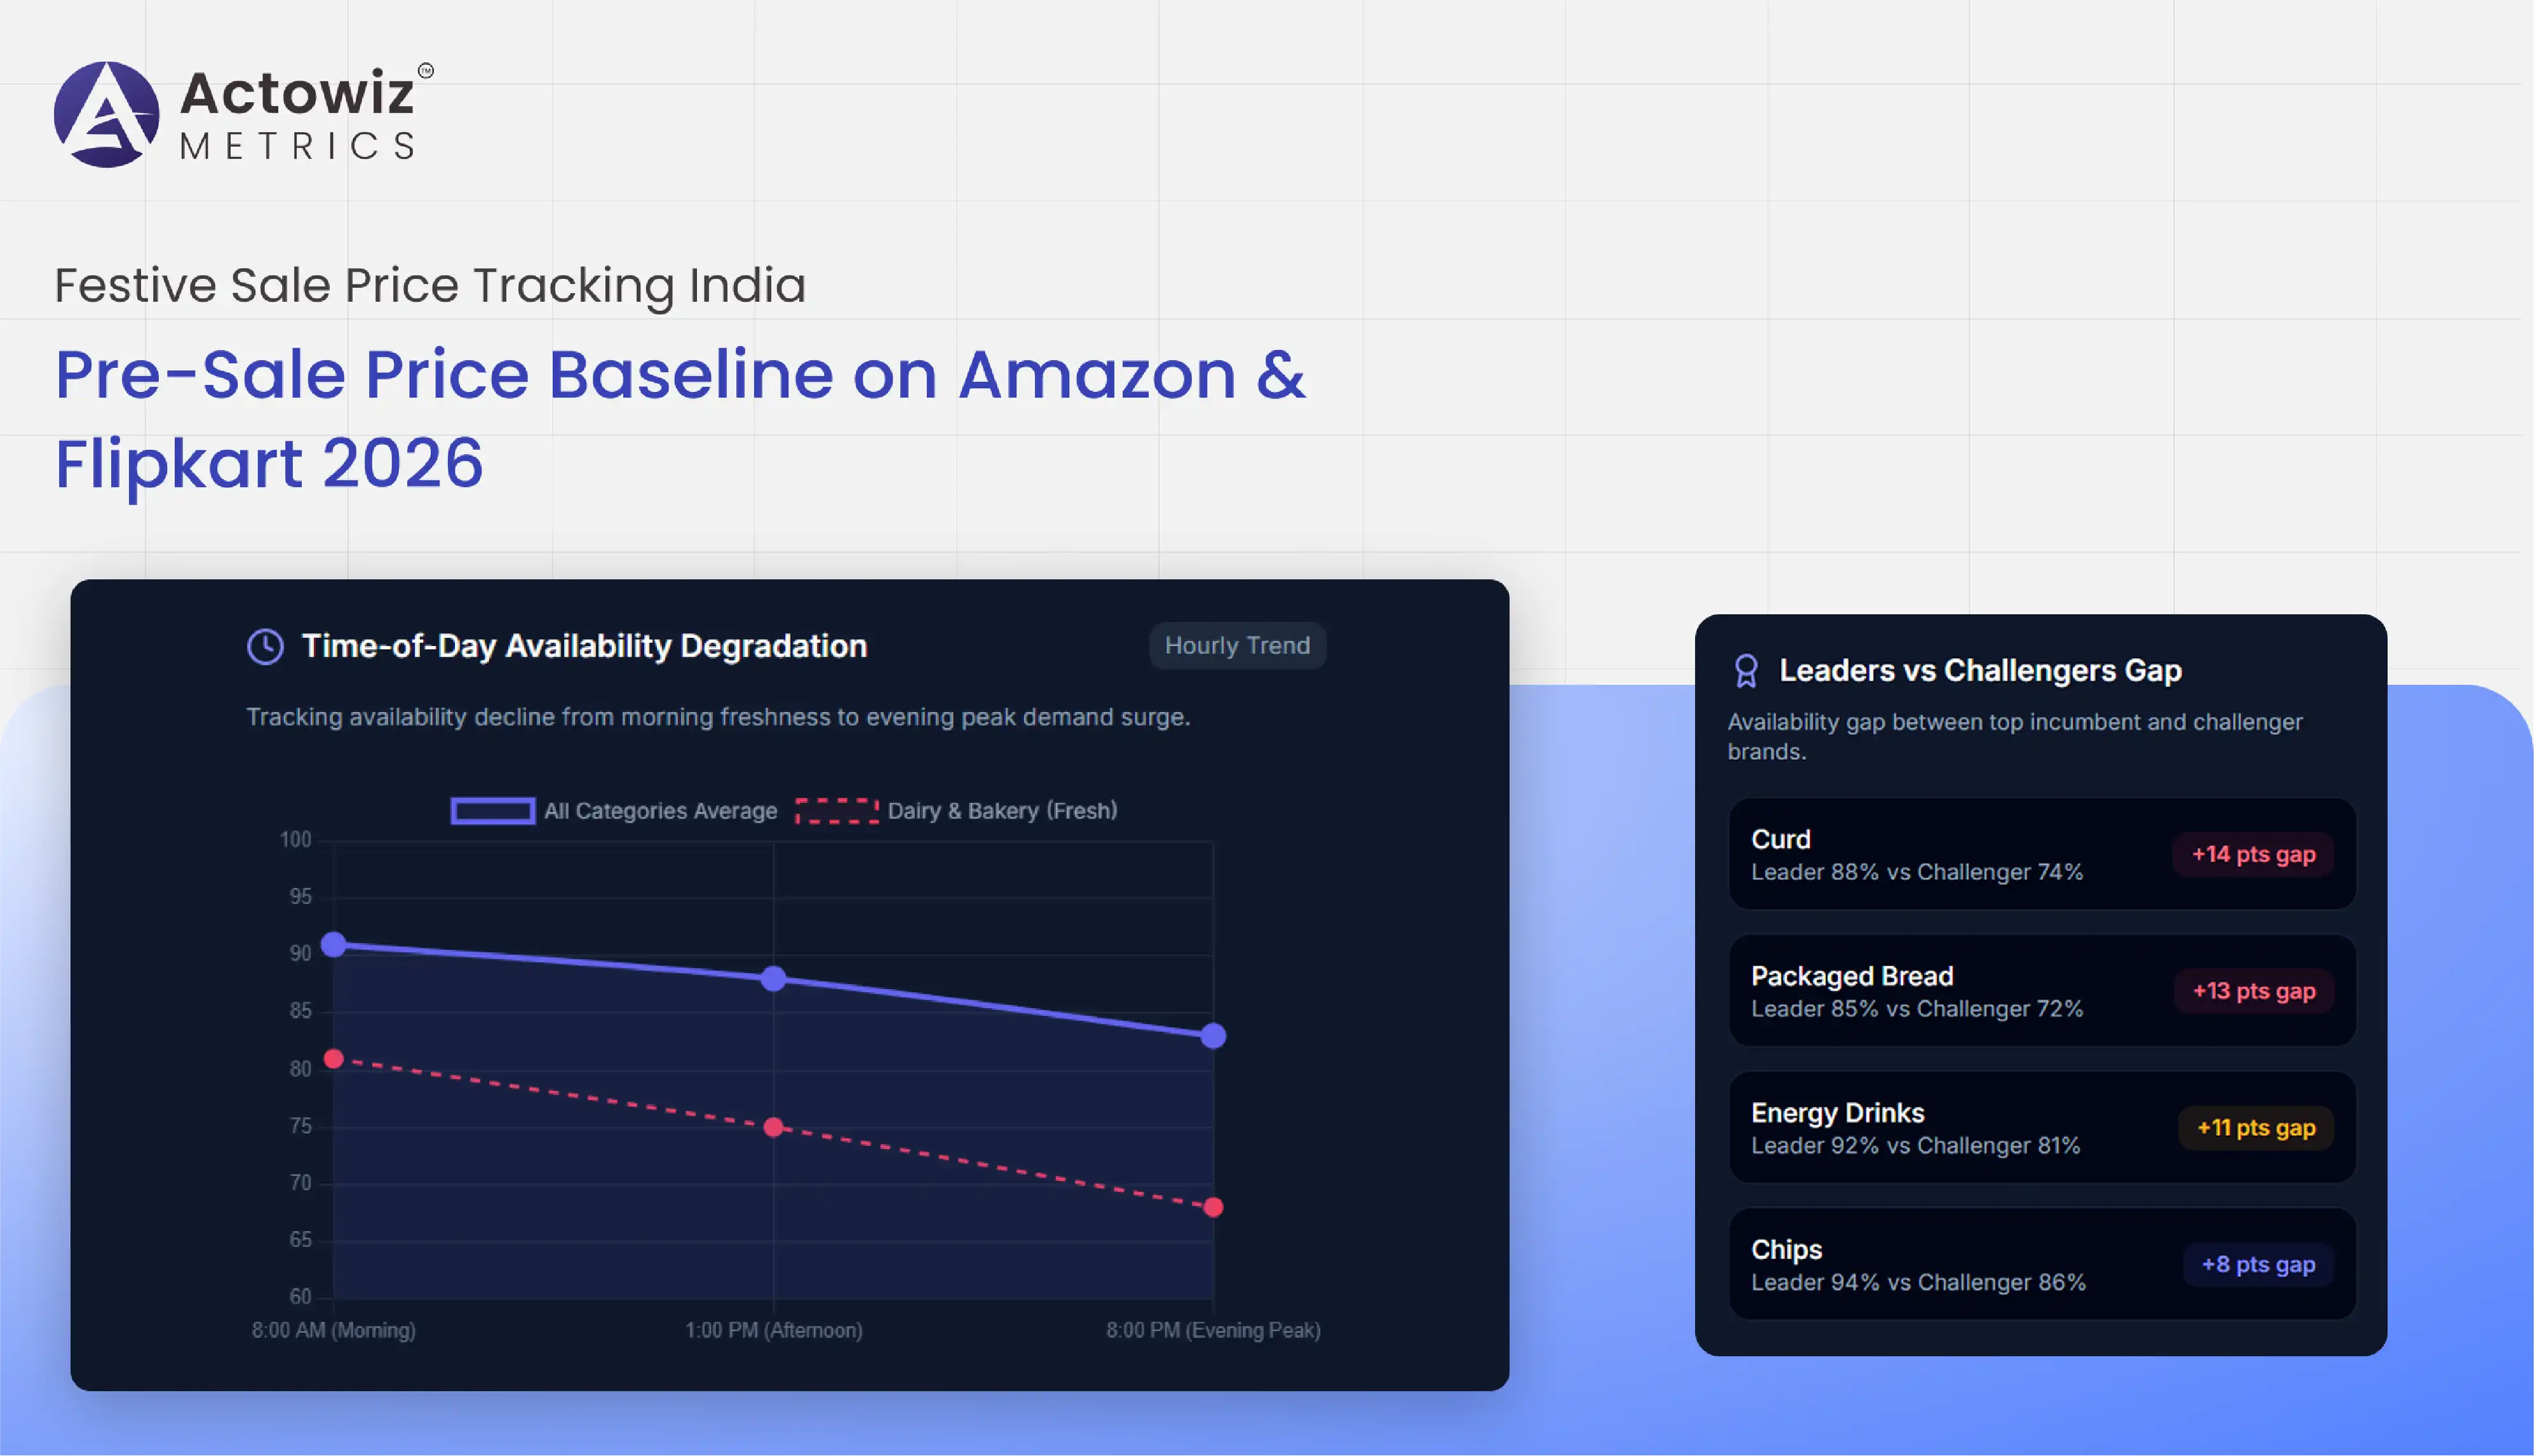
India's festive shopping season creates significant opportunities for brands and sellers, but competitive pricing makes it difficult to determine whether advertised discounts represent genuine savings. festive sale price tracking India enables businesses to record product prices before major campaigns, compare marketplace listings, and measure promotional changes against a consistent historical baseline. For Amazon and Flipkart sellers, this research can support better pricing decisions, competitor analysis, and campaign planning.
The importance of this analysis is reflected in the scale of festive e-commerce. RedSeer reported that India's first-leg festive online retail gross merchandise value (GMV) increased from $3.1 billion in 2020 to $6.2 billion in 2024. Its analysis also estimated approximately $14 billion in gross GMV across the full 2024 festive period. These figures describe overall market activity—not individual product prices or the discount levels on either marketplace. Source: RedSeer's 2024 festive e-commerce report
For 2026, Consumer electronics analytics and Fashion & apparel analytics can help brands understand category-specific price movements, product availability, seller competition, and promotional timing. By combining historical market indicators with current, timestamped product observations, businesses can build a defensible pre-sale price baseline and compare it with actual campaign prices.
Research methodology: Historical market statistics in this report come from published industry research and marketplace announcements. Product-price baselines must be calculated separately using matched product listings collected from Amazon and Flipkart. Full-year 2026 figures are not presented as final where the festive season or reporting period is incomplete.
A dependable India festive sale 2026 pre-sale price tracking study begins well before promotional campaigns launch. The objective is to establish what products typically cost before sale-related price changes, coupons, bank offers, and limited-time deals influence displayed prices. Without this reference period, a brand may mistake a normal price fluctuation for a significant discount.
The festive sale price tracking India process should capture product titles, model numbers, seller details, listed prices, available coupons, stock status, shipping charges, and observation timestamps. Researchers should collect observations at consistent intervals and maintain the same product identifiers throughout the study. For products with several variants, such as smartphones with different storage capacities or clothing in multiple sizes, each variant should be tracked separately.
Published historical market figures demonstrate why the baseline matters. According to RedSeer's 2024 report, first-leg festive online retail GMV rose from $3.1 billion in 2020 to $6.2 billion in 2024. That expansion indicates a larger promotional environment, but it does not establish how much any individual product's price declined. RedSeer report
| Year | First-leg festive online retail GMV | Reported year-on-year growth |
|---|---|---|
| 2020 | $3.1 billion | 30% |
| 2021 | $3.8 billion | 22% |
| 2022 | $4.7 billion | 24% |
| 2023 | $5.5 billion | 19% |
| 2024 | $6.2 billion | 12% |
| 2025 | Not included in this comparable historical series | Separate reporting required |
| 2026 | Full-year festive period not yet complete | Final figure unavailable |
Source: RedSeer's published 2024 festive e-commerce report. Values refer to the first leg of festive sales, not the entire festive season.
For the 2026 study, researchers should define a fixed pre-sale window, calculate the median observed price, and retain minimum and maximum values. The median is generally more robust than selecting a single high price as the reference. The report should also disclose missing observations and distinguish unavailable listings from genuine price increases.
The Amazon & Flipkart festive sale price baseline India framework should compare equivalent products rather than listings that merely share similar titles. Product specifications, model numbers, seller identities, warranty terms, pack sizes, and included accessories can all affect the final purchase cost. A smartphone with 128 GB storage should not be compared directly with a 256 GB version, and a bundled appliance should not be treated as identical to a standalone product.
Researchers should record the listed price and any additional benefits separately. Bank discounts, exchange bonuses, loyalty-member prices, and conditional coupons can make an offer attractive, but their eligibility requirements differ. A comparison should therefore show the standard listed price alongside the effective price available under clearly defined conditions.
RedSeer estimated that India's full 2024 festive e-commerce period generated approximately $14 billion in gross GMV, with around 12% year-on-year growth. Its first-leg estimate was approximately $6.2 billion across an 11-day event. The different totals reflect different reporting windows and should not be combined as if they measure the same period. RedSeer's 2024 report
| Comparison metric | Amazon listing | Flipkart listing | Research purpose |
|---|---|---|---|
| Product model | Record exact model | Record exact model | Ensure product equivalence |
| Pre-sale listed price | Capture dated observations | Capture dated observations | Establish reference prices |
| Sale-period price | Record campaign observations | Record campaign observations | Measure observed changes |
| Coupon or bank offer | Record terms and eligibility | Record terms and eligibility | Separate conditional savings |
| Delivery cost | Capture where applicable | Capture where applicable | Estimate comparable delivered cost |
| Seller and availability | Record seller and stock status | Record seller and stock status | Explain listing differences |
The final report should calculate the difference between the two marketplaces using matched observations and consistent time windows. It should also identify products with missing variants, changed sellers, or conditional pricing so the results remain transparent and useful.
Electronics are important candidates for pre-sale research because product specifications, seller competition, financing, and promotional offers can influence the final price. Electronics festive sale price tracking India 2026 should prioritise smartphones, televisions, laptops, tablets, headphones, and home appliances with identifiable model numbers. Researchers should track the same configuration across the observation period and flag discontinued products or model replacements.
Using festive sale price tracking India methods, analysts can calculate median pre-sale prices, sale-period changes, price ranges, and the frequency of price updates. They should distinguish the headline price from effective prices that depend on a particular bank card, exchange, or financing arrangement.
Published 2025 results provide useful context. RedSeer reported that online retail GMV grew by approximately 23%–25% during the first two days of festive sales in 2025 compared with the same period in 2024. Its report also noted that large televisions and washing machines benefited from GST changes, with early data indicating a 6%–8% reduction in MRPs for leading television brands before additional festive discounts. These figures relate to early campaign performance and reported MRP changes, not a universal reduction across all electronics. RedSeer, September 25, 2025
| Year | Published market indicator | How it informs price research |
|---|---|---|
| 2020 | First-leg festive online retail GMV: $3.1 billion | Historical market context |
| 2021 | First-leg GMV: $3.8 billion | Compare market expansion with available product records |
| 2022 | First-leg GMV: $4.7 billion | Review changes in category and seller coverage |
| 2023 | First-leg GMV: $5.5 billion | Examine price histories for consistently matched products |
| 2024 | First-leg GMV: $6.2 billion | Use as market context, not a price baseline |
| 2025 | First two festive-sale days recorded 23%–25% online retail GMV growth year on year, according to RedSeer | Investigate timing of product-price changes |
| 2026 | Final full-season figures not yet available | Record actual pre-sale and campaign observations |
Historical GMV figures: RedSeer's 2024 report. The 2025 figure uses a different reporting window and is not directly comparable with annual first-leg GMV.
For 2026, the strongest findings will come from product-level evidence: the proportion of tracked models whose prices changed, median percentage changes, and differences between standard prices and eligible promotional prices. This helps brands identify competitive products without treating market-wide sales growth as proof of individual discounts.
Fashion listings require careful matching because sizes, colours, fabrics, designs, and seller-specific availability can produce different prices within the same product family. Fashion festive sale pre-sale price tracking India 2026 should track variants wherever possible and organise products into comparable groups such as ethnic wear, western apparel, footwear, accessories, handbags, and occasion wear.
Historical market evidence suggests that category performance can vary substantially across festive periods. RedSeer's 2024 analysis reported that fashion grew 28% during the festive event, compared with 9% growth for mobile phones and 24% for electronics. These are category-level growth rates reported for that festive period, not discount percentages. The report also identified ethnic apparel and accessories as contributors to fashion demand. RedSeer's 2024 festive report
| Year | Published indicator | Implication for apparel price research |
|---|---|---|
| 2020 | First-leg festive GMV: $3.1 billion across online retail | Build historical product coverage where records exist |
| 2021 | First-leg festive GMV: $3.8 billion | Check listing continuity across seasons |
| 2022 | First-leg festive GMV: $4.7 billion | Standardise size and pack comparisons |
| 2023 | First-leg festive GMV: $5.5 billion | Compare matching styles and sellers |
| 2024 | Fashion category growth reported at 28% during the festive event | Analyse category-level price changes alongside demand |
| 2025 | RedSeer reported early traction in mid-market apparel priced at ₹1,000–₹2,500 during the first two festive-sale days | Track prices by product and price tier |
| 2026 | Full-season category results unavailable | Establish a current baseline and update during the campaign |
Sources: RedSeer's 2024 report and its September 2025 festive-sale analysis. GMV growth and product price reductions are different measures.
A useful apparel baseline records the median price by product variant, available size range, seller, and observation date. When an item becomes unavailable, researchers should not automatically treat its replacement as the same product. Likewise, a "starting from" price should be checked against the variants actually available.
The final report should state the percentage of listings with complete variant matches and the number of products included in each subcategory. This makes it easier to assess whether apparent price changes reflect genuine repricing, assortment changes, or stock availability.
Home and living products include kitchenware, storage, bedding, furniture, lighting, décor, and household appliances. Home category price comparison before India festive sale 2026 should begin by defining product groups and standardising the details that determine comparability. These may include dimensions, material, pack quantity, model, included accessories, delivery charges, and installation requirements.
Historical category research offers a reason to monitor these products separately. RedSeer's 2024 festive analysis identified growth in home décor and furnishings during the festive period and noted demand for products such as lamps, wallpapers, and furnishings. This indicates areas worth investigating, but it does not establish a specific discount rate for any home product. RedSeer report
| Year | Published market context | Suggested home-category analysis |
|---|---|---|
| 2020 | First-leg festive GMV: $3.1 billion | Check availability of archived home-product listings |
| 2021 | First-leg festive GMV: $3.8 billion | Improve product identification and specification matching |
| 2022 | First-leg festive GMV: $4.7 billion | Separate bundles from standalone items |
| 2023 | First-leg festive GMV: $5.5 billion | Record seller and delivery differences |
| 2024 | Full festive e-commerce GMV estimated at approximately $14 billion | Examine home and décor trends alongside product prices |
| 2025 | Early festive-sale research highlighted demand changes across multiple categories | Track comparable home listings through the campaign |
| 2026 | Full-season market figures unavailable | Collect dated pre-sale and sale-period prices |
Sources: RedSeer's 2024 festive report and historical GMV series. The table does not represent home-category price reductions.
For each product group, analysts should calculate the median baseline price and compare it with campaign-period observations. Shipping and installation charges should be documented separately, especially for bulky goods. A low listed price may not represent the lowest delivered cost if a competitor includes delivery or assembly.
Researchers should also record whether a product was available throughout the comparison window. A listing that disappears during the campaign should be marked unavailable, rather than being interpreted as a price increase. These checks help brands distinguish real pricing movement from assortment changes and improve the reliability of category-level conclusions.
India e-commerce pre-sale discount benchmarking should use a consistent calculation method and preserve the underlying observations. A useful starting point is the median price recorded over a defined pre-sale period. During the campaign, researchers compare the observed price with that baseline while documenting coupons, seller changes, shipping fees, and other conditions.
The formula is:
Price change (%) = [(Sale-period price − Pre-sale baseline price) ÷ Pre-sale baseline price] × 100
A negative result indicates that the sale-period price is below the baseline; a positive result indicates that it is higher. This is a measured change relative to the selected baseline, not necessarily the official discount shown on a marketplace.
Recent market results underline why timing matters. Amazon reported that its 2025 Great Indian Festival generated more than 276 crore customer visits, with 70% of traffic coming from Tier 2 and Tier 3 cities. The company also reported that customers saved nearly ₹1,000 crore through bank offers, GST benefits, and cashback rewards during the event. These are Amazon-reported campaign figures, not independent measurements of product-level price reductions. Amazon India, Great Indian Festival 2025
| Research period | Benchmarking activity | Required evidence |
|---|---|---|
| 2020–2022 | Review historical records where available | Product ID, date, source |
| 2023–2024 | Standardise matching and calculations | Matching rules, price fields |
| 2025 | Validate the method against completed-season records | Sample size and exceptions |
| 2026 pre-sale | Establish a dated baseline | Repeated observations and median price |
| 2026 sale | Compare observed prices with the baseline | Sale price and percentage change |
| Post-sale review | Document results and limitations | Data coverage, missing listings, methodology |
This is a recommended research workflow. Historical years do not imply that complete product-level price records exist for every marketplace.
The final dashboard should include median price changes, category comparisons, seller-level differences, conditional offers, and the proportion of products with complete histories. Researchers should preserve timestamps and original observations so results can be audited.
For 2026, early marketplace announcements can provide timely context, but they should not be mixed with full-season statistics from earlier years without clear labels. A defensible report distinguishes published market figures from newly collected product-level observations and explains exactly how each metric was calculated.
Actowiz Metrics helps businesses organise marketplace information into structured datasets for competitive research, price analysis, and seasonal reporting. With Amazon analytics, teams can examine product listings, seller activity, observed prices, and promotional changes across a defined product set. A repeatable festive sale price tracking India process can help businesses establish reference prices before campaigns begin and compare them with dated observations during major sale events.
A well-designed research workflow also identifies product-matching gaps, stock changes, and conditional offers that could distort comparisons. By separating verified market statistics from collected product-level data, businesses can create reports that are transparent and easier to interpret. This supports more informed pricing reviews, promotional planning, and competitor monitoring across key product categories.
A reliable festive-sale report begins with a documented pre-sale baseline, consistent product matching, and repeated observations from Amazon and Flipkart. Historical data shows that India's festive e-commerce market has expanded substantially, while recent reports highlight the importance of category performance, customer engagement, and promotional timing. However, overall market growth should never be mistaken for a product-specific discount.
Combining Flipkart analytics with a structured festive sale price tracking India framework helps brands compare observed prices, identify changes, and evaluate campaign performance using transparent methods. As 2026 data develops, businesses should update the report with verified observations and clearly label incomplete periods.
Ready to build a stronger festive pricing strategy? Contact Actowiz Metrics to discuss a tailored marketplace data solution for Amazon, Flipkart, product-level price baselines, and competitor monitoring!
A pre-sale price baseline is a reference price calculated from dated observations collected before a campaign. It helps businesses measure later price changes without relying solely on advertised discounts.
Start with high-priority products that have stable model identifiers, strong competitor overlap, and sufficient listing availability. Electronics, fashion, and home categories can be analysed separately for better comparisons.
Frequency depends on volatility and business needs. Daily observations may suit many products, while highly competitive products may require more frequent checks during the days immediately before a major sale.
No. Gross merchandise value measures the value of merchandise sold within a defined period. It does not directly reveal the price reduction for an individual product or seller.
Actowiz Metrics can help businesses structure marketplace data collection and analysis around defined products, categories, and time windows. The methodology should document matching rules, observation dates, and limitations.
Expert blogs, research reports and infographics — practical, data-driven reading across e-commerce and quick-commerce.
Most fields are optional — the more you share, the better your sample.

.webp "infographics")
.webp "infographics")