BLOG




















India's quick-commerce ecosystem has evolved from a limited urban convenience service into a distributed retail infrastructure spanning hundreds of cities and thousands of hyperlocal fulfilment points. The growth of dark stores has been central to this transformation because delivery speed depends on placing inventory close to consumer demand. In 2020, quick commerce was still emerging, with most rapid-delivery models concentrated in select metropolitan areas. By 2024, major platforms were operating thousands of dark stores collectively, while 2025 marked an aggressive push into Tier 2 and Tier 3 cities.
The Indian Quick Commerce Dark-Store Coverage and Availability Benchmark provides a framework for evaluating how effectively this infrastructure reaches consumers across cities, neighbourhoods, delivery zones, and pincodes. It examines not only the number of stores but also their geographic density, serviceability, assortment availability, and potential market gaps.
The analysis also uses Quick commerce analytics to connect store expansion with service coverage, competitive positioning, assortment depth, and consumer accessibility. Publicly mapped data indicates that five major platforms collectively had 5,625 dark stores across 408 cities and 26 states as of July 2026.
India's dark-store network developed rapidly between 2020 and 2026. During the early phase, operators concentrated on dense metropolitan neighbourhoods where high order frequency could justify small fulfilment centres. As consumer adoption increased, platforms began expanding store density within existing cities while simultaneously entering new markets.
The evolution can be understood as a shift from city entry → neighbourhood penetration → network densification → assortment expansion. In FY2024, leading quick-commerce companies collectively operated around 1,800 dark stores. By 2026, public mapping across five major platforms identified 5,625 stores.
The Indian Quick commerce dark store mapping approach therefore needs to measure both absolute store numbers and the geographic relationship between stores and consumer demand. A city with 100 stores may still have weak coverage if those locations are concentrated in a few affluent neighbourhoods.
| Year | Market Development | Coverage Trend |
|---|---|---|
| 2020 | Early rapid-delivery experimentation | Concentrated urban coverage |
| 2021 | Consumer adoption accelerates | Expansion within major metros |
| 2022 | Major platforms scale operations | Higher neighbourhood density |
| 2023 | Competition intensifies | More dark stores per major city |
| 2024 | Around 1,800 stores operated by leading players | Strong metropolitan penetration |
| 2025 | Aggressive Tier 2/Tier 3 expansion | Rapid geographic diversification |
| 2026 | 5,625 stores mapped across five platforms | 408 cities and 26 states |
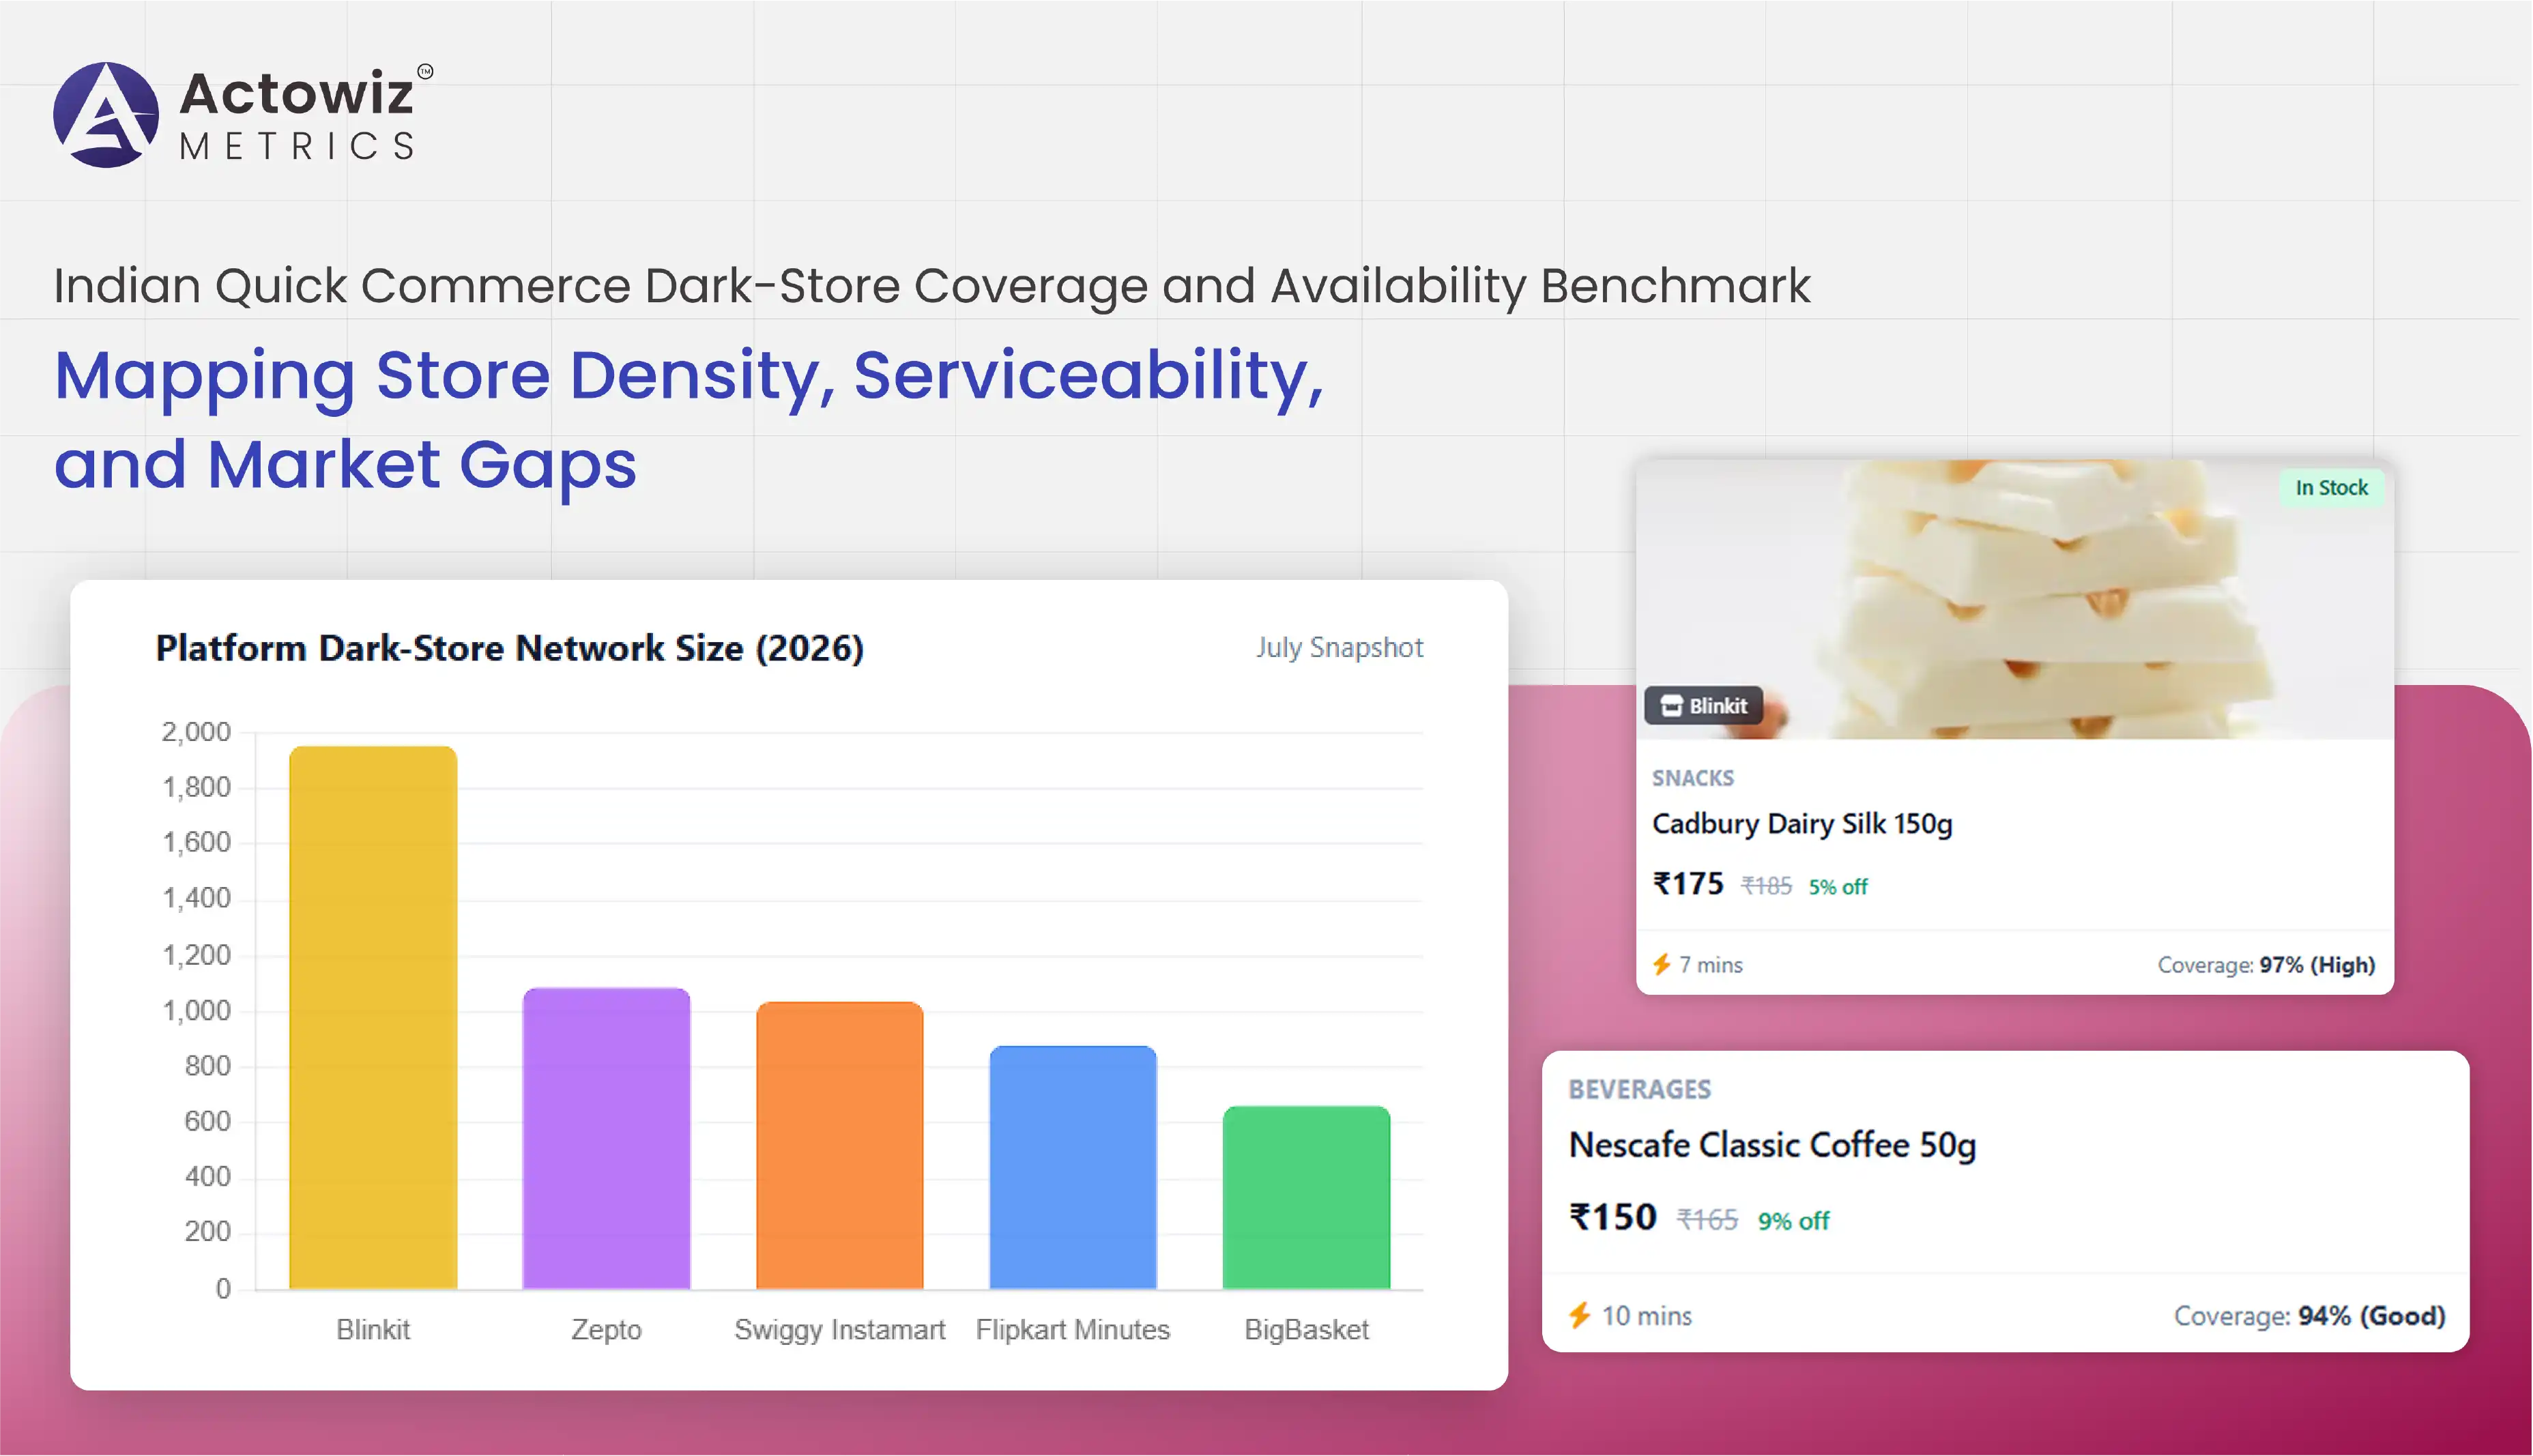
The 2026 network is significantly broader than the infrastructure available during the category's formative years. QuickCommerceMap reports 1,955 Blinkit stores, 1,088 Zepto stores, 1,038 Swiggy Instamart stores, 880 Flipkart Minutes stores, and 664 BigBasket stores in its July 2026 snapshot.
For retailers and brands, this expansion creates an opportunity to compare where competitors have established strong fulfilment density and where market access remains limited.
Dark-store expansion is not uniform across India. Metropolitan markets continue to account for a substantial share of infrastructure, while Tier 2 cities increasingly represent the next growth layer. This makes geographic market intelligence important for understanding competitive saturation and identifying locations where consumer demand is developing faster than fulfilment capacity.
The India Dark store market intelligence perspective goes beyond counting stores. It considers platform presence, store density, city size, neighbourhood penetration, category availability, and competitive overlap. A city may have multiple platforms operating simultaneously, while another city may have only one or two providers.
Publicly mapped 2026 data shows that the top 15 cities account for approximately 61% of mapped dark stores, demonstrating that quick commerce remains heavily concentrated in major urban markets despite nationwide expansion. Bangalore alone reportedly accounts for 629 stores, while Delhi and Hyderabad also represent major clusters.
| Metric | 2026 Benchmark |
|---|---|
| Dark stores mapped | 5,625 |
| Cities covered | 408 |
| States covered | 26 |
| Neighbourhood clusters | 2,843 |
| Leading platform | Blinkit |
| Blinkit stores | 1,955 |
| Zepto stores | 1,088 |
| Swiggy Instamart stores | 1,038 |
| Flipkart Minutes stores | 880 |
| BigBasket stores | 664 |
The competitive picture changed particularly quickly during 2025. Swiggy Instamart, for example, increased its network to 1,021 active dark stores by Q4 FY2025, while Blinkit had 1,301 and Zepto had more than 750 according to reported company figures.
This demonstrates why market analysis should track both network size and network momentum. A competitor with fewer stores today may be expanding faster and could materially alter market coverage within a short period.
A dark store only creates commercial value when its inventory can effectively serve surrounding consumers. Consequently, geographic store presence needs to be connected with delivery zones, serviceability boundaries, and customer access.
Delivery zone and store coverage analytics helps businesses determine whether dark-store locations adequately cover demand areas. The analysis can identify overlapping service zones, underserved neighbourhoods, areas with excessive store density, and locations where a single fulfilment centre carries disproportionate demand.
This became increasingly important between 2023 and 2026. As platforms entered new cities, they moved from simply establishing a presence to optimising delivery density. Swiggy stated that its expansion strategy involved geographical coverage, densification, hyperlocal selection, and network utilisation. By Q3 FY2026, Instamart reported 1,136 active dark stores across 131 cities, with approximately 4.8 million square feet of active dark-store area.
| Period | Primary Coverage Objective | Operational Focus |
|---|---|---|
| 2020–2021 | Establish urban presence | Basic service zones |
| 2022 | Increase neighbourhood reach | Store proximity |
| 2023 | Improve delivery density | Zone optimisation |
| 2024 | Expand metropolitan coverage | Network scale |
| 2025 | Enter Tier 2/Tier 3 cities | New delivery zones |
| 2026 | Optimise established networks | Density + utilisation |
Serviceability benchmarking can also reveal competitive differences within the same city. Two platforms may both advertise coverage in a city but serve different pincodes. One may dominate central neighbourhoods while another covers peripheral residential zones.
This distinction matters to consumer brands because availability is ultimately determined at the local level. A brand listed on a platform nationally may still have limited practical availability if its products are not stocked in the dark stores serving particular customer zones.
Pincode-level analysis provides a more granular view of quick-commerce accessibility than city-level reporting. India's cities contain highly variable population density, income levels, residential patterns, commercial districts, and delivery demand. Consequently, two pincodes within the same city can experience very different quick-commerce availability.
Quick commerce Pincode-level dark store mapping can connect individual fulfilment locations with the pincodes they potentially serve. This allows businesses to build coverage matrices that identify single-platform areas, multi-platform zones, underserved pincodes, and highly competitive clusters.
The importance of this granular view increased as quick commerce moved beyond the largest metros. Swiggy announced expansion to 100 cities in April 2025, adding 32 new cities during the year. The company also reported that one in four new users during 2025 came from Tier 2 or Tier 3 cities.
| Indicator | What It Measures |
|---|---|
| Stores per pincode | Fulfilment density |
| Platforms per pincode | Competitive intensity |
| Average store distance | Potential accessibility |
| Active SKUs | Local assortment depth |
| In-stock rate | Product availability |
| Delivery promise | Service quality |
| Single-platform pincodes | Competitive opportunity |
| Multi-platform pincodes | Market saturation |
A pincode-level dataset can also reveal expansion gaps. For example, a city may show strong overall coverage while several peripheral residential zones remain dependent on one platform. Conversely, dense central areas may have several competing dark stores within a relatively small geographic radius.
For retailers, brands, and investors, this creates a more actionable framework for assessing where additional inventory, partnerships, or fulfilment infrastructure could generate incremental value.
Store coverage does not automatically translate into product availability. A dark store may exist in a consumer's delivery zone while a particular product remains unavailable because of inventory constraints, assortment decisions, replenishment cycles, or local demand differences.
Indian Quick Commerce Availability Monitoring therefore needs to track the relationship between store coverage and SKU-level availability. This can include monitoring whether products appear in search results, whether listings show as in stock, whether prices change by location, and whether the same product is available across competing platforms.
The importance of assortment expansion became particularly visible in 2025–2026. Swiggy's larger "megapods," for example, were designed at approximately 10,000–12,000 square feet and could accommodate up to 50,000 SKUs, around three times the range of a normal dark store.
| Availability Indicator | Strategic Relevance |
|---|---|
| Store presence | Confirms infrastructure reach |
| SKU listing | Measures assortment visibility |
| In-stock status | Measures immediate availability |
| Stockout frequency | Identifies supply gaps |
| Local assortment | Measures regional relevance |
| Price visibility | Supports competitive analysis |
| Delivery promise | Indicates service accessibility |
From 2020 to 2022, availability monitoring was primarily focused on whether quick-commerce services existed in a particular urban area. By 2023–2024, the emphasis shifted toward product-level availability and competitive assortment. During 2025–2026, the increasing number of cities and larger store formats made automated monitoring increasingly important.
For FMCG brands, this data can identify products that are listed nationally but inconsistently stocked locally. For retailers, it can highlight categories where competitors have stronger availability and identify potential assortment opportunities.
The final stage of benchmarking combines physical coverage with digital assortment. A platform can have extensive geographic coverage but still provide limited customer value if its local product selection is narrow. Conversely, a large assortment is less useful when consumers are outside the relevant delivery zone.
Availability & assortment tracking brings these dimensions together by measuring which products are visible and purchasable across individual markets. This enables businesses to compare assortment depth across platforms, cities, pincodes, and store clusters.
The broader Indian Quick Commerce Dark-Store Coverage and Availability Benchmark can consequently be used to establish a unified view of infrastructure and product accessibility. The 2026 market provides a strong example of why this integrated approach matters: five major platforms collectively span 408 cities and 5,625 mapped dark stores, but their networks vary substantially in geographic reach and store density.
| Benchmark Dimension | Coverage Question | Business Application |
|---|---|---|
| Store density | How many fulfilment points exist? | Network comparison |
| City penetration | Which cities are covered? | Expansion analysis |
| Pincode reach | Which local areas are served? | Market-gap identification |
| SKU depth | How broad is the assortment? | Category benchmarking |
| Availability | Which products are in stock? | Stock monitoring |
| Platform overlap | Where do competitors compete? | Competitive intelligence |
| Assortment gaps | Which products are missing? | Portfolio planning |
Between 2024 and 2026, the market increasingly shifted from a pure "10-minute delivery" proposition toward a broader convenience-retail model. Larger dark stores, wider assortments, and expansion into smaller cities indicate that competitive advantage increasingly depends on where the infrastructure exists, what it stocks, and how consistently products remain available.
For brands, this creates opportunities to benchmark product visibility across competing platforms. For retailers and marketplaces, the same data can support network optimisation, category planning, competitor monitoring, and location prioritisation.
Actowiz Metrics can support businesses in converting fragmented quick-commerce observations into structured market intelligence. The objective is not simply to count dark stores, but to connect location, serviceability, availability, assortment, and competitive signals into a usable benchmarking framework.
With Quick Commerce Intelligence, businesses can analyse platform expansion, city-level coverage, pincode-level serviceability, store density, product availability, and assortment differences. Such datasets can help brands understand where products are visible, where competitors have stronger distribution, and where market gaps may exist.
Key applications include:
The combination of these datasets provides a stronger foundation for decisions around assortment, distribution, geographic expansion, competitive positioning, and local market opportunities.
The evolution of India's quick-commerce infrastructure between 2020 and 2026 demonstrates how rapidly dark stores have become an important component of modern retail fulfilment. What began as concentrated urban delivery infrastructure has developed into a network spanning hundreds of cities, with thousands of fulfilment locations and increasingly sophisticated assortment strategies.
The Indian Quick Commerce Dark-Store Coverage and Availability Benchmark provides a structured method for understanding this transformation. By combining store locations, serviceability, pincodes, availability, assortment, and competitive density, businesses can move beyond headline store counts and evaluate the actual accessibility of quick-commerce retail.
The 2026 landscape—with 5,625 mapped stores across 408 cities in the five-platform dataset—also shows why continuous monitoring is essential. Network expansion, new entrants, changing delivery zones, store consolidation, and assortment changes can quickly alter local competitive conditions.
Partner with Actowiz Metrics to transform dark-store, availability, and quick-commerce market data into actionable intelligence for smarter expansion, assortment, and competitive decisions!
Expert blogs, research reports and infographics — practical, data-driven reading across e-commerce and quick-commerce.
Most fields are optional — the more you share, the better your sample.


.webp "infographics")
.webp "infographics")