BLOG




















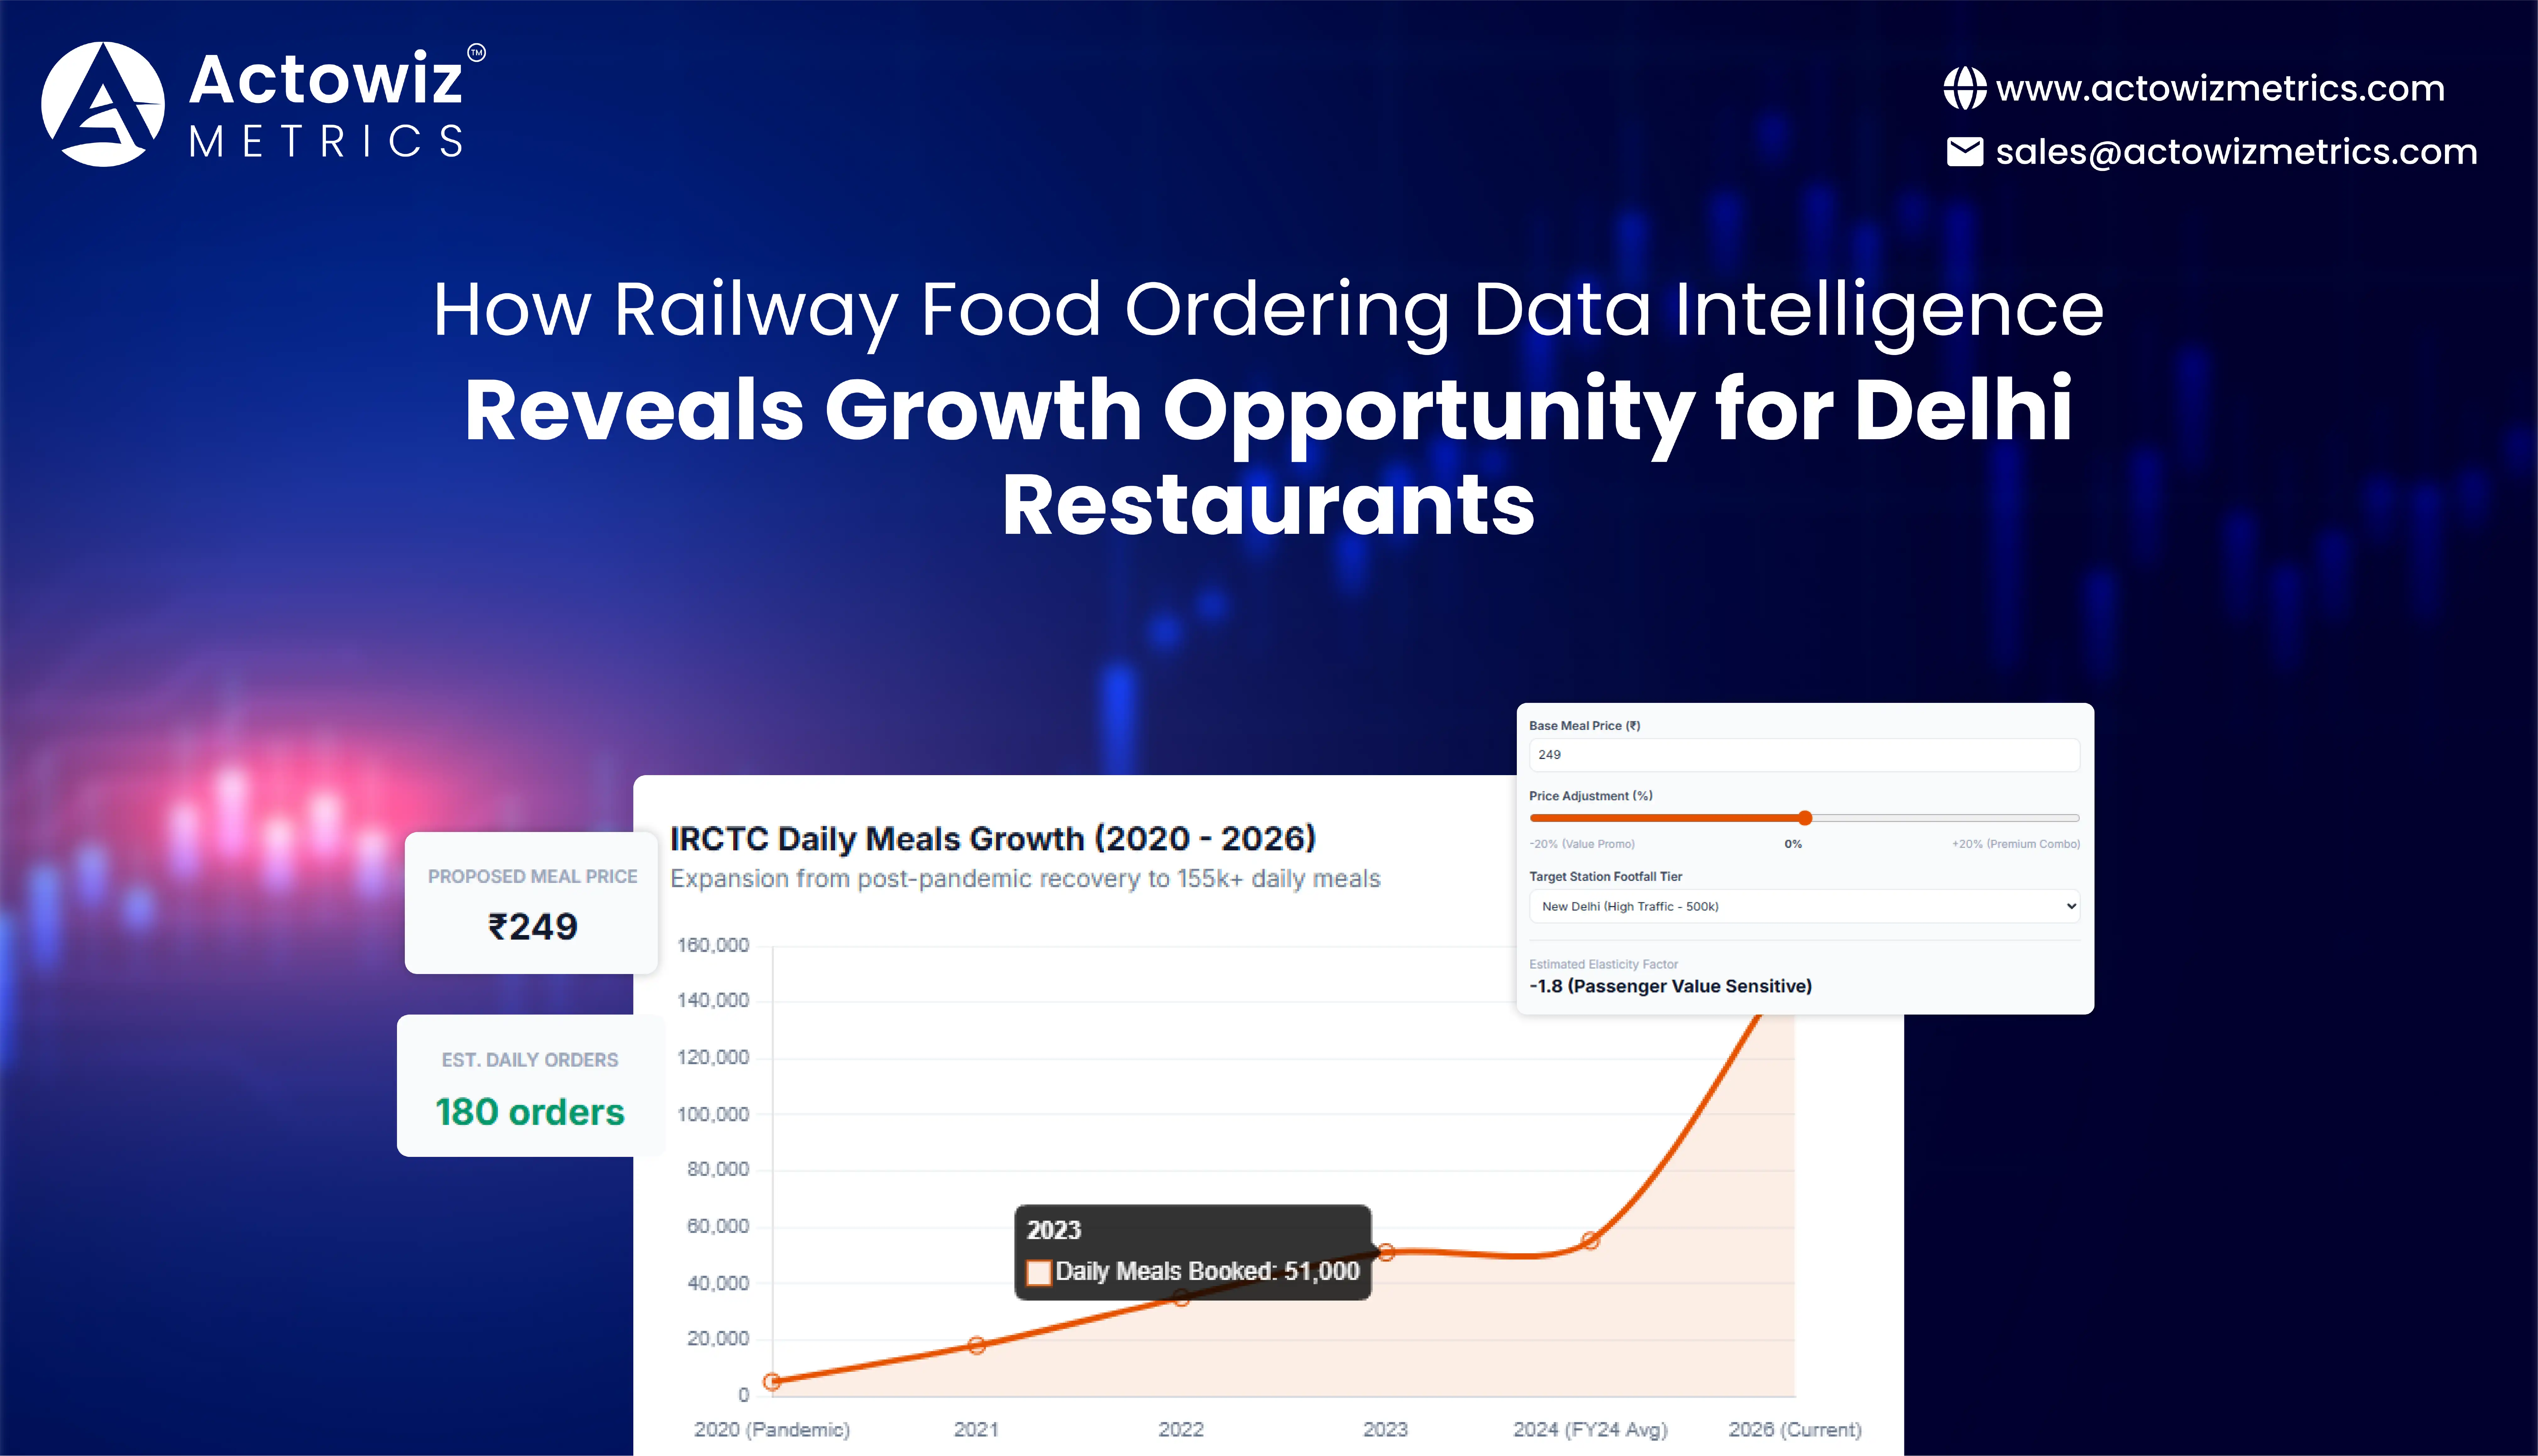
Railway Food Ordering Data Intelligence can help Delhi restaurants identify where train-passenger demand, menu preferences, pricing gaps, and competitive opportunities intersect. By analyzing structured food-ordering data around railway stations and train journeys, restaurants can make better decisions about menus, prices, availability, promotions, and expansion.
The opportunity is significant. IRCTC reported that its e-catering service was operational at approximately 428 stations and averaged about 55,118 meals booked per day in FY2023–24. By April 2026, IRCTC reported more than 155,000 daily meals through its official network, covering over 400 stations, 629+ direct vendors, and 5,600+ outlets managed through appointed food aggregators.
For Delhi restaurants, this creates a specialized customer segment: passengers who need convenient, predictable, hygienic, and appropriately priced food during train journeys.
The objective is not simply to collect food listings. It is to understand what passengers can order, what restaurants offer, how prices change, which categories appear repeatedly, and where Delhi-based food businesses can compete effectively.
Railway food ordering combines three important market characteristics: high passenger movement, time-sensitive consumption, and location-specific demand.
IRCTC's official e-catering platform allows passengers to enter their PNR, explore restaurants available for their journey, select food, schedule delivery, and receive meals at the selected station. Its current platform lists options ranging from thalis and biryani to pizza, burgers, Chinese food, South Indian meals, snacks, combos, and regional cuisines.
This creates a different operating environment from conventional restaurant delivery.
A Delhi restaurant targeting railway passengers must consider:
For a restaurant owner, this means railway ordering data can become a specialized market-research asset.
Train Food Demand Analysis for Delhi Restaurants helps businesses identify which food categories, price ranges, and meal formats may have stronger relevance to railway passengers.
Demand analysis should combine product-level information with station and time dimensions. A restaurant can monitor which products are available at specific stations, how menus differ by location, and which food categories appear most consistently.
IRCTC currently identifies popular e-catering items including thali, pizza, biryani, wraps, aloo paratha, idli, dosa, rice bowls, sandwiches, and dal khichdi.
| Data Point | Business Use |
|---|---|
| Station | Identify delivery markets |
| Food category | Measure category presence |
| Product | Compare menu opportunities |
| Price | Benchmark positioning |
| Availability | Identify supply gaps |
| Restaurant | Map competitors |
| Delivery window | Assess operational feasibility |
| Meal type | Compare breakfast, lunch, snacks, dinner |
| Cuisine | Identify local preferences |
| Date/time | Detect demand patterns |
A restaurant could, for example, compare breakfast products around New Delhi Railway Station with dinner products available during evening arrival windows.
New Delhi Railway Station is a major railway hub in Delhi. A Northern Railway work-study document describes it as handling a high frequency of trains and substantial passenger traffic, with more than 250 trains starting, terminating, or passing through the station daily; the document estimates average daily footfall at approximately 500,000, rising to about 600,000 during peak festival periods.
These figures should be treated as estimates from the cited railway study rather than as a live passenger count.
The railway-food opportunity has changed substantially from 2020 to 2026. During 2020 and parts of 2021, passenger mobility and food-service activity were disrupted by pandemic restrictions, reducing the relevance of normal travel-demand patterns. As rail travel recovered, digital food ordering became increasingly useful for passengers seeking predictable meal options during journeys. IRCTC's e-catering ecosystem expanded from hundreds of stations toward a broader national network, while the ordering experience became increasingly digital through websites, mobile applications, and authorized partners. IRCTC recorded 25,123 orders and 58,188 meals delivered on October 22, 2022, and later reported more than 51,000 meals delivered in a single day in 2023. By FY2023–24, the service averaged around 55,118 meals booked per day across approximately 428 stations. In April 2026, IRCTC reported more than 155,000 daily meals across its authorized network. The progression indicates how digital ordering has become a larger component of railway food services. For Delhi restaurants, historical monitoring can help distinguish recurring passenger-demand patterns from temporary spikes caused by holidays, festivals, train schedules, or special events.
Railway Food Ordering Competitive Intelligence for Restaurants enables Delhi food businesses to understand which brands and restaurants compete for railway passenger demand.
Traditional restaurant competitor analysis usually focuses on nearby outlets. Railway food competition is different because restaurants can compete for passengers traveling through a station even when their physical locations are relatively distant.
| Competitive Factor | What It Reveals |
|---|---|
| Restaurant name | Market participants |
| Menu size | Assortment depth |
| Cuisine | Customer choice |
| Product price | Positioning |
| Discounts | Promotional intensity |
| Ratings | Customer perception |
| Availability | Supply coverage |
| Station coverage | Geographic reach |
| Meal categories | Demand targeting |
IRCTC's current authorized-partner ecosystem includes brands and platforms such as Domino's, Zomato, Swiggy, Ovenstory, Faasos, Lunchbox, Behrouz Biryani, and others.
For Delhi restaurants, the competitive question therefore extends beyond other local restaurants. Businesses may need to understand how branded chains, cloud kitchens, aggregators, and independent restaurants compete within the same railway-food environment.
What Can Competitor Monitoring Reveal?
A structured dataset can identify:
This creates a factual foundation for product and market research.
From 2020 to 2026, restaurant competition became increasingly digital and less dependent on physical proximity. During the early pandemic period, restaurants primarily focused on survival, operational continuity, and local delivery. As travel and food ordering recovered, digital platforms enabled restaurants to reach customers through new consumption occasions. Railway food ordering introduced another specialized channel in which the passenger's journey, station, and train schedule influence purchasing decisions. IRCTC's official ecosystem now combines direct vendors, restaurants, food aggregators, and major food brands, demonstrating the breadth of competition available to railway passengers. Meanwhile, India's wider food-services market has continued expanding. IBEF reported that the sector grew from approximately US$56 billion in FY2021 to around US$90 billion in FY2026, with online food services expected to increase their share from 11% in FY2026 to 18% by FY2031. For Delhi restaurants, this broader digitalization makes competitor monitoring increasingly important. Businesses can compare railway-specific competitors by cuisine, product assortment, price range, station coverage, and promotional behavior. This does not guarantee that a particular product will succeed, but it can reduce information gaps when restaurants evaluate railway-focused expansion.
Railway Food Ordering Data Scraping can create a recurring dataset covering food products, prices, restaurant information, availability, station coverage, and other publicly visible marketplace attributes.
The value of structured collection comes from historical comparison.
A single menu snapshot tells a restaurant what is available today. A historical dataset can reveal:
This is especially relevant because IRCTC's e-catering ecosystem changes over time as restaurants, brands, and stations are added or updated.
| Field | Example |
|---|---|
| Restaurant | Brand or outlet name |
| Station | Delivery location |
| Product | Food item |
| Category | Biryani, thali, snack, etc. |
| Price | Listed amount |
| Discount | Promotional amount |
| Availability | Available/unavailable |
| Cuisine | North Indian, South Indian, etc. |
| Timestamp | Collection date/time |
A restaurant group can use this information to build dashboards showing changes across Delhi railway locations.
The shift toward structured railway-food data parallels the broader transformation of food ordering from manual discovery to digital marketplaces. In 2020, food businesses had limited ability to understand real-time marketplace conditions because delivery and travel patterns were highly disrupted. From 2021 onward, as railway passenger activity normalized, online ordering became increasingly useful for travelers. IRCTC's platform now allows passengers to explore available restaurants based on their PNR and schedule food delivery to a selected station. By 2023–24, the official railway annual report recorded e-catering operations at approximately 428 stations and average bookings of around 55,118 meals per day. The 2026 platform provides a broader ecosystem, including direct vendors and aggregator-managed outlets. This evolution increases the value of historical data because businesses can analyze how menus, pricing, and availability change alongside market expansion. For Delhi restaurants, structured collection can also support station-level analysis. Instead of evaluating the railway market as one national segment, businesses can compare New Delhi, Hazrat Nizamuddin, Delhi Junction, and other relevant locations according to available data. This granular approach can make product research and competitive benchmarking more actionable.
Train Food Ordering Trends analysis in Delhi can help restaurants understand how passenger consumption is changing across meal types, cuisines, product formats, and price points.
IRCTC currently lists a broad range of food categories, including vegetarian and non-vegetarian thalis, biryani, pizza, Jain food, South Indian meals, snacks, beverages, desserts, and combos.
| Trend Area | Example Question |
|---|---|
| Cuisine | Which cuisines have broad representation? |
| Meal occasion | Breakfast or dinner focus? |
| Product format | Individual meal or combo? |
| Price | Which price bands dominate? |
| Dietary preference | Are vegetarian/Jain options available? |
| Snacks | Which quick-consumption products recur? |
| Beverages | Which drinks accompany meals? |
| Desserts | How frequently are sweet items listed? |
Restaurants can use historical data to identify whether certain categories are consistently present or appear only during specific periods.
Food preferences in India's organized food-services market have become increasingly diverse between 2020 and 2026. The pandemic initially increased the importance of convenience and delivery-friendly food formats. As the market recovered, consumers increasingly explored different cuisines and product categories through digital channels. The broader Indian food-services market was valued at approximately US$80 billion in 2024 and was projected to reach US$144–152 billion by 2030, according to Redseer estimates reported by IBEF. More recent 2026 reporting places the market at around US$90 billion in FY2026 and projects approximately US$150 billion by FY2031. Railway food ordering reflects some of these broader shifts. IRCTC's current platform provides options from traditional Indian meals to pizza, burgers, wraps, Chinese dishes, regional cuisine, and specialized dietary options. For Delhi restaurants, this means trend analysis should not be restricted to one cuisine. Businesses can monitor the relative presence of meal formats, price bands, vegetarian options, snacks, beverages, and regional foods. Historical observations can then help identify persistent market patterns and areas worth testing through new products or targeted promotions.
Railway Food Delivery Price Monitoring helps Delhi restaurants understand how competitors price comparable meals and how those prices change over time.
Price intelligence is particularly important for railway passengers because the purchasing decision can be time-sensitive. A passenger may compare several options before selecting a meal that balances convenience, price, cuisine, and expected quality.
| Metric | Application |
|---|---|
| Base price | Market benchmarking |
| Discounted price | Promotion analysis |
| Price range | Category positioning |
| Combo price | Value comparison |
| Add-on price | Upselling analysis |
| Price changes | Competitive monitoring |
| Meal size | Value assessment |
| Delivery-related charges | Total-cost comparison |
The key is to compare similar products rather than unrelated menu items.
For example, a restaurant should compare vegetarian thalis with other vegetarian thalis, biryani with comparable biryani products, and breakfast combos with similar breakfast offerings.
Why Historical Pricing Matters
Historical price data can reveal:
Food pricing has become more dynamic across India's restaurant sector from 2020 through 2026. Restaurants have had to respond to changing input costs, labor expenses, consumer demand, delivery economics, and competitive pressure. At the same time, digital ordering has made price comparison easier for consumers. India's food-services market increased substantially over the period, reaching an estimated US$90 billion in FY2026, according to recent Redseer data reported by IBEF. Organized food-service brands now account for approximately 45–50% of the overall market, according to the same report, increasing the relevance of standardized pricing and digital competitive positioning. Railway food businesses face an additional consideration: the product must be delivered at a specific station and within a particular journey window. Therefore, price analysis should ideally be combined with menu availability, delivery station, meal category, and competitor coverage. For Delhi restaurants, historical monitoring can show whether competitors rely on discounts or maintain stable prices. It can also help identify price bands where comparable products are concentrated. Restaurants can use these observations as inputs to pricing reviews rather than relying on isolated competitor checks.
Food Delivery Data Scraping: Menu & Price Intelligence gives Delhi restaurants a framework for combining product, price, availability, competitor, and station-level observations.
The purpose is to transform scattered marketplace information into a structured decision system.
Key Applications
| KPI | Example Use |
|---|---|
| Number of restaurants | Market-size proxy |
| Average menu size | Assortment benchmark |
| Average product price | Price benchmark |
| Discount frequency | Promotion intensity |
| Product availability | Supply visibility |
| Category share | Menu concentration |
| New products | Innovation tracking |
| Removed products | Assortment changes |
| Station coverage | Geographic opportunity |
The data should be interpreted as marketplace intelligence, not as a direct measurement of actual sales unless sales data is explicitly available.
The food-delivery ecosystem has moved steadily toward data-driven decision-making between 2020 and 2026. Restaurants initially adopted digital ordering primarily as a channel for reaching customers. Over time, the volume and variety of digital marketplace information increased, allowing businesses to study menus, pricing, competitors, availability, and customer-facing offers. Railway food ordering represents a specialized application because passenger demand is connected to train schedules and delivery stations. IRCTC's official e-catering service currently operates across more than 400 stations and offers passengers food from a broad network of restaurants and food providers. The platform's current menu spans thalis, biryani, pizza, burgers, wraps, South Indian meals, snacks, combos, beverages, and regional cuisine. For Delhi restaurants, combining these marketplace observations with historical timestamps can create a useful competitive research layer. A restaurant can identify how many comparable products are listed, how price ranges differ, which categories are expanding, and where competitors appear to have limited availability. These insights can inform decisions about menu development, pricing, station coverage, and promotional strategy. They should complement internal sales, customer, and operational data rather than replace them.
Actowiz Metrics can help Delhi restaurants create scalable, structured datasets for railway food-market research.
Price & promotion intelligence can be integrated with menu, competitor, availability, and station-level datasets to create a broader market-monitoring framework.
A Practical Railway Food Data Workflow
1. Define the market scope
Identify Delhi railway stations, food categories, competitors, brands, and relevant product groups.
2. Collect structured marketplace information
Capture publicly available menu, price, product, restaurant, station, availability, and promotional information.
3. Normalize the data
Standardize product names, categories, restaurant names, prices, and station identifiers.
4. Validate records
Identify duplicate listings, missing fields, inconsistent product information, and unusual price observations.
5. Create historical datasets
Store timestamped records to measure changes rather than relying on one-time snapshots.
6. Build analytical dashboards
Present competitor, menu, pricing, and station-level trends in a format suitable for restaurant teams.
7. Deliver actionable insights
Use the resulting datasets to support menu planning, pricing reviews, competitor research, and market-expansion analysis.
Who Can Use Railway Food Intelligence?
This approach can support:
The greatest value comes when railway food data is combined with a restaurant's internal sales, operational, and customer data.
Railway food ordering represents a specialized digital food-service opportunity for Delhi restaurants. The combination of high passenger movement, station-specific delivery, diverse menus, and digital ordering creates a market where structured intelligence can support better decisions.
IRCTC's e-catering ecosystem has expanded considerably. The service averaged about 55,118 meals booked per day in FY2023–24 and reported more than 155,000 daily meals through its authorized network in April 2026.
For Delhi restaurants, the opportunity is not simply to add another delivery channel. It is to understand the market systematically.
Digital shelf analytics can help businesses organize marketplace observations around products, prices, competitors, availability, and station coverage. Combined with internal restaurant data, these insights can help teams evaluate which menu categories deserve attention, where pricing needs review, and which railway locations may warrant further investigation.
The most effective strategy is to build a historical data foundation instead of relying on occasional manual checks. This enables restaurants to identify changes, compare competitors, monitor pricing, and develop evidence-based market hypotheses.
Ready to uncover railway food-market opportunities for your Delhi restaurant? Partner with Actowiz Metrics to build scalable menu, price, competitor, availability, and station-level data solutions that turn railway food intelligence into actionable growth insights!
Expert blogs, research reports and infographics — practical, data-driven reading across e-commerce and quick-commerce.
Most fields are optional — the more you share, the better your sample.
.webp "infographics")
.webp "infographics")