BLOG
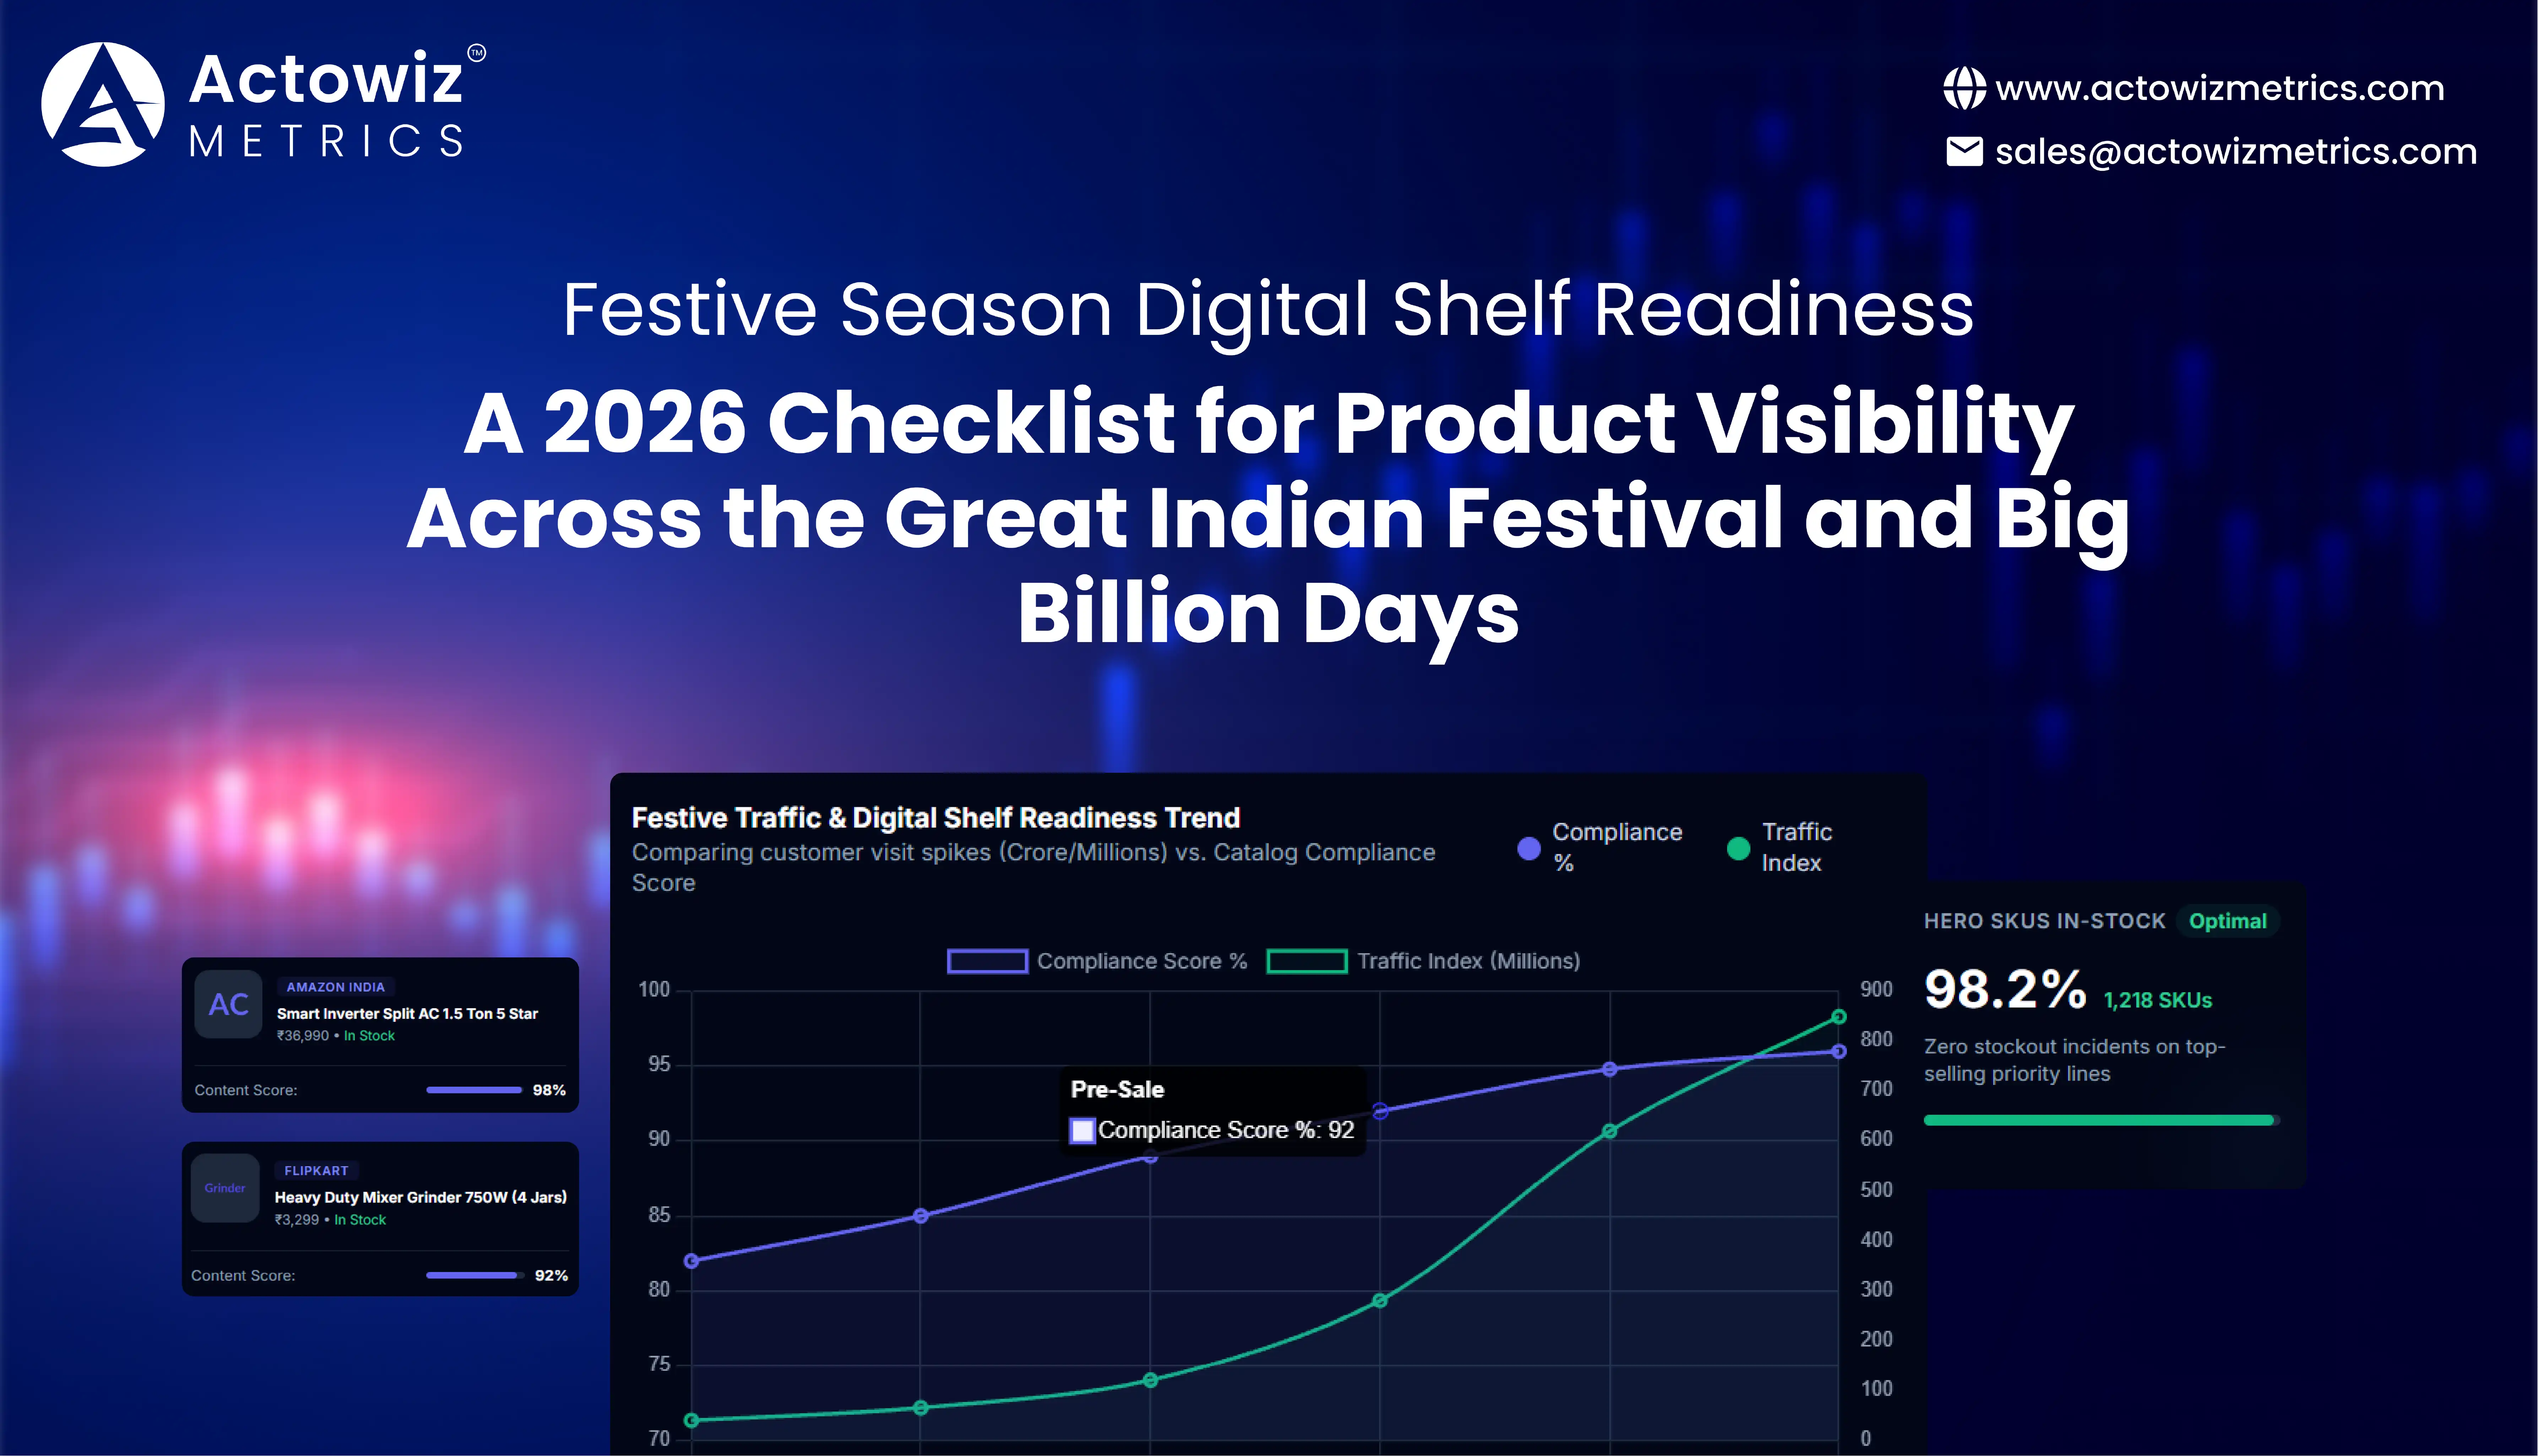


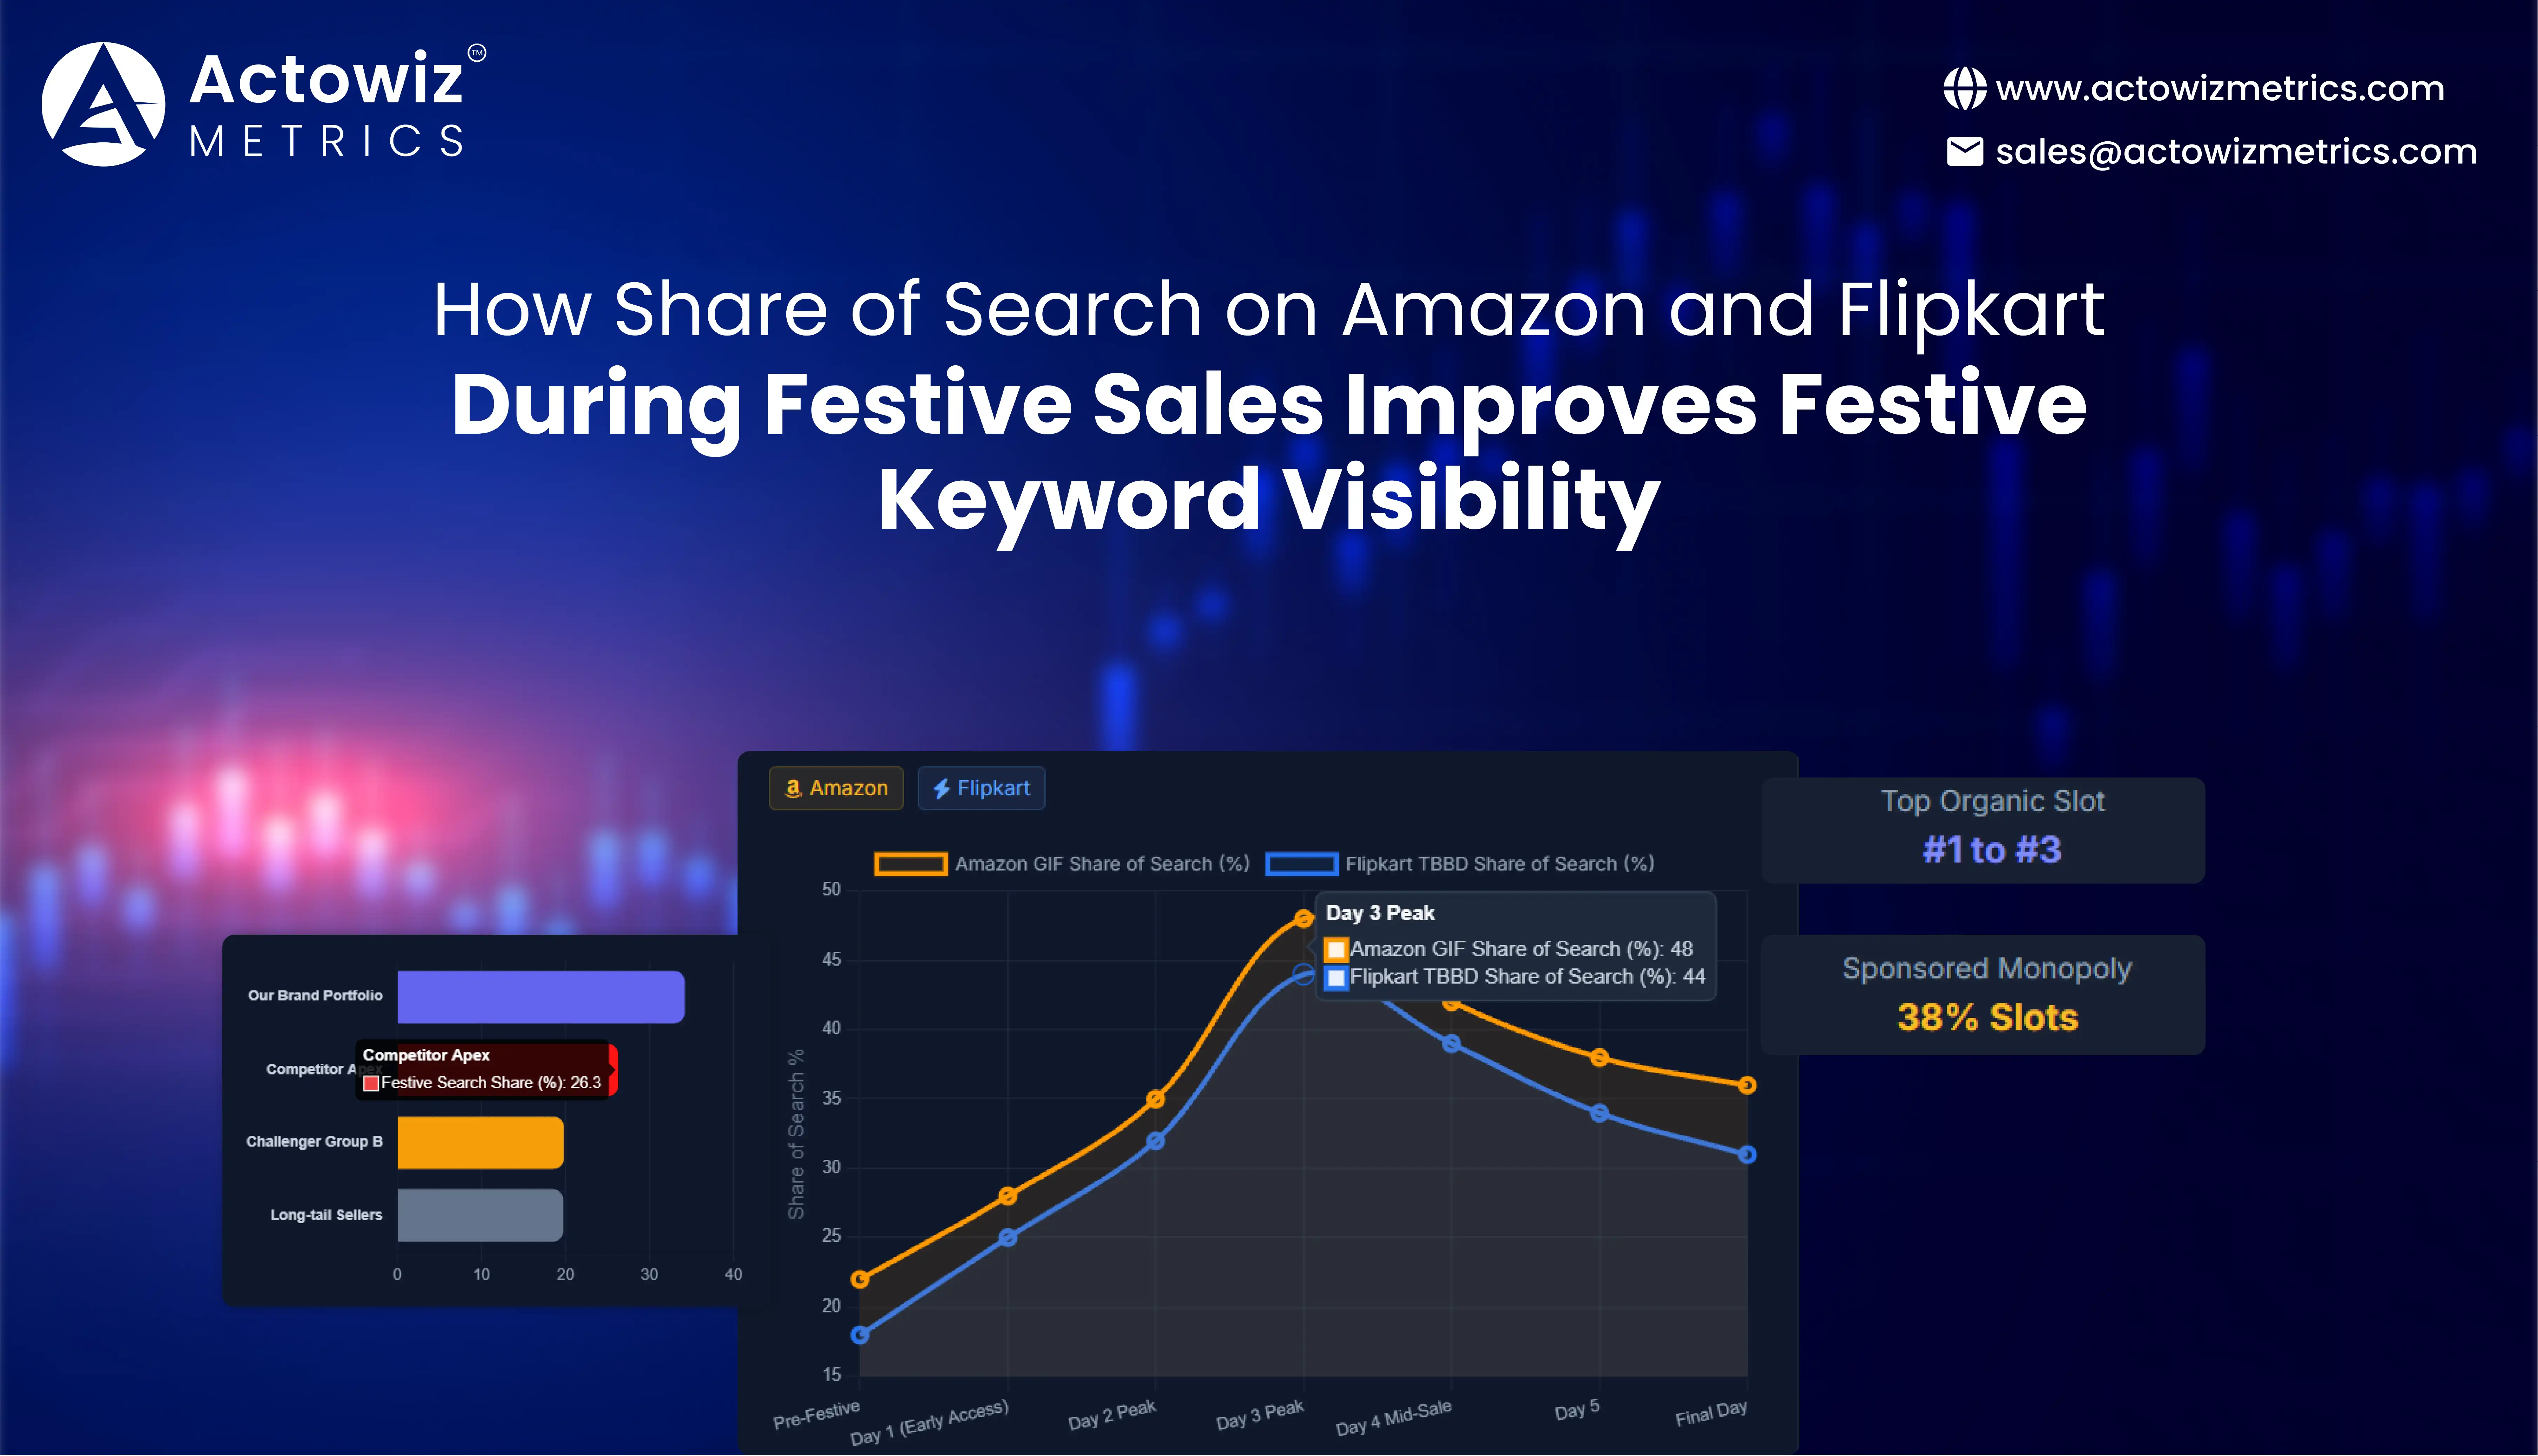
Share of Search on Amazon and Flipkart During Festive Sales provides brands with a practical way to understand how visible their products are when shoppers actively search for festive offers, discounts, gifts, electronics, fashion, beauty, home appliances, and other high-demand categories. Instead of measuring sales alone, brands can monitor search rankings, sponsored placements, competing products, keyword coverage, and changes in visibility throughout major sale events.
Festive commerce has become one of the most important periods for India's online retail ecosystem. Amazon reported 140 crore customer visits during its 2024 Great Indian Festival, with more than 85% of customers coming from non-metro cities. The company also reported more than 25,000 new product launches and over 3 crore same-day or next-day deliveries.
Flipkart reported more than 33 crore user visits during Early Access and Day 1 of Big Billion Days 2024. Its data also showed strong demand across mobiles, electronics, fashion, beauty, home, food, and nutrition, while more than 75% of marketplace sellers experienced multi-fold order growth compared with the pre-festive period.
This level of traffic makes Amazon Price Tracking and Flipkart Price Monitoring particularly important. A brand may have an attractive discount but still lose visibility if competitors occupy the top organic positions, sponsored placements, deal sections, or search-result features. Monitoring search visibility alongside pricing allows businesses to determine whether their festive strategy is actually reaching shoppers.
Amazon and Flipkart Competitor Keyword Rank Tracking allows brands to monitor where their products appear for high-value festive searches and how that position changes before, during, and after a sale. Search terms such as "best Diwali TV," "smartphone under ₹20,000," "festive fashion offers," or category-specific deal terms can become extremely competitive during major events.
This matters because festive demand is not evenly distributed across the shopping period. Brands can move from page one to page three when competitors increase advertising, launch additional SKUs, change prices, or secure promotional placements. Tracking rank at regular intervals therefore provides a more useful picture than recording a single position.
Historical marketplace activity demonstrates why this matters. In 2022, Amazon reported that 80% of new customers during its Great Indian Festival came from Tier 2 and Tier 3 towns, while more than 23,000 sellers became lakhpatis. Flipkart reported more than one billion customer visits during its eight-day Big Billion Days 2022 event, along with four million first-time visitors.
| Year | Festive marketplace signal | What it means for keyword tracking |
|---|---|---|
| 2020 | Amazon reported more than 1.1 lakh sellers receiving orders and 98.4% pincode coverage within 48 hours. | Broader geographic competition |
| 2021 | Amazon reported 36 million+ Alexa requests during the festive period. | Greater product-discovery activity |
| 2022 | Flipkart crossed 1 billion customer visits during TBBD. | Larger search opportunity |
| 2023 | Flipkart recorded 1.4 billion customer visits during TBBD. | Higher competitive intensity |
| 2024 | Amazon recorded 140 crore visits during GIF. | Major keyword exposure |
| 2025 | Amazon recorded 276 crore visits, with 70% from Tier 2 and Tier 3 cities. | Regional keyword visibility becomes critical |
| 2026 | Flipkart recorded 6.3 million concurrent users in a minute during the opening of TBBD. | Real-time monitoring becomes increasingly valuable |
The analysis should therefore track keyword position, ranking changes, competing ASINs or listings, sponsored results, and page-level visibility throughout the festive campaign.
Festive Season Organic vs Sponsored Search Visibility is essential because a product can appear prominently in search results without necessarily having strong organic relevance. During large sales, sponsored placements can occupy significant portions of the shopper's first view, while organic listings compete for the remaining visibility.
Brands should separate organic rank from paid placement when measuring search performance. For example, a product ranking organically at position 12 but appearing in a sponsored position at the top of the page has a different visibility profile from a product that naturally ranks in the top three. This distinction helps marketing teams understand whether visibility is being earned through relevance, supported through advertising, or dependent on both.
Amazon's 2022 festive data provides an example of the scale of promotional activity. Amazon reported that several brands achieved 1.5X to 5X sales growth during the Great Indian Festival, while Xiaomi reported five-times growth in smartphone demand compared with its regular period.
| Year | Observed marketplace development | Visibility implication |
|---|---|---|
| 2020 | 91% of Amazon's new customers were reported to come from small towns. | Broader audience targeting |
| 2021 | Amazon reported 36 million+ Alexa requests during GIF. | Product discovery expanded |
| 2022 | Amazon reported 23,000 sellers becoming lakhpatis. | More sellers competing for attention |
| 2023 | Flipkart reported 4X growth in engagement for new on-app experiences versus pre-festive levels. | More discovery surfaces |
| 2024 | Amazon reported 25,000+ new product launches. | Greater SKU competition |
| 2025 | Amazon recorded 2.76 billion visits. | Paid and organic visibility both become critical |
| 2026 | Flipkart reported over 6X normal-hour shopping activity during the opening hour of TBBD. | Search demand can change rapidly |
A strong analysis should compare sponsored share, organic share, top-three positions, first-page presence, and competitor frequency. This enables marketers to determine whether advertising budgets are supplementing strong organic visibility or compensating for weak rankings.
Amazon vs Flipkart Share of Search Analysis helps brands identify whether their products receive similar visibility across India's two major marketplaces. A brand may dominate searches on one platform while remaining difficult to find on the other because of differences in assortment, pricing, advertising investment, seller availability, reviews, or platform-specific ranking mechanisms.
Cross-platform comparison should use identical or closely matched keywords, categories, product variants, and observation periods. The objective is not simply to identify which platform receives more traffic but to determine where a brand has stronger search visibility relative to its competitors.
The difference in reported festive scale is significant. Amazon recorded 140 crore customer visits during its 2024 Great Indian Festival, while Flipkart reported more than 33 crore visits during Early Access and Day 1 of Big Billion Days 2024. These figures are not directly comparable because the platforms use different reporting periods and methodologies, but they demonstrate the scale of festive shopping activity.
| Year | Amazon signal | Flipkart signal |
|---|---|---|
| 2020 | 98.4% of India pin codes received Amazon orders within 48 hours. | Festive supply-chain expansion continued |
| 2021 | Amazon highlighted strong Tier 2/3 participation. | Marketplace competition continued expanding |
| 2022 | 80% of new Amazon GIF customers came from Tier 2/3 locations. | 1B+ customer visits during TBBD. |
| 2023 | Amazon continued expanding festive discovery | Flipkart recorded 1.4B customer visits. |
| 2024 | 1.4B customer visits during GIF. | 330M+ visits during Early Access and Day 1. |
| 2025 | 2.76B Amazon visits; 70% from Tier 2/3 cities. | Continued expansion of festive marketplace activity |
| 2026 | Festive season ongoing | 6.3M concurrent users in a minute during TBBD opening. |
The resulting analysis can show brands where keyword optimization, inventory, advertising, and pricing strategies need to differ between marketplaces.
Amazon and Flipkart Festive Keyword Visibility Tracking should begin several weeks before the main sale and continue through the final days. This allows teams to establish a baseline before discounts and advertising intensify.
A useful framework tracks keyword position, product visibility, sponsored placement, competitor count, price, discount percentage, ratings, review volume, stock status, and promotional badges. These variables should be captured at multiple points during the day because festive rankings can change quickly as campaigns go live.
The importance of continuous monitoring is visible in Amazon's 2024 results. The Great Indian Festival generated 140 crore customer visits over the event period, while more than 3 crore products were delivered the same day or next day. Flipkart's 2024 event recorded more than 33 crore visits during Early Access and Day 1, with delivery coverage extending across more than 19,000 pincodes.
| Year | Market development | Monitoring priority |
|---|---|---|
| 2020 | Large expansion of marketplace reach | Track geographic visibility |
| 2021 | More customers from Tier 2/3 markets | Track regional search terms |
| 2022 | 80% of new Amazon GIF customers from Tier 2/3 towns | Track city-level demand |
| 2023 | Flipkart reached 1.4B visits | Track high-volume keywords |
| 2024 | Amazon recorded 1.4B visits | Track SKU and competitor movements |
| 2025 | Amazon reached 2.76B visits | Track regional and category-specific visibility |
| 2026 | Flipkart recorded 6.3M concurrent users in a minute | Track rankings at shorter intervals |
This approach can reveal whether a product loses visibility because of a price change, stockout, competitor promotion, increased advertising, or a ranking shift. It also gives brands evidence for adjusting campaigns while the sale is still live.
Festive Sale Sponsored Placement and Ad Competition Analysis gives brands a way to understand how aggressively competitors are bidding for high-intent searches. During festive campaigns, the same keyword may feature several sponsored products, brand placements, deal banners, and promotional modules before shoppers reach standard organic listings.
Monitoring these placements can help businesses identify recurring competitors, changes in sponsored frequency, product-level advertising patterns, and keywords where competition becomes particularly intense.
Amazon's 2024 Great Indian Festival included more than 25,000 new product launches from top brands, while the platform reported 11 crore customer visits during the first 48 hours. Such a dense environment creates substantial competition for attention. Flipkart similarly reported that more than 75% of sellers experienced multi-fold order growth compared with the pre-festive period during Early Access and Day 1 of TBBD 2024.
| Year | Festive event indicator | Advertising analysis opportunity |
|---|---|---|
| 2020 | 1.1 lakh+ Amazon sellers received orders. | Identify growing competitor density |
| 2021 | 36M+ Alexa requests during Amazon GIF. | Track high-intent discovery terms |
| 2022 | Amazon brands reported 1.5X–5X sales growth. | Compare visibility against sales momentum |
| 2023 | Flipkart recorded 1.4B visits. | Monitor high-volume sponsored terms |
| 2024 | Amazon had 25,000+ new product launches. | Track increased SKU competition |
| 2025 | Amazon recorded 2.76B visits. | Measure advertising pressure at scale |
| 2026 | Flipkart saw 6.3M concurrent users in a minute. | Monitor rapid sponsored-position changes |
Brands can use this information to identify keywords where advertising investment may be required and terms where strong organic rankings already provide sufficient visibility.
E-commerce Festive Search Visibility and Market Intelligence connects keyword performance with the wider competitive environment. Search visibility is not an isolated metric. It can be interpreted alongside prices, discounts, ratings, inventory, seller counts, product launches, category trends, and promotional activity.
For example, if a competitor moves from page two to the top three positions while simultaneously reducing price and increasing sponsored visibility, the change may indicate a coordinated festive strategy. If several competitors disappear from search results because of stockouts, a brand with stable inventory may have an opportunity to capture additional demand.
Amazon's 2025 festive event recorded 276 crore visits, with 70% of traffic coming from Tier 2 and Tier 3 cities. Meanwhile, the opening of Flipkart's 2026 Big Billion Days generated 6.3 million concurrent users in a minute, with non-metros accounting for approximately 60% of demand during the opening period.
| Year | Key real-world signal | Intelligence opportunity |
|---|---|---|
| 2020 | Amazon orders reached 98.4% of Indian pin codes within 48 hours. | Geographic opportunity mapping |
| 2021 | 36M+ Alexa requests during GIF. | Search-behavior analysis |
| 2022 | 80% of new Amazon GIF customers came from Tier 2/3 towns. | Regional demand intelligence |
| 2023 | Flipkart reached 1.4B customer visits. | Category and keyword benchmarking |
| 2024 | Amazon reported 140 crore customer visits. | Competitive visibility measurement |
| 2025 | Amazon reached 276 crore visits. | Large-scale demand monitoring |
| 2026 | Flipkart recorded 6.3M concurrent users in a minute. | Near-real-time festive intelligence |
The result is a more complete understanding of marketplace performance. Instead of asking only whether sales increased, brands can ask whether visibility increased, which competitors gained ground, which keywords generated stronger exposure, and whether pricing or advertising changes influenced ranking.
Actowiz Metrics can help brands create a structured marketplace intelligence layer around festive search performance. Share of Search can be evaluated alongside keyword rankings, product listings, pricing, discounts, seller information, sponsored placements, reviews, ratings, and availability across Amazon and Flipkart.
The platform can support recurring data collection so businesses can compare pre-sale, sale-period, and post-sale visibility. This helps marketing teams identify which keywords consistently generate exposure and which ones become highly competitive only during specific festive periods.
For category managers, the analysis can also highlight competitors that repeatedly appear in top positions. For advertising teams, it can reveal where sponsored placements dominate search results. For pricing teams, search visibility can be compared with discount changes and competitor prices. For leadership teams, the resulting dashboards can provide a consolidated view of marketplace presence.
The most useful output is not simply a ranking report. It is a time-based competitive picture showing how brands, products, keywords, prices, promotions, and availability interact during India's most commercially important shopping periods.
Share of Search on Amazon and Flipkart During Festive Sales gives brands a measurable way to understand their digital visibility when marketplace competition is at its highest. The historical scale of Amazon's and Flipkart's festive events—from Amazon's 2020 expansion across Indian pin codes to Flipkart's 6.3 million concurrent users in a minute during the opening of its 2026 Big Billion Days—shows why visibility monitoring needs to operate continuously rather than through occasional manual checks.
By combining keyword rankings with sponsored placements, pricing, discounts, inventory, competitor activity, ratings, and marketplace availability, brands can identify where they are gaining or losing attention. This creates a stronger foundation for festive SEO, advertising optimization, assortment planning, and competitive intelligence.
Track festive search rankings, competitor visibility, pricing, and marketplace trends with Actowiz Metrics to make every festive campaign more data-driven!
Expert blogs, research reports and infographics — practical, data-driven reading across e-commerce and quick-commerce.
Most fields are optional — the more you share, the better your sample.
.webp "infographics")
.webp "infographics")