BLOG
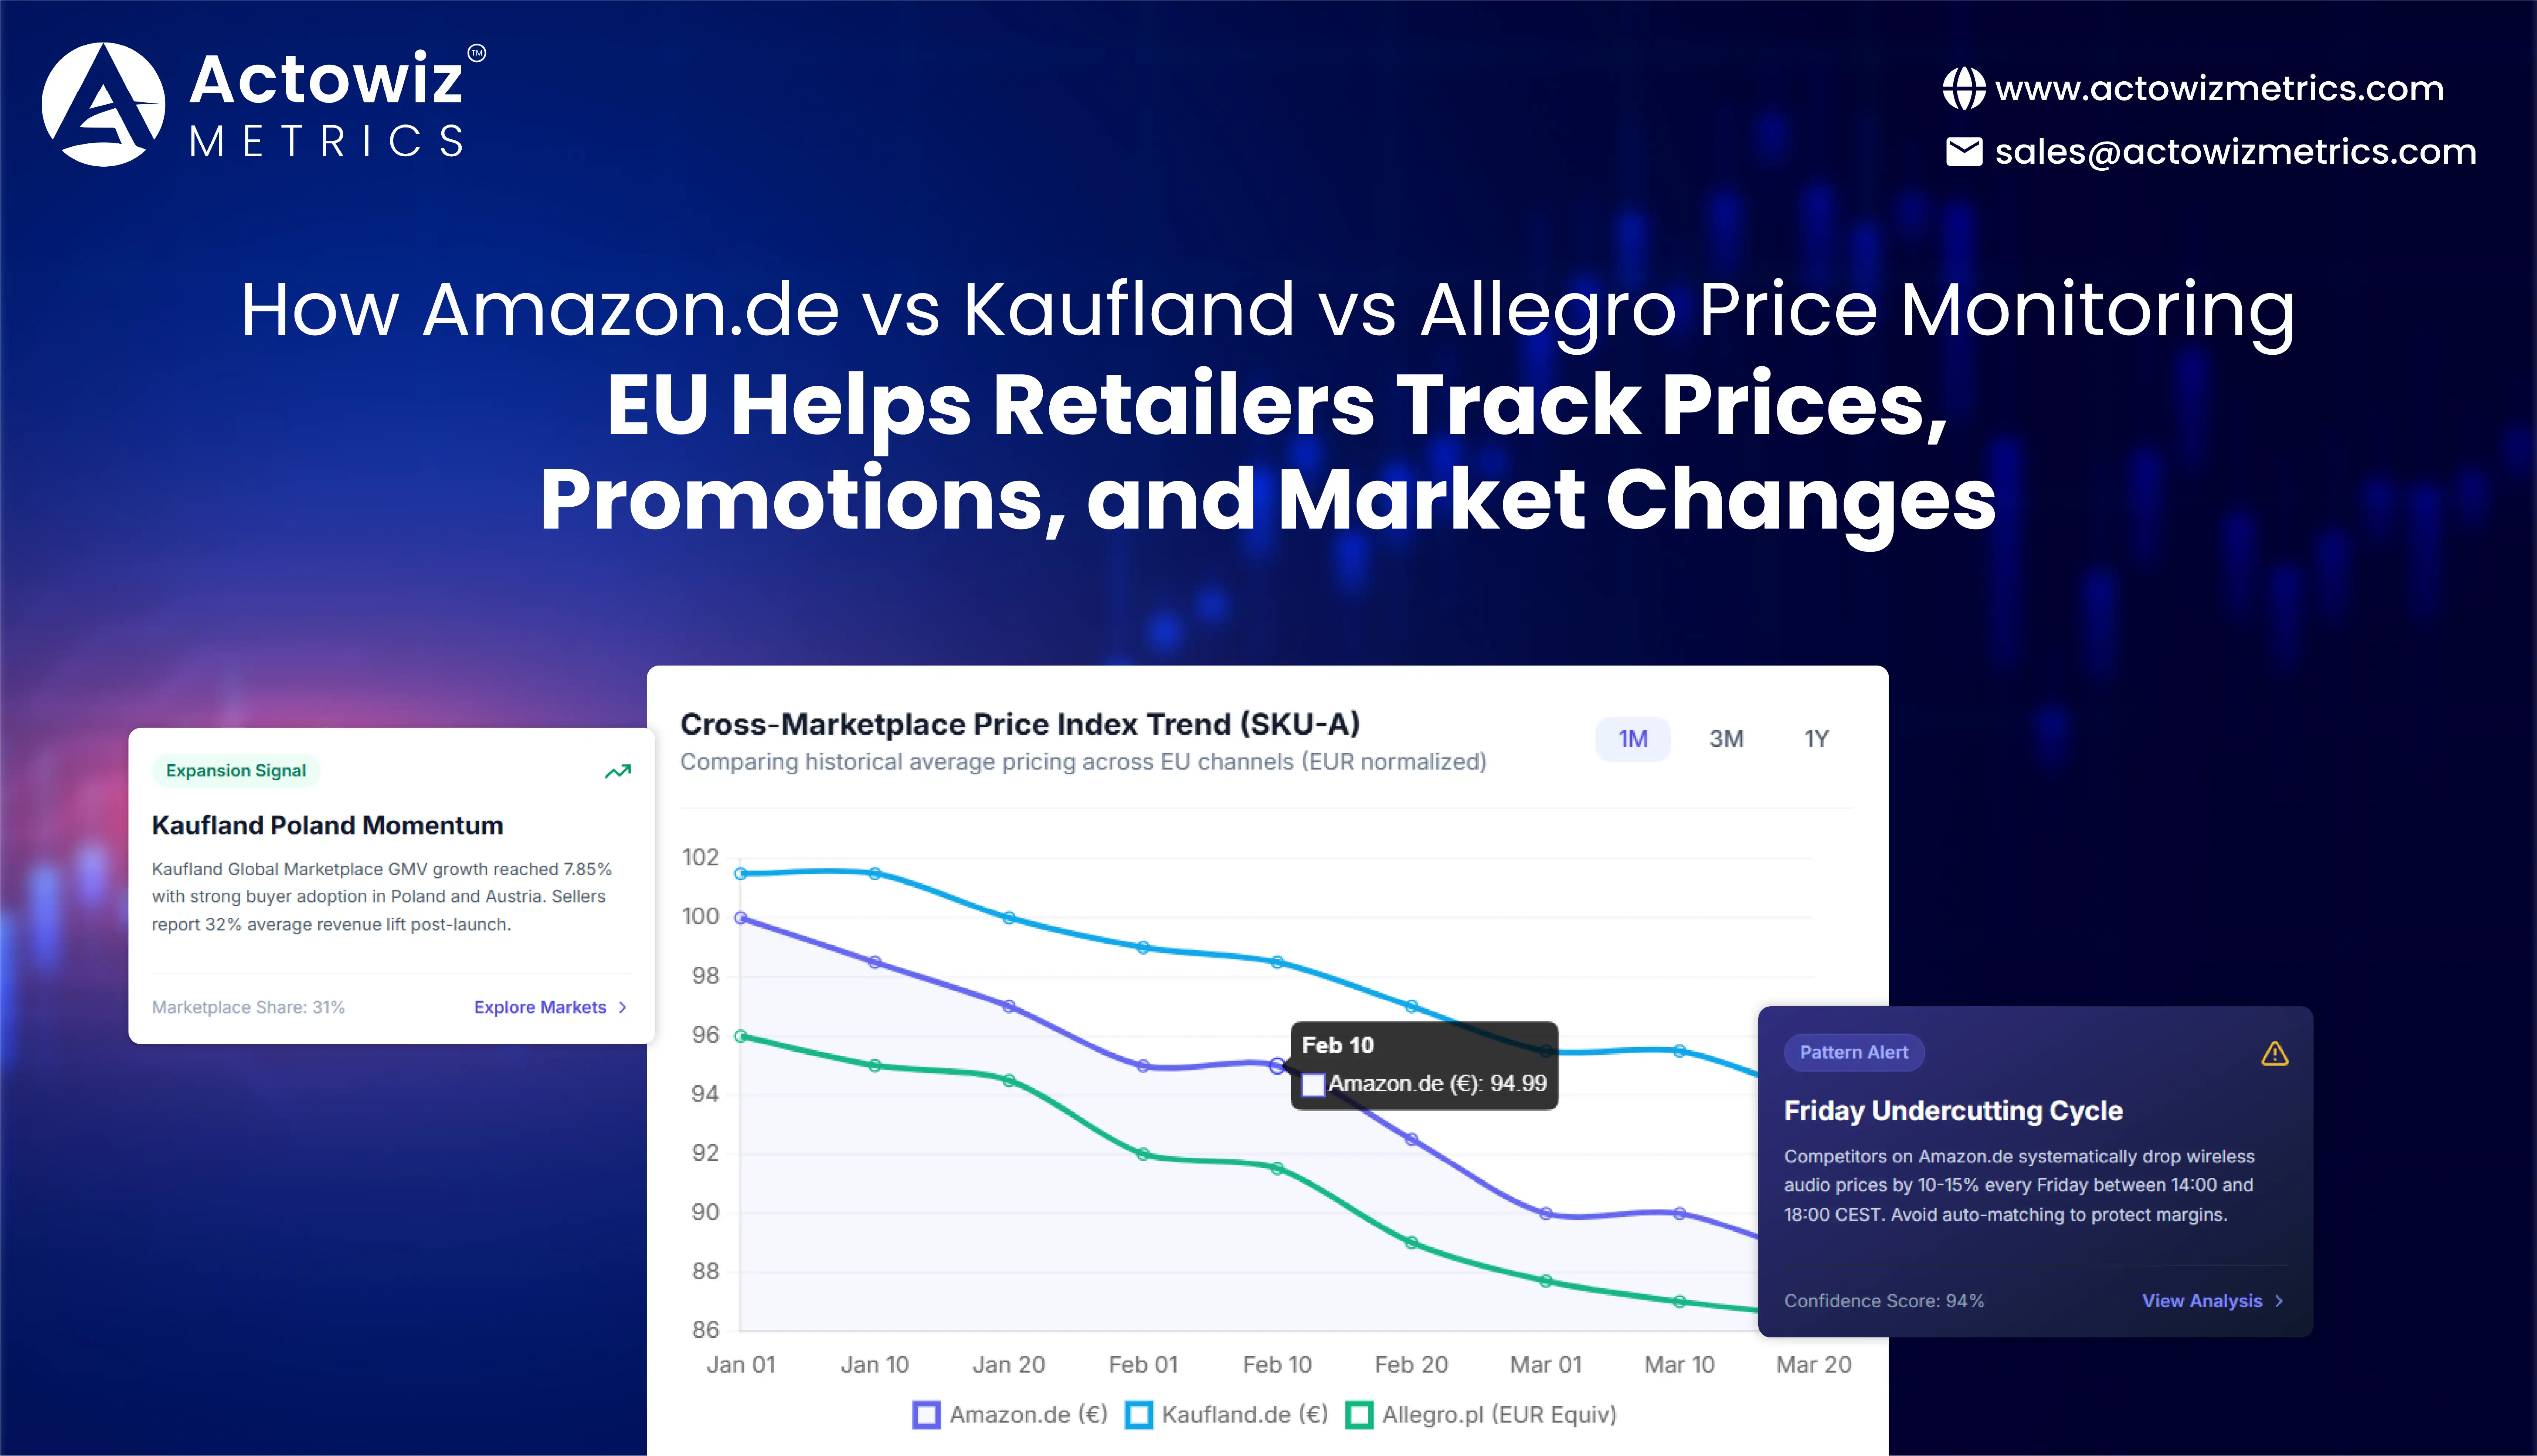


Retailers competing across European marketplaces need continuous price visibility because the same SKU can face different prices, promotions, sellers, taxes, and competitive pressures across countries. Amazon.de vs Kaufland vs Allegro Price Monitoring EU helps brands compare these marketplace movements systematically, while Competitor intelligence turns those observations into pricing, assortment, and promotion decisions.
Bottom line: European retailers can protect margins and respond faster when they monitor comparable SKUs across marketplaces instead of relying on occasional manual checks.
The need is growing because marketplaces now represent a major share of online retail. In Germany alone, online marketplaces generated €44.0 billion in 2024, up 4.7% year over year, representing 55% of German B2C e-commerce merchandise revenue. By 2025, marketplace sales increased another 4.9% to €46.2 billion.
For brands, the challenge is not simply identifying the cheapest listing. The real challenge is understanding why a price changed, whether the change is temporary, which seller caused it, and whether competitors are using discounts to capture demand.
This makes automated marketplace monitoring particularly valuable for:
A useful monitoring framework should connect product identity, seller, price, discount, availability, shipping, ratings, reviews, and historical movement into one comparable dataset.
A reliable baseline begins with consistent SKU matching across marketplaces. EU marketplace price monitoring for brands should normalize product identifiers, pack sizes, variants, currencies, VAT treatment, seller offers, and promotional prices before comparing one marketplace against another.
The second important principle is that marketplace price should not be treated as a single number. A retailer should capture:
| Metric | What It Reveals | Business Use |
|---|---|---|
| Listed price | Standard competitive position | Price benchmarking |
| Discounted price | Actual promotional pressure | Promotion response |
| Discount percentage | Promotion intensity | Campaign comparison |
| Seller count | Competitive density | Marketplace strategy |
| Buy-box/featured positioning | Leading offer position | Competitive offer |
| Shipping cost | Landed customer cost | True price comparison |
| Availability | Supply pressure | Stock-risk detection |
| Product Rating/reviews | Consumer confidence | Benchmarking |
| Timestamp | When the price was observed | Historical tracking |
From 2020 onward, marketplace competition became progressively more dynamic. The pandemic accelerated digital purchasing, while 2022-2023 brought inflation and weaker consumer demand. By 2024, German online merchandise sales returned to growth, reaching €80.6 billion, with marketplaces growing 4.7%.
In 2025, German e-commerce merchandise sales increased another 3.2% to €83.1 billion, while marketplaces grew 4.9%. Marketplace sales reached €46.2 billion, demonstrating that platform-based commerce continues to expand faster than several traditional online retail segments.
By 2026, the German market was still expanding: first-half online merchandise revenue rose 4.3%, while marketplace revenue increased 6.4%.
Actionable insight: Retailers should establish a historical price baseline before automating repricing. Without historical context, a 10% price drop could be mistaken for a permanent competitor strategy when it may actually be a short promotional event.
Amazon.de, Kaufland & Allegro Product Data Analytics EU enables brands to move beyond price snapshots and understand the broader competitive environment surrounding each product.
Consider a consumer electronics brand selling the same wireless headphones across Germany and Poland. A simple price comparison might show:
| Marketplace | Example Listed Price | Discount | Sellers | Availability |
|---|---|---|---|---|
| Amazon.de | €89.99 | 10% | 18 | In stock |
| Kaufland.de | €92.49 | 5% | 11 | In stock |
| Allegro.pl | PLN 379 | 12% | 24 | In stock |
Illustrative example for methodology, not measured marketplace data.
The business question is not simply "Who is cheapest?" It is:
Is the lower price associated with a specific seller, a temporary campaign, a different bundle, or a genuine marketplace-wide price shift?
Product-level analytics can answer this by connecting:
Kaufland's own marketplace infrastructure illustrates the complexity of European expansion. Its Global Marketplace operates across multiple country-specific storefronts, while sellers can centrally manage offers, orders, and product information.
Kaufland reported that its marketplace GMV increased 7.85% in 2024 across its marketplace countries. Germany alone had up to 32 million monthly online visitors and more than 45 million products across over 6,400 categories.
The 2020-2021 period increased the strategic importance of online product availability and pricing. During 2022-2023, inflation and weaker consumer confidence made price sensitivity more important. In 2024, marketplaces regained momentum in Germany, and in 2025 marketplace revenue grew faster than total merchandise e-commerce. By 2026, marketplace sales continued to outperform several traditional channels.
Allegro also demonstrates how quickly marketplace scale can evolve. Its consolidated GMV increased from PLN 63.37 billion in 2024 to PLN 69.16 billion in 2025, a 9.1% increase.
Actionable insight: Product analytics should be organized at the SKU × marketplace × seller × timestamp level. This structure allows pricing teams to distinguish marketplace-wide changes from individual seller actions.
Historical tracking is where automated monitoring becomes significantly more valuable than manual price checks. Amazon.de, Kaufland & Allegro Price Data Collection EU allows retailers to build a time series showing how products move across marketplaces.
A useful historical dataset might look like this:
| Date | Marketplace | SKU | Price | Discount | Seller Count | Availability |
|---|---|---|---|---|---|---|
| Jan 2026 | Amazon.de | SKU-A | €99.99 | 0% | 14 | In stock |
| Feb 2026 | Amazon.de | SKU-A | €94.99 | 5% | 16 | In stock |
| Mar 2026 | Amazon.de | SKU-A | €89.99 | 10% | 19 | In stock |
| Jan 2026 | Kaufland.de | SKU-A | €101.49 | 0% | 9 | In stock |
| Feb 2026 | Kaufland.de | SKU-A | €98.99 | 2% | 10 | In stock |
| Mar 2026 | Kaufland.de | SKU-A | €95.49 | 6% | 13 | Limited |
This dataset makes several analyses possible:
The market moved from an exceptional digital-shopping surge in 2020-2021 toward a more price-sensitive environment during 2022-2023. The stabilization visible in 2024 was followed by stronger marketplace growth in 2025 and 2026.
German e-commerce merchandise sales were €79.7 billion in 2023 and €80.6 billion in 2024. Marketplace sales grew from €42.0 billion to €44.0 billion during the same period.
The trend accelerated in 2025: total German online merchandise sales reached €83.1 billion, while marketplace sales reached €46.2 billion.
This means historical pricing data is becoming more important because brands are operating in a larger, more competitive marketplace environment.
Actionable insight: Instead of alerting teams every time a competitor changes price, create thresholds such as "price gap exceeds 7%," "three consecutive price reductions," or "competitor discount remains active for more than 72 hours." This reduces alert fatigue and prioritizes meaningful events.
European marketplace competitor intelligence becomes useful when raw observations are converted into decision signals.
For example, suppose a brand discovers that three major sellers repeatedly reduce a product's price every Friday. A basic monitoring system sees three price changes. A stronger intelligence system recognizes a recurring promotional pattern.
This distinction matters because pricing decisions should respond to competitive behavior, not isolated numbers.
A practical competitor intelligence framework can classify marketplace events as follows:
In 2024, international operations recorded 5.4 million active buyers, up 26.1% year over year, while international-operation GMV reached PLN 619.7 million, compared with PLN 56.7 million in H1 2023.
In 2020, many businesses primarily monitored availability and headline prices. By 2022, inflation created greater pressure to track price changes and promotional depth. During 2023-2024, marketplace growth made seller-level monitoring more important. In 2025-2026, retailers increasingly need a broader competitive picture covering price, promotions, assortment, availability, seller behavior, and demand indicators.
The German marketplace channel alone accounted for 56% of online merchandise sales in 2025, up from 55% in 2024.
Actionable insight: Create competitor profiles rather than competitor price lists. Each profile should show price position, promotion frequency, assortment overlap, seller density, availability, and historical behavior.
Amazon.de, Kaufland & Allegro Competitor Price Analysis Europe should focus on patterns that affect margin, conversion, and market positioning rather than simply identifying the lowest price.
Four pricing patterns deserve particular attention.
If the same seller consistently remains below the brand's price, the issue may require a structural pricing response rather than a one-time promotion.
A competitor may reduce prices sharply for 24-72 hours. Automatically matching that price could unnecessarily destroy margin.
A product may be priced competitively on Amazon.de but substantially higher on Kaufland or Allegro. That can indicate differences in seller competition, logistics, demand, VAT, or marketplace strategy.
When several sellers converge around the same price, the marketplace may have developed a competitive price floor.
A retailer can monitor these patterns using:
| KPI | Formula / Method | Decision Value |
|---|---|---|
| Price gap | Brand price – competitor price | Competitive position |
| Price index | Brand price ÷ market average × 100 | Relative pricing |
| Promotion depth | List price – selling price | Discount intensity |
| Promotion frequency | Promotions ÷ observation period | Competitor behavior |
| Price volatility | Standard deviation of price | Market stability |
| Seller concentration | Offers by leading sellers | Competitive pressure |
| Availability rate | In-stock observations ÷ total observations | Supply visibility |
German marketplace sales rose from €42.0 billion in 2023 to €44.0 billion in 2024 and €46.2 billion in 2025. By the first half of 2026, marketplace revenue had grown another 6.4% year over year.
This expansion increases the number of pricing interactions retailers need to understand. A pricing team monitoring 500 SKUs across three marketplaces can quickly face thousands of daily observations when multiple sellers and variants are included.
Actionable insight: Do not automatically match every competitor. Use a pricing decision matrix:
Price & promotion intelligence becomes more powerful when pricing data is connected with campaign timing, seller activity, product availability, and historical trends.
For example, a 15% price reduction can mean very different things:
Without historical context, retailers may interpret every reduction as a permanent competitive threat.
| Data Point | Why It Matters |
|---|---|
| Original price | Establishes promotion reference |
| Current price | Measures actual customer offer |
| Discount percentage | Quantifies promotion depth |
| Promotion start | Identifies campaign timing |
| Promotion end | Measures campaign duration |
| Seller | Identifies promotion owner |
| Marketplace | Shows geographic/channel scope |
| Product availability | Determines potential demand impact |
| Historical price | Shows whether promotion is unusual |
| Competitor average | Establishes market benchmark |
The German market demonstrates why this matters. Online marketplaces generated €44.0 billion in 2024 and €46.2 billion in 2025, while their share of German online merchandise sales increased to 56% in 2025.
Meanwhile, Kaufland's marketplace expanded into additional European markets and reported that merchants selling through its newer Poland and Austria marketplaces achieved an average revenue increase of 32% after launch.
From 2020 to 2026, marketplace pricing has therefore become increasingly interconnected with country expansion, promotional campaigns, seller growth, and changing consumer behavior.
Actionable insight: Build promotion calendars from observed marketplace data. When the same category repeatedly experiences price reductions around specific dates, retailers can use that historical pattern to forecast competitive pressure and plan inventory and campaigns earlier.
Actowiz Metrics can help brands build automated marketplace datasets that combine product, seller, pricing, promotion, and availability signals into structured competitive intelligence. Allegro Price Monitoring & Repricing Intelligence can support ongoing monitoring of competitive price movements, while Amazon.de vs Kaufland vs Allegro Price Monitoring EU can be operationalized as a multi-marketplace tracking framework.
A typical workflow can include:
The objective is not to collect data simply for reporting. The objective is to create a repeatable decision system that helps pricing, category, marketplace, and e-commerce teams answer questions such as:
For brands expanding across Europe, this distinction can directly improve the speed and quality of pricing decisions.
European marketplace competition is becoming more complex as platforms expand, seller counts increase, and consumers compare offers across multiple channels. E-commerce & D2C analytics gives retailers the broader analytical framework needed to connect product, pricing, seller, promotion, and availability data, while Amazon.de vs Kaufland vs Allegro Price Monitoring EU provides a focused approach for understanding competitive movement across three important European marketplaces.
The market evidence supports the need for continuous monitoring. German marketplace sales reached €46.2 billion in 2025 and represented 56% of online merchandise sales, while first-half 2026 marketplace revenue continued to grow 6.4%.
The strongest strategy is therefore not to react to every price change. It is to identify meaningful patterns, understand their causes, quantify their impact, and respond according to margin, demand, inventory, and competitive objectives.
Ready to turn marketplace price changes into actionable competitive intelligence? Partner with Actowiz Metrics to build a scalable European marketplace monitoring solution tailored to your products, competitors, and pricing goals!
Expert blogs, research reports and infographics — practical, data-driven reading across e-commerce and quick-commerce.
Most fields are optional — the more you share, the better your sample.
.webp "infographics")
.webp "infographics")