BLOG


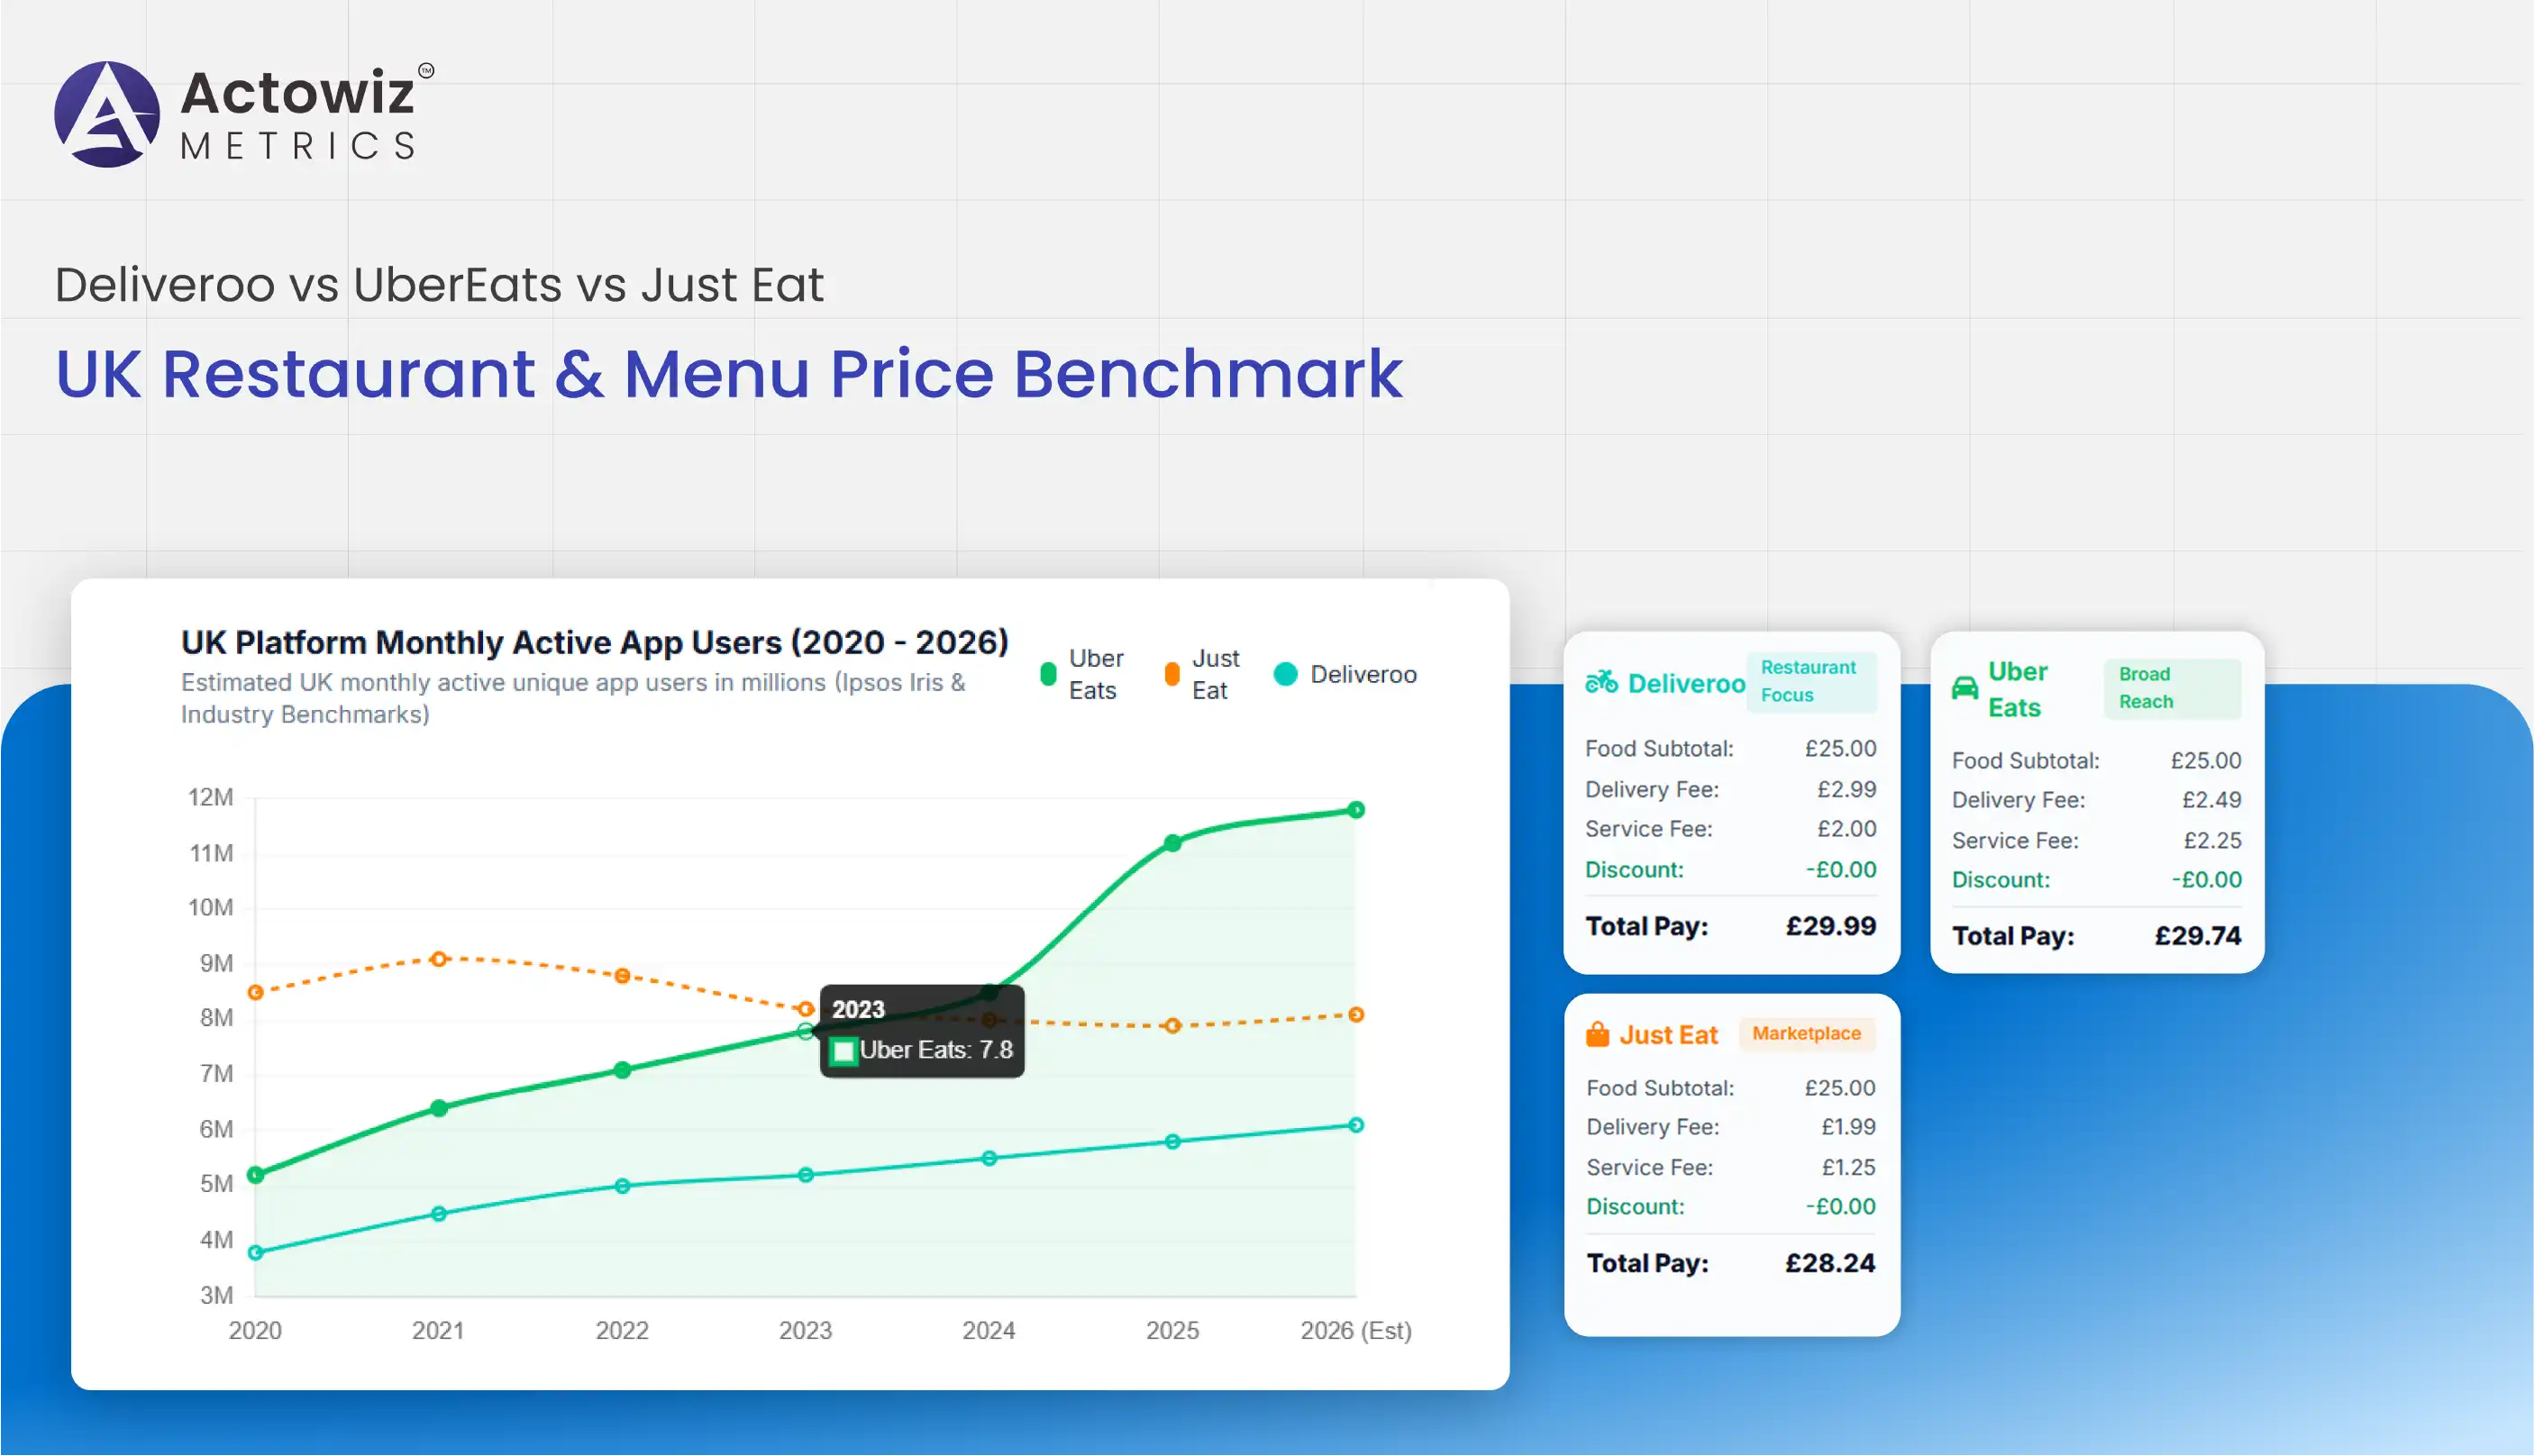
The United Kingdom's food delivery industry has evolved significantly between 2020 and 2026, with consumers increasingly comparing restaurant prices, menu variety, delivery charges, discounts, and convenience before placing orders. This UK Restaurant & Menu Price Benchmark report examines how Deliveroo, Uber Eats, and Just Eat compete across the UK market. Through Food & beverage analytics, restaurants, food brands, and market researchers can evaluate pricing differences, monitor menu changes, assess promotional strategies, and identify opportunities to improve competitiveness.
The three platforms serve overlapping but distinct customer needs. Just Eat has a broad takeaway marketplace, Deliveroo emphasizes restaurant delivery alongside grocery and retail offerings, and Uber Eats combines restaurant ordering with a wider delivery ecosystem. Their competitive positions vary by city, postcode, restaurant category, and customer segment.
A 2025 study published in Public Health Nutrition examined more than 21 million menu items from 71,532 food outlets listed on Just Eat across the UK. It reported a median menu-item price of £6.25 and found that 65.96% of outlets offered at least one promotion. These findings demonstrate the value of systematic menu monitoring, although they represent one platform and a specific research dataset rather than a current, live comparison of all three services. ">Source: Cambridge University research.
From 2020 to 2026, digital food ordering has moved beyond simple convenience. Consumers increasingly expect competitive prices, transparent fees, relevant discounts, and reliable availability. Businesses can use structured marketplace data to understand these expectations and make evidence-based decisions about menus, pricing, promotions, and distribution.
Menu pricing is one of the most visible factors influencing consumer decisions. Deliveroo vs Uber Eats vs Just Eat Menu Price Comparison enables businesses to investigate differences in listed prices for equivalent dishes, meal combinations, beverages, sides, and desserts across competing delivery applications.
| Year | Market Development | Pricing Intelligence Opportunity |
|---|---|---|
| 2020 | Pandemic restrictions accelerated online ordering | Establish baseline menu prices |
| 2021 | Digital ordering became more established | Compare prices across restaurant partners |
| 2022 | Food and operating costs placed pressure on restaurants | Track price increases |
| 2023 | Promotions remained widespread | Separate standard prices from discounts |
| 2024 | Delivery platforms continued broadening services | Compare restaurant and grocery pricing |
| 2025 | Research analyzed over 21 million Just Eat menu items | Benchmark menu prices at scale |
| 2026 | Competition increasingly depends on value and convenience | Maintain recurring price comparisons |
The 2023 dataset analyzed in the 2025 research found a median menu-item price of £6.25 across outlets on Just Eat. The study also identified meaningful differences by outlet type: small independent takeaways had a median item price of £6.80, major chains £4.70, and grocery stores £3.19. These figures describe the study's dataset and should not be treated as current prices across every restaurant or delivery platform. Source: Public Health Nutrition.
For a meaningful comparison, businesses must match equivalent products. A standard cheeseburger should not be compared with a larger meal that includes fries and a drink. Portion sizes, ingredient variations, add-ons, restaurant branches, and promotional conditions also need to be considered.
Between 2020 and 2026, pricing intelligence has become more useful when supported by historical records. Tracking price changes over time can reveal whether a restaurant is adjusting prices in response to costs, competitors, or seasonal demand. It can also help food brands assess whether their positioning remains competitive across different customer segments.
Actowiz Metrics can help businesses organize product-level observations into structured datasets, making it easier to identify pricing gaps, compare restaurant categories, and evaluate marketplace positioning.
Restaurant prices can vary considerably according to cuisine, location, portion size, brand positioning, and the cost of operating a business. Deliveroo, Uber Eats & Just Eat Restaurant Price Benchmarking helps businesses compare prices among similar restaurants and understand how these differences influence their competitive position.
| Year | Pricing Environment | Key Benchmarking Focus |
|---|---|---|
| 2020 | Delivery became essential for many restaurants | Establish price baselines |
| 2021 | Restaurant participation expanded | Compare local competitors |
| 2022 | Cost pressures affected food businesses | Monitor menu-price adjustments |
| 2023 | Price and promotion differences became measurable at scale | Segment restaurants by category |
| 2024 | Platforms continued developing additional services | Compare restaurant and adjacent categories |
| 2025 | Academic research documented substantial menu-price variation | Benchmark outlet types and cuisines |
| 2026 | Value positioning remains central to competition | Analyze price differences by postcode |
Research on Just Eat found that menu prices varied by cuisine. In the analyzed dataset, pizza had a median item price of £8.00, South Asian cuisine £7.00, and sandwich, café, and bakery categories £3.50. The differences illustrate why restaurant comparisons should account for category and product type rather than relying on a single market-wide average. Source: Cambridge Core.
Location is another important consideration. Restaurants operating in city centers may face different rental costs, customer expectations, and competitive conditions from outlets in suburban areas. Even within one city, delivery zones can contain different restaurant mixes and price ranges.
From 2020 through 2026, businesses have increasingly needed to understand not only what competitors charge but also why those prices differ. A useful benchmarking framework groups restaurants by cuisine, brand type, geographic area, portion size, and product category. It can then compare median prices, price ranges, and changes over time.
For restaurant groups, this approach supports branch-level consistency checks. For food brands, the Restaurant & Menu Data API provides insights into the prices consumers encounter when purchasing meals through different digital channels.
Menu assortment influences consumer choice, restaurant visibility, and the perceived value of a delivery platform. Deliveroo, Uber Eats & Just Eat Restaurant Menu Assortment Analysis helps businesses compare the number and types of available dishes, product variations, meal deals, dietary options, and category coverage across restaurants and delivery services.
| Year | Assortment Development | Analytical Opportunity |
|---|---|---|
| 2020 | Restaurants expanded digital menus | Establish assortment baselines |
| 2021 | Online ordering became more familiar | Compare item availability |
| 2022 | Meal combinations and bundles remained important | Analyze product structure |
| 2023 | Large-scale menu datasets enabled deeper analysis | Classify products consistently |
| 2024 | Grocery and convenience offerings broadened | Monitor additional categories |
| 2025 | Menu research covered tens of thousands of outlets | Identify assortment patterns |
| 2026 | Digital discovery and personalization continue to evolve | Track changing product visibility |
A restaurant may list dozens of dishes on one platform but display a smaller assortment on another. Differences may arise from restaurant preferences, platform configuration, stock availability, branch operations, or menu updates. Without recurring monitoring, these variations can be difficult to distinguish from temporary errors.
A structured dataset can capture restaurant names, menu-item names, descriptions, portion sizes, modifiers, cuisine categories, dietary labels, prices, ratings, and availability status. Product matching is particularly important when the same item appears under slightly different names across platforms.
Historical assortment data can also reveal menu innovation. A business might identify new product launches, discontinued dishes, seasonal menus, or increasing use of family bundles. When matched with pricing and promotional information, these changes provide a more complete picture of how restaurants compete.
Between 2020 and 2026, assortment monitoring has become increasingly valuable as delivery applications expand beyond traditional takeaway meals. Businesses may need to compare grocery products, convenience items, desserts, beverages, and prepared foods alongside restaurant dishes.
Actowiz Metrics can help transform menu observations into standardized datasets that support category analysis, product matching, availability monitoring, and competitive reporting. These insights help businesses evaluate whether their digital assortment meets customer expectations and where opportunities exist to expand or optimize their menus.
Promotions can influence both the initial decision to order and the likelihood of repeat purchases. Deliveroo, Uber Eats & Just Eat Menu Discounts and Promotions Comparison helps businesses examine how discounts, free items, meal bundles, loyalty rewards, and delivery-related offers vary across platforms and restaurant categories.
| Year | Promotional Development | Monitoring Priority |
|---|---|---|
| 2020 | Platforms used offers to encourage digital adoption | Identify introductory discounts |
| 2021 | Customer acquisition remained important | Compare promotion frequency |
| 2022 | Affordability became a greater concern | Measure discount depth |
| 2023 | Multiple promotion formats appeared across menus | Classify offers consistently |
| 2024 | Digital advertising and loyalty gained importance | Monitor offer visibility |
| 2025 | Research documented widespread outlet promotions | Compare offer types and conditions |
| 2026 | Targeted offers continue to shape competition | Track eligibility and duration |
The UK study published in 2025 found that 65.96% of outlets in its Just Eat dataset offered at least one promotion. The researchers examined six categories: percentage discounts, stamp cards, free items, meal-deal notifications, buy-one-get-one-free offers, and low delivery fees. The study's results show that promotions are an important feature of the online food environment, though the observed rates should not automatically be applied to Deliveroo or Uber Eats. Source: Public Health Nutrition.
Comparing promotions requires more than recording a discount percentage. Businesses should capture the minimum order value, maximum discount, eligible products, validity period, restaurant participation, and any membership restrictions. A 25% discount with a spending cap may provide less savings than a fixed-value offer for a particular basket.
Promotional analysis also benefits from historical data. Recurring snapshots can show whether a restaurant frequently discounts certain dishes, introduces special weekend offers, or uses meal bundles to increase order value. When compared with standard prices, these observations can help businesses distinguish regular pricing from temporary promotional activity.
From 2020 to 2026, promotion monitoring has become a useful tool for understanding competitive value. Restaurants can benchmark their offers, while food brands and researchers can examine how discounting differs by cuisine, geography, and outlet type.
A menu item's displayed price is only one component of the total amount paid by a customer. Delivery fees, service charges, small-order fees, minimum basket values, tips, and membership benefits may change the final checkout amount. Deliveroo vs Uber Eats vs Just Eat Total Order Cost Comparison provides a framework for examining these differences across equivalent orders.
| Year | Consumer Cost Consideration | Analytical Focus |
|---|---|---|
| 2020 | Delivery fees became increasingly visible | Capture listed charges |
| 2021 | Offers affected final basket value | Compare discounted totals |
| 2022 | Cost pressures influenced customer decisions | Monitor changes in item prices |
| 2023 | Loyalty programs affected delivery economics | Evaluate membership conditions |
| 2024 | Consumers had multiple ordering channels | Compare delivery and direct prices |
| 2025 | Grocery-app research highlighted price differences | Separate menu and convenience costs |
| 2026 | Value comparisons remain important | Track complete order economics |
A 2025 investigation by Which? compared supermarket grocery prices across Deliveroo, Just Eat, and Uber Eats and found that shoppers could pay at least 20% more on average for the convenience of app-based grocery delivery, with some items costing more than twice as much. This finding concerns selected grocery products in a snapshot investigation; it should not be interpreted as a general estimate for restaurant meals. Source: Which?.
The finding nevertheless demonstrates why businesses need to distinguish product prices from convenience-related costs. A fair restaurant comparison should use equivalent baskets and record the same delivery location, collection time, order value, and eligibility conditions wherever possible.
A total-order dataset might include item subtotals, discounts, delivery fees, service charges, minimum-order requirements, membership-related savings, and the final displayed checkout total. Tips and optional charges should be recorded separately where applicable. Taxes should be included or excluded consistently according to the purpose of the analysis.
Between 2020 and 2026, this approach has become increasingly useful for evaluating affordability and value. Restaurants can compare the customer-facing cost of equivalent meals, while food brands can assess whether promotions create meaningful savings.
Actowiz Metrics can help businesses organize these records for consistent cross-platform analysis. By combining menu prices, fees, and promotions, organizations can identify cost differences that a simple menu-price comparison would overlook.
The UK food delivery market continues to evolve through changing consumer preferences, platform innovation, expanded retail offerings, and stronger competition for digital audiences. UK Food Delivery Market Trends and Competitor Intelligence enables businesses to monitor these developments and assess how they influence restaurant visibility, menu strategy, and customer value.
| Year | Market Development | Strategic Opportunity |
|---|---|---|
| 2020 | Delivery adoption accelerated | Establish digital marketplace presence |
| 2021 | Ordering habits became more established | Improve online visibility |
| 2022 | Operational efficiency gained importance | Review pricing and fulfilment |
| 2023 | Large-scale menu research revealed price and promotion differences | Develop structured benchmarks |
| 2024 | Platforms continued expanding their service ecosystems | Track new categories |
| 2025 | Uber Eats reached a record 11.2 million UK app users in August | Analyze platform audience trends |
| 2026 | Delivery competition includes broader convenience services | Strengthen recurring market monitoring |
Ipsos iris reported that Uber Eats reached 11.2 million UK app users in August 2025, its highest monthly audience at that time and 48% above the previous year. In the same month, Just Eat had 7.9 million app users and Deliveroo had 5.8 million. These are audience figures, not unique customer counts across the whole year or direct measures of completed food orders. Source: Ipsos iris.
The figures highlight why competitive analysis should consider more than menu prices alone. Audience reach, restaurant selection, promotional visibility, loyalty programs, and ordering convenience can all influence a platform's position in the market. Businesses should also distinguish app audience measures from actual purchases, order frequency, and restaurant-level sales.
From 2020 to 2026, the industry has become increasingly data-driven. Restaurants and food brands can benefit from monitoring competitor prices, menu changes, ratings, promotions, and availability over time. These observations can reveal market shifts that may not be apparent from a single snapshot.
Geographic segmentation is equally important. London, other large cities, suburban areas, and smaller towns may have different restaurant mixes, delivery coverage, and competitive conditions. Comparing these locations separately can provide more useful insights than relying on a single national average.
For businesses, the objective is to build a consistent evidence base that supports decisions about pricing, menu design, promotion, and marketplace participation. Historical datasets help teams recognize recurring patterns and distinguish sustained changes from short-term fluctuations.
Actowiz Metrics helps businesses convert publicly available digital marketplace information into structured datasets for pricing intelligence, menu monitoring, competitive research, and business analysis. For the UK food delivery market, these capabilities can support recurring comparisons across Deliveroo, Uber Eats, Just Eat, restaurant categories, and geographic areas.
Key benefits include:
For brands and restaurant groups seeking deeper product-level insights, Uber Eats Bestselling Brands Analytics can support research into brand visibility, product assortment, listed prices, promotions, ratings, and availability where these attributes are accessible. Such datasets can help identify prominent brands and assess how their digital offerings compare with competing businesses.
Actowiz Metrics can also help businesses establish repeatable collection schedules and validation processes. This is important because restaurant listings and menus can change frequently, and inconsistent collection methods can lead to misleading comparisons.
By bringing together structured data collection, normalization, and analytical reporting, Actowiz Metrics supports a more consistent approach to competitive research. Businesses can use these insights to improve pricing decisions, review their digital assortment, assess promotional strategies, and identify opportunities for growth.
The UK food delivery market has become increasingly competitive between 2020 and 2026, with Deliveroo, Uber Eats, and Just Eat offering overlapping services while competing on restaurant selection, pricing, promotions, convenience, and digital engagement. Research into UK menu prices and promotions demonstrates the value of structured marketplace data, while audience measurements show that platform reach can change significantly over time.
For restaurants and food brands, an effective benchmarking strategy should combine equivalent menu-item comparisons with total order costs, promotion conditions, assortment monitoring, and location-specific analysis. It should also distinguish historical research findings from current platform observations and avoid treating one platform's results as representative of the entire market.
A reliable data collection process can help businesses identify pricing gaps, understand competitor activity, and monitor changes in customer-facing offers. With recurring datasets and consistent analytical methods, organizations can make better-informed decisions about menu design, pricing, promotions, and digital distribution.
Actowiz Metrics can support these efforts by helping businesses organize marketplace information into structured datasets that enable ongoing competitive analysis and more informed commercial planning.
Partner with Actowiz Metrics to build scalable restaurant and menu price intelligence datasets, benchmark Deliveroo, Uber Eats, and Just Eat, and turn UK food delivery market data into actionable business insights!
Expert blogs, research reports and infographics — practical, data-driven reading across e-commerce and quick-commerce.
Most fields are optional — the more you share, the better your sample.
.webp "infographics")
.webp "infographics")