BLOG
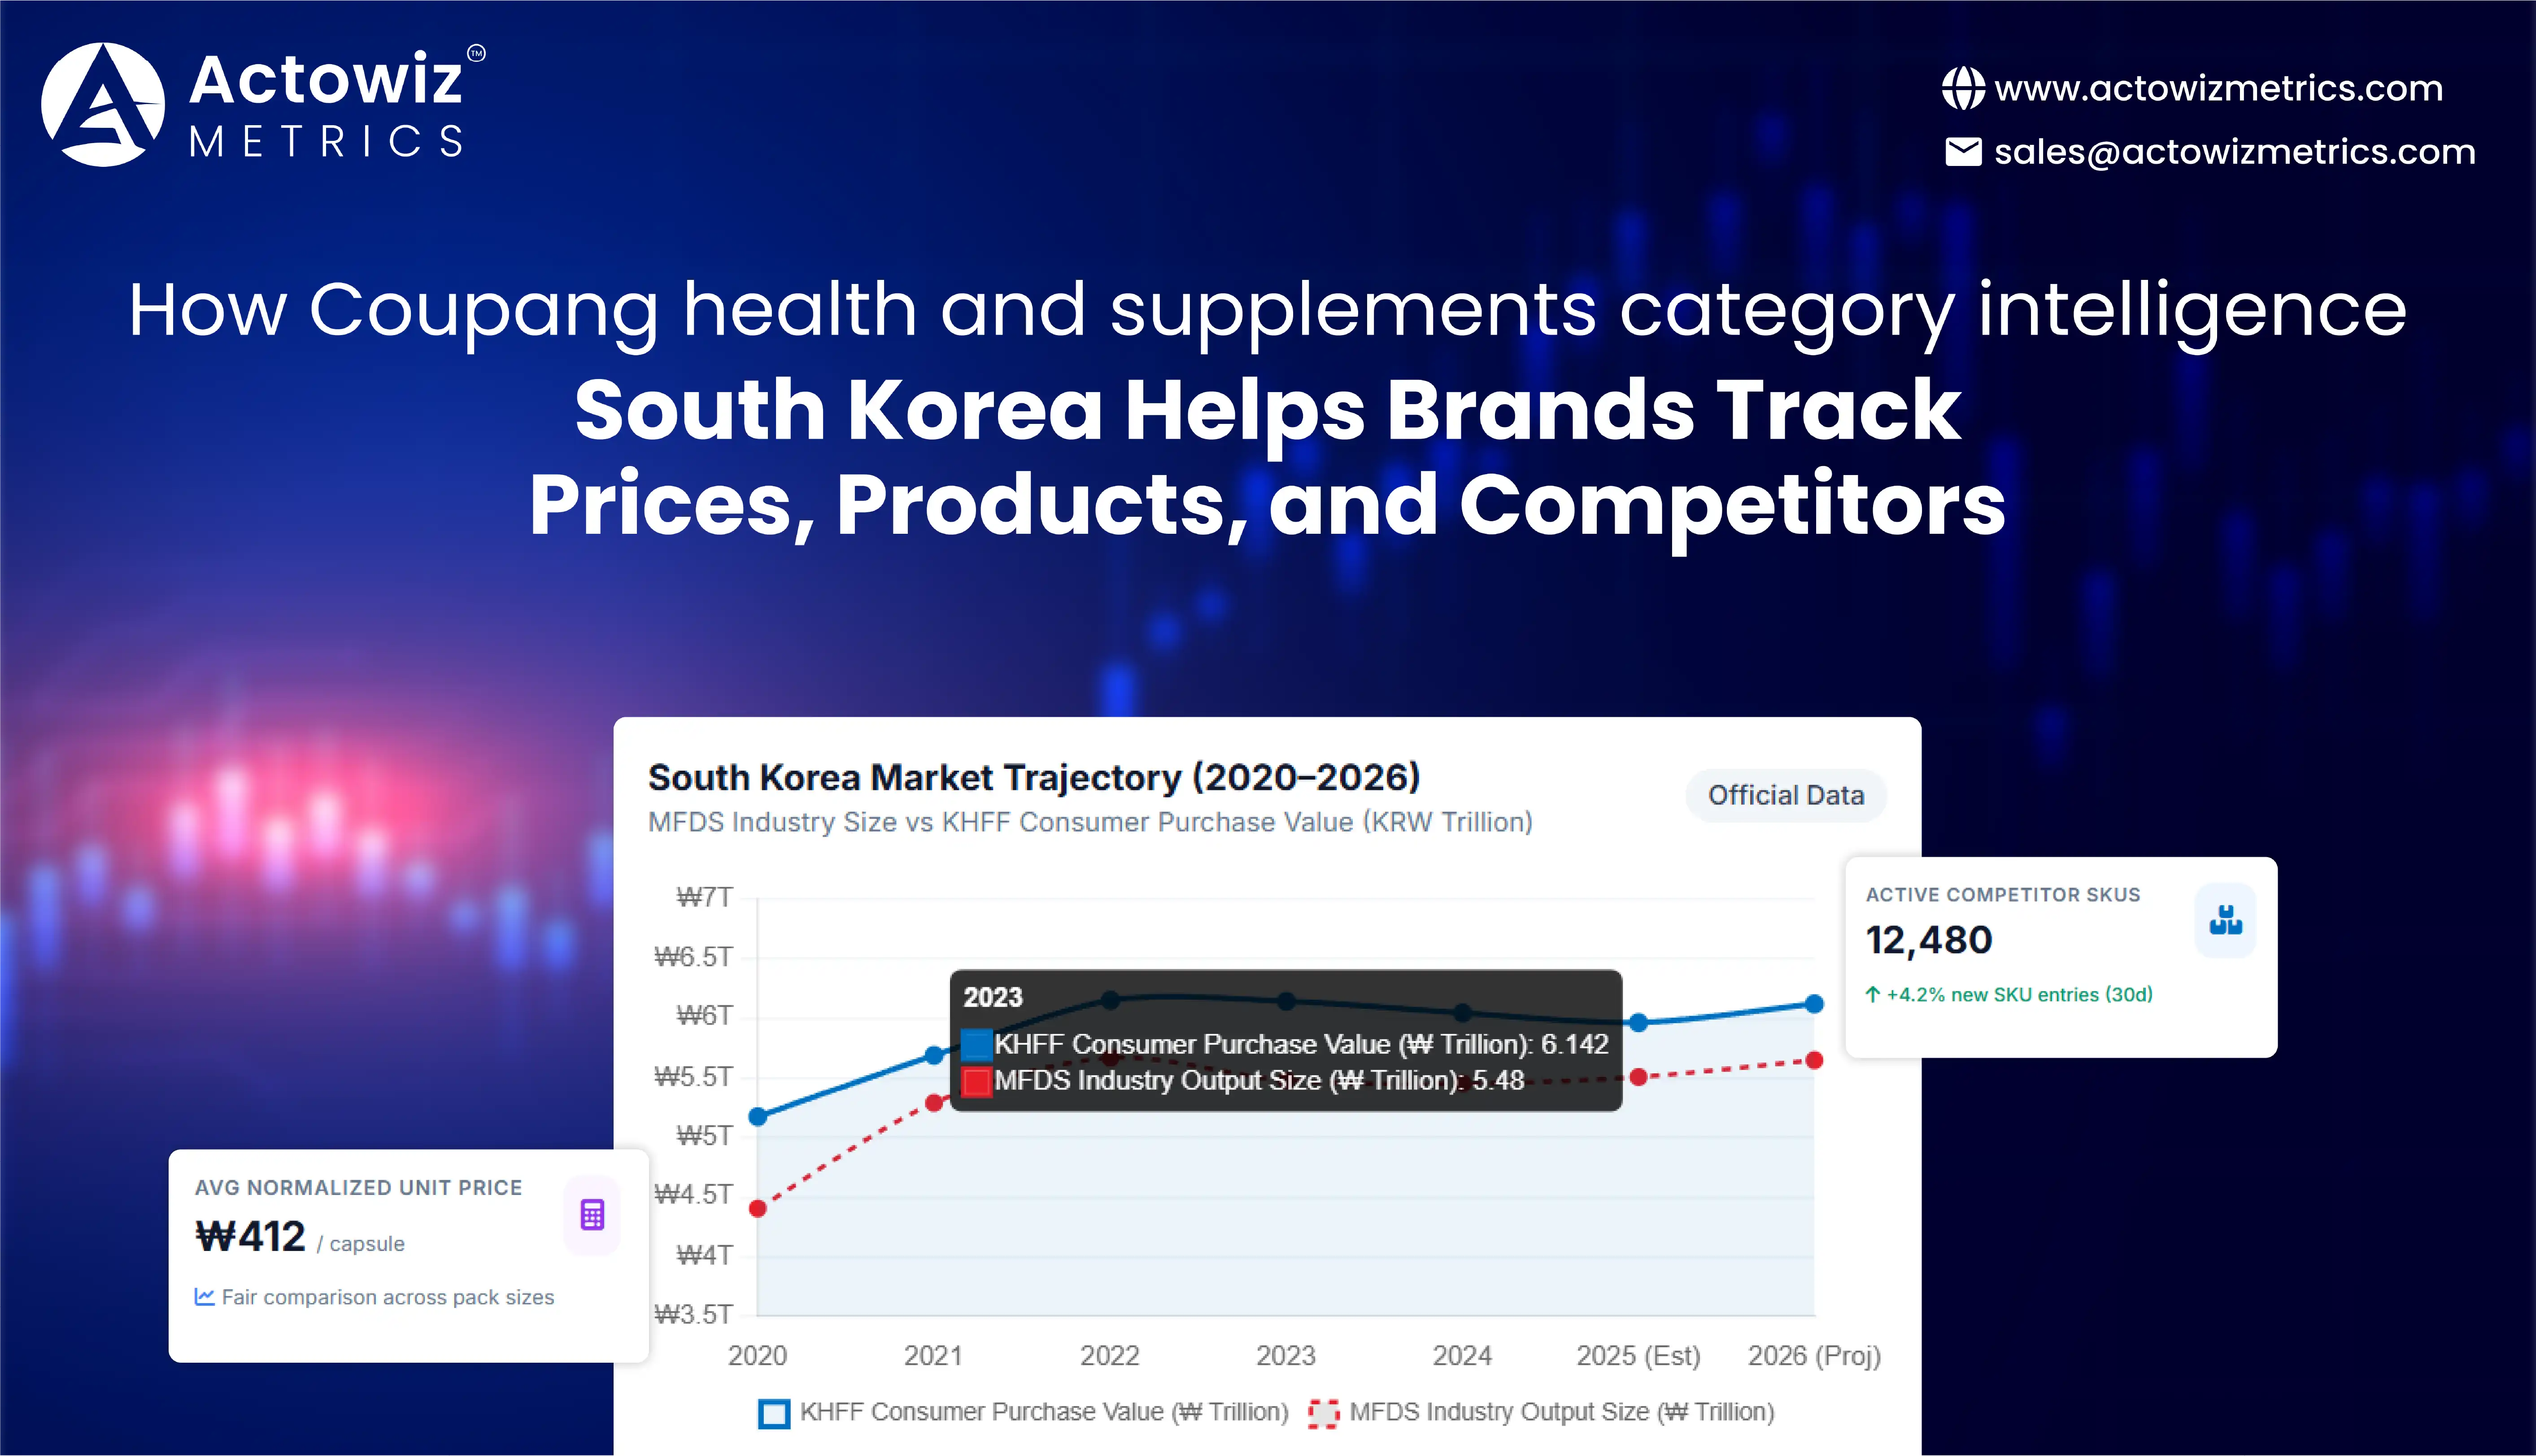


Coupang health and supplements category intelligence South Korea helps brands turn rapidly changing marketplace signals into decisions around pricing, assortment, availability, promotions, and competitor positioning. The need is substantial: Korea's health functional food market reached approximately KRW 5.45 trillion in 2024 on an MFDS-based market-size calculation, while the Korean Health Functional Food Association reported a consumer-purchase-value market of about KRW 5.96 trillion in 2025.
For brands selling vitamins, probiotics, red ginseng, omega-3, minerals, weight-management products, and other wellness products, marketplace visibility is no longer limited to knowing a competitor's listed price. Decision-makers need to understand which products appear, how pack sizes differ, which brands repeatedly gain visibility, when promotions change, whether products remain available, and how competitive conditions evolve.
Coupang is particularly important because its Product Commerce business reported 24.6 million active customers in Q4 2025, up 8% year over year. That scale makes marketplace observation useful for manufacturers, distributors, D2C brands, retailers, agencies, and category managers.
The practical answer is straightforward: collect recurring marketplace observations, normalize them by SKU and brand, compare price and promotion movements, monitor availability, and combine these signals with broader Korean health-market trends. This creates a decision layer that supports faster category planning without relying on isolated screenshots or manually checked listings.
Data note: Coupang does not publicly disclose every category-level SKU, ranking, seller, price, or availability metric in its corporate financial releases. Therefore, Coupang-specific category tables below describe recommended intelligence metrics and analytical methods, while external market figures are clearly identified as real-world published data.
Coupang health supplement competitor analysis South Korea provides a structured way to understand the competitive environment at SKU, brand, seller, and subcategory levels. Instead of comparing only headline prices, brands can build a competitor matrix covering product title, brand, dosage, pack count, formulation, seller, current price, discount, rating, review count, availability, delivery promise, and marketplace visibility.
This matters because health supplements are highly comparable products. A 60-capsule vitamin product and a 120-capsule product cannot be compared solely on displayed price. Normalizing price by capsule, serving, gram, or functional ingredient can reveal meaningful differences.
| Data Group | Example Fields | Business Application |
|---|---|---|
| Product identity | Product name, SKU, brand | Product matching and tracking |
| Formulation | Ingredient, dosage, serving size | Like-for-like comparison |
| Packaging | Count, weight, format | Normalized price calculation |
| Commercial | List price, selling price, discount | Price benchmarking |
| Seller | Seller name, offer status | Channel intelligence |
| Consumer proof | Rating, review count | Trust assessment |
| Availability | In stock/out of stock | Supply monitoring |
| Marketplace | Category, position, URL | Visibility tracking |
| Compliance context | Claims/label information where publicly displayed | Regulatory monitoring |
| Time series | Collection timestamp | Historical trend analysis |
From 2020 through 2026, the Korean supplement landscape has moved from pandemic-driven demand toward a more mature and competitive wellness market. The Korean Health Functional Food Association reports that the overall health functional food market, using its MFDS-based series, increased from KRW 4.40 trillion in 2020 to KRW 5.45 trillion in 2024, equivalent to a 5.5% average annual growth rate. Consumer-purchase-value estimates show another perspective: the association reported KRW 5.175 trillion in 2020, KRW 5.690 trillion in 2021, KRW 6.150 trillion in 2022, KRW 6.142 trillion in 2023, and an estimated KRW 6.044 trillion in 2024. By 2025, the association reported KRW 5.963 trillion and an 83.6% household purchase-experience rate. For 2026 planning, the implication is not simply market growth; it is the need to distinguish genuine demand from promotional visibility, pack-size changes, assortment expansion, and competitive displacement. A recurring dataset can expose these movements at SKU level rather than treating the market as one aggregate number.
Coupang Bestselling Brands Analytics can calculate:
This helps category managers move from "Who is visible today?" to "Which brands consistently maintain marketplace visibility?"
Coupang health supplement price monitoring Korea enables brands to capture price movements continuously rather than relying on occasional manual checks. For a category manager, the critical metric is not simply the lowest price. It is the relationship between list price, selling price, discount, pack size, seller, promotion duration, and comparable unit economics.
For example, a competitor reducing a 30-count supplement from KRW 29,900 to KRW 24,900 is not directly comparable with another brand selling 90 counts for KRW 49,900. A normalized dataset can calculate price per capsule or price per serving.
| Metric | Formula / Measurement | Business Use |
|---|---|---|
| Current selling price | Observed marketplace price | Price benchmarking |
| List price | Original displayed price | Discount calculation |
| Discount % | (List − selling) ÷ list × 100 | Promotion intensity |
| Unit price | Selling price ÷ count/serving/gram | Normalized comparison |
| Price gap | Brand price − competitor price | Competitive positioning |
| Price-change frequency | Changes ÷ observations | Volatility detection |
| Promotion duration | Days in promotional state | Campaign analysis |
| Seller price divergence | Max − min seller price | Channel complexity |
Pricing intelligence became increasingly important as the Korean health-functional-food market shifted from rapid expansion to more moderate growth. The MFDS-based series shows total market size increasing from KRW 4.4017 trillion in 2020 to KRW 5.4548 trillion in 2024, but annual growth slowed from 13.8% in 2020 to -0.6% in 2024. At the same time, imports reached KRW 1.4417 trillion in 2024, up 3.3% year over year, while exports reached KRW 380.2 billion, up 17.3%. This creates a more complicated pricing environment because domestic and imported products can compete across overlapping consumer needs. Meanwhile, Korean online commerce continues to operate at enormous scale: Statistics Korea reported KRW 21.2147 trillion in total online shopping transaction value in December 2024, with mobile transactions accounting for KRW 16.2048 trillion. For 2026, brands therefore benefit from tracking not just whether competitors discount, but whether discounting becomes more frequent, deeper, or concentrated around particular subcategories.
This turns raw marketplace observations into pricing alerts.
Coupang Health Category Competitive Data Analytics connects product, price, brand, seller, review, ranking, and availability signals into a single analytical model. This is valuable because category performance rarely depends on one variable.
A brand may have a competitive price but weak visibility. Another may have a higher price but stronger reviews and broader assortment. A third may gain visibility because it launches multiple pack configurations.
| Dimension | Example KPI | Strategic Use |
|---|---|---|
| Assortment | Active SKUs by brand | Identify portfolio breadth |
| Visibility | Search/rank observations | Track marketplace presence |
| Pricing | Median normalized price | Benchmark positioning |
| Promotion | % promoted SKUs | Measure promotional pressure |
| Trust | Rating/review volume | Assess customer proof |
| Availability | In-stock observation rate | Identify supply gaps |
| Innovation | New SKUs/month | Track category activity |
| Seller structure | Sellers/SKU | Understand channel complexity |
The objective is not to create an unsupported "winner" ranking. It is to make the competitive variables measurable and comparable.
The 2020-2026 period illustrates why multidimensional analysis matters. Korea's health functional food market expanded rapidly in 2020 and 2021, with the MFDS-based market-size series growing 13.8% and 20.2%, respectively. Growth moderated to 7.2% in 2022, declined 3.2% in 2023, and declined another 0.6% in 2024. Yet individual functional categories continued to attract strong consumer interest. The Korean Ministry of Food and Drug Safety highlighted 2025 sales leaders including vitamins, red ginseng, probiotics, EPA/DHA-containing oils such as omega-3, and body-fat-reduction products; these five groups together represented KRW 3.2359 trillion in sales. That concentration creates an analytical opportunity: brands can compare category saturation, brand participation, price architecture, assortment depth, and promotional behavior rather than interpreting total market size alone. In 2026, the most useful competitive dashboards should therefore connect category-level market signals with SKU-level marketplace observations.
Coupang Health Product Availability Tracking South Korea helps brands understand whether products remain consistently purchasable. Availability is often treated as an operational issue, but on a marketplace it also affects visibility, customer substitution, competitor opportunity, and sales continuity.
A product that repeatedly becomes unavailable can lose marketplace momentum while competing SKUs remain visible. Monitoring can capture whether the issue is isolated to one seller or appears across multiple offers.
| Signal | What It Can Reveal |
|---|---|
| In stock | Product is currently purchasable |
| Out of stock | Potential supply or seller issue |
| Seller unavailable | Offer-level disruption |
| New seller appears | Marketplace competition |
| Delivery change | Possible inventory/location pressure |
| SKU disappears | Listing or assortment change |
| Pack-size substitution | Portfolio or inventory adjustment |
Between 2020 and 2026, availability has become increasingly connected with digital purchasing behavior. Statistics Korea reported that mobile shopping represented 76.3% of total online shopping transaction value in September 2024, up from 72.2% a year earlier. That environment reduces the tolerance for friction because consumers can move rapidly between comparable products. Coupang's own Product Commerce customer base also expanded materially: active customers increased from 21.5 million in Q1 2024 to 22.8 million in Q4 2024, then reached 24.6 million in Q4 2025. These figures are platform-wide rather than health-category-specific, but they demonstrate the scale at which marketplace availability signals can matter. For 2026, brands can use recurring observations to distinguish genuine assortment changes from temporary stockouts and seller-level interruptions. Combining availability with price data is especially useful: a competitor that becomes unavailable while another SKU simultaneously raises its price may signal a short-term market opportunity worth investigating.
The result is a marketplace early-warning system rather than a simple inventory report.
Coupang supplement marketplace intelligence Korea gives manufacturers and retailers a broader view of category evolution. The focus moves from individual products to market structures: emerging brands, new ingredients, pack formats, price bands, sellers, promotions, and consumer response.
This can support decisions about product launches, assortment expansion, competitive benchmarking, and campaign planning.
| Opportunity Signal | Example Interpretation |
|---|---|
| New brand acceleration | Emerging competitor gaining visibility |
| New ingredient | Potential product-development trend |
| Rapid SKU growth | Category expansion |
| Review acceleration | Growing customer attention |
| Repeated promotion | Strong price competition |
| High-price new entry | Premiumization signal |
| Low-price new entry | Value segment pressure |
| New pack format | Changing consumer proposition |
The Korean supplement market shows a clear transition from broad pandemic-era demand to more segmented health-management routines. The Korean Health Functional Food Association's 2020-2024 data shows the market growing from KRW 4.4017 trillion to KRW 5.4548 trillion using the MFDS-based calculation. The association's consumer research also indicates high household participation: its 2025 research reported an 83.6% purchase-experience rate, the highest level in its recent five-year series. At the product level, vitamins, red ginseng, probiotics, omega-3-related products, and body-fat-reduction products were identified among the leading functional-food groups in 2025, with the five categories collectively reaching KRW 3.2359 trillion in sales. These numbers suggest a market with broad adoption but substantial category specialization. From 2020 through 2026, marketplace intelligence can therefore help businesses detect where growth is occurring within the broader health category rather than assuming that all supplements behave alike. For 2026 planning, the strongest signals may come from combinations of rising visibility, stable availability, increasing reviews, new formulations, and changing price bands.
A recurring dataset can identify:
These insights can feed product development, marketplace expansion, campaign planning, and portfolio rationalization.
Health Pharma, Coupang health and supplements category intelligence South Korea becomes more valuable when brands connect marketplace observations with the wider regulated health-product environment. Health-related products require greater attention to product claims, ingredients, dosage information, labeling, seller identity, and regulatory status than many ordinary consumer categories.
This makes structured data particularly useful for compliance-oriented monitoring and portfolio intelligence.
| Data Group | Example Fields |
|---|---|
| Product identity | Product name, SKU, brand |
| Formulation | Ingredient, dosage, serving size |
| Packaging | Count, weight, format |
| Commercial | List price, selling price, discount |
| Seller | Seller name, offer status |
| Consumer proof | Rating, review count |
| Availability | In stock/out of stock |
| Marketplace context | Category, position, URL |
| Compliance context | Claims/label information where publicly displayed |
| Time series | Collection timestamp |
The regulatory and commercial environment has also evolved alongside category growth. In 2024, Korea's health functional food market, according to the MFDS-based series published by the Korean Health Functional Food Association, recorded KRW 3.633 trillion in shipments for domestic use and KRW 1.442 trillion in qualifying imports, while exports reached KRW 380.2 billion. The MFDS also issued amendments to health-functional-food standards in March 2025, including changes affecting specified functional ingredients, nutrient standards, daily intake levels, and precautions. These developments reinforce the importance of preserving historical product observations. A marketplace dataset collected in 2026 should not simply overwrite yesterday's product record because historical changes can explain why a product's description, formulation, pack size, or positioning changed. From 2020 to 2026, the strategic value of marketplace data has therefore shifted from basic price collection toward longitudinal product intelligence. For brands, the useful question is increasingly not just "What is listed today?" but "How has this product, brand, seller, price, and availability profile changed over time?"
Historical records can reveal:
This creates a defensible evidence base for category decisions.
Actowiz Metrics can help businesses build a structured marketplace intelligence pipeline around health and supplement products. The workflow can capture product, brand, seller, pricing, promotional, rating, review, availability, category, and timestamp fields and organize them into analytics-ready datasets.
The goal is not simply to collect more records. It is to create a repeatable intelligence layer that makes marketplace changes measurable.
Track priority SKUs, competitor products, new listings, removed listings, pack sizes, formulations, and brand portfolios.
Normalize comparable products and calculate brand-level and SKU-level benchmarks.
Price & promotion intelligence can monitor selling prices, discounts, promotional periods, price gaps, and historical changes to identify competitive pricing movements.
Build category dashboards covering assortment, visibility, pricing, reviews, availability, and seller activity.
Store timestamped observations so teams can compare current conditions against previous weeks, months, and campaign periods.
Structured datasets can be prepared for dashboards, BI platforms, spreadsheets, databases, or downstream analytical workflows.
| Layer | Output |
|---|---|
| Collection | Recurring marketplace observations |
| Normalization | Standardized SKU, brand, seller and price fields |
| Validation | Duplicate and inconsistent-record checks |
| Enrichment | Unit-price, discount and benchmark calculations |
| Historical storage | Timestamped marketplace snapshots |
| Analytics | Competitor, pricing and availability dashboards |
| Alerts | Significant price, stock and assortment changes |
| Business output | Category, pricing and assortment decisions |
The advantage is continuity. A one-time dataset provides a snapshot; recurring collection creates a market history that can support trend detection and competitive analysis.
Coupang health and supplements category intelligence South Korea gives brands a practical framework for understanding a fast-moving digital health marketplace. Korea's health functional food market has expanded materially since 2020, while consumer participation remains high and Coupang operates at significant marketplace scale.
For brands, the opportunity is to connect product assortment, competitor activity, normalized pricing, promotions, availability, seller behavior, reviews, and historical changes into one analytical view. The result is more actionable than isolated product checks because it shows what changed, when it changed, how competitors responded, and where the next business question should be investigated.
The most effective approach is continuous monitoring with standardized fields, timestamped records, validation rules, and business-focused dashboards. This allows category teams to move from reactive marketplace observation toward structured decision support.
Ready to turn marketplace signals into actionable health and supplement intelligence? Contact Actowiz Metrics to build a scalable data collection and analytics workflow tailored to your target categories, brands, SKUs, and competitive benchmarks!
Expert blogs, research reports and infographics — practical, data-driven reading across e-commerce and quick-commerce.
Most fields are optional — the more you share, the better your sample.
.webp "infographics")
.webp "infographics")