BLOG




















Black Friday Price Monitoring 2026 helps retailers and brands compare competitor prices, validate advertised discounts, track promotional changes, and make profitable pricing decisions across Amazon, Walmart, Target, and Best Buy. Using Amazon analytics alongside structured retail data enables e-commerce teams to identify pricing gaps, monitor product availability, and respond to competitive offers without automatically matching every discount.
For retailers, the central challenge is not simply finding the lowest advertised price. It is understanding whether a deal is genuinely competitive, whether the same product is available under comparable conditions, and whether matching the offer will preserve profit margins. During the Black Friday period, prices, coupons, bundles, inventory, and delivery promises can change quickly. A comparison based on outdated or mismatched listings can lead to poor decisions.
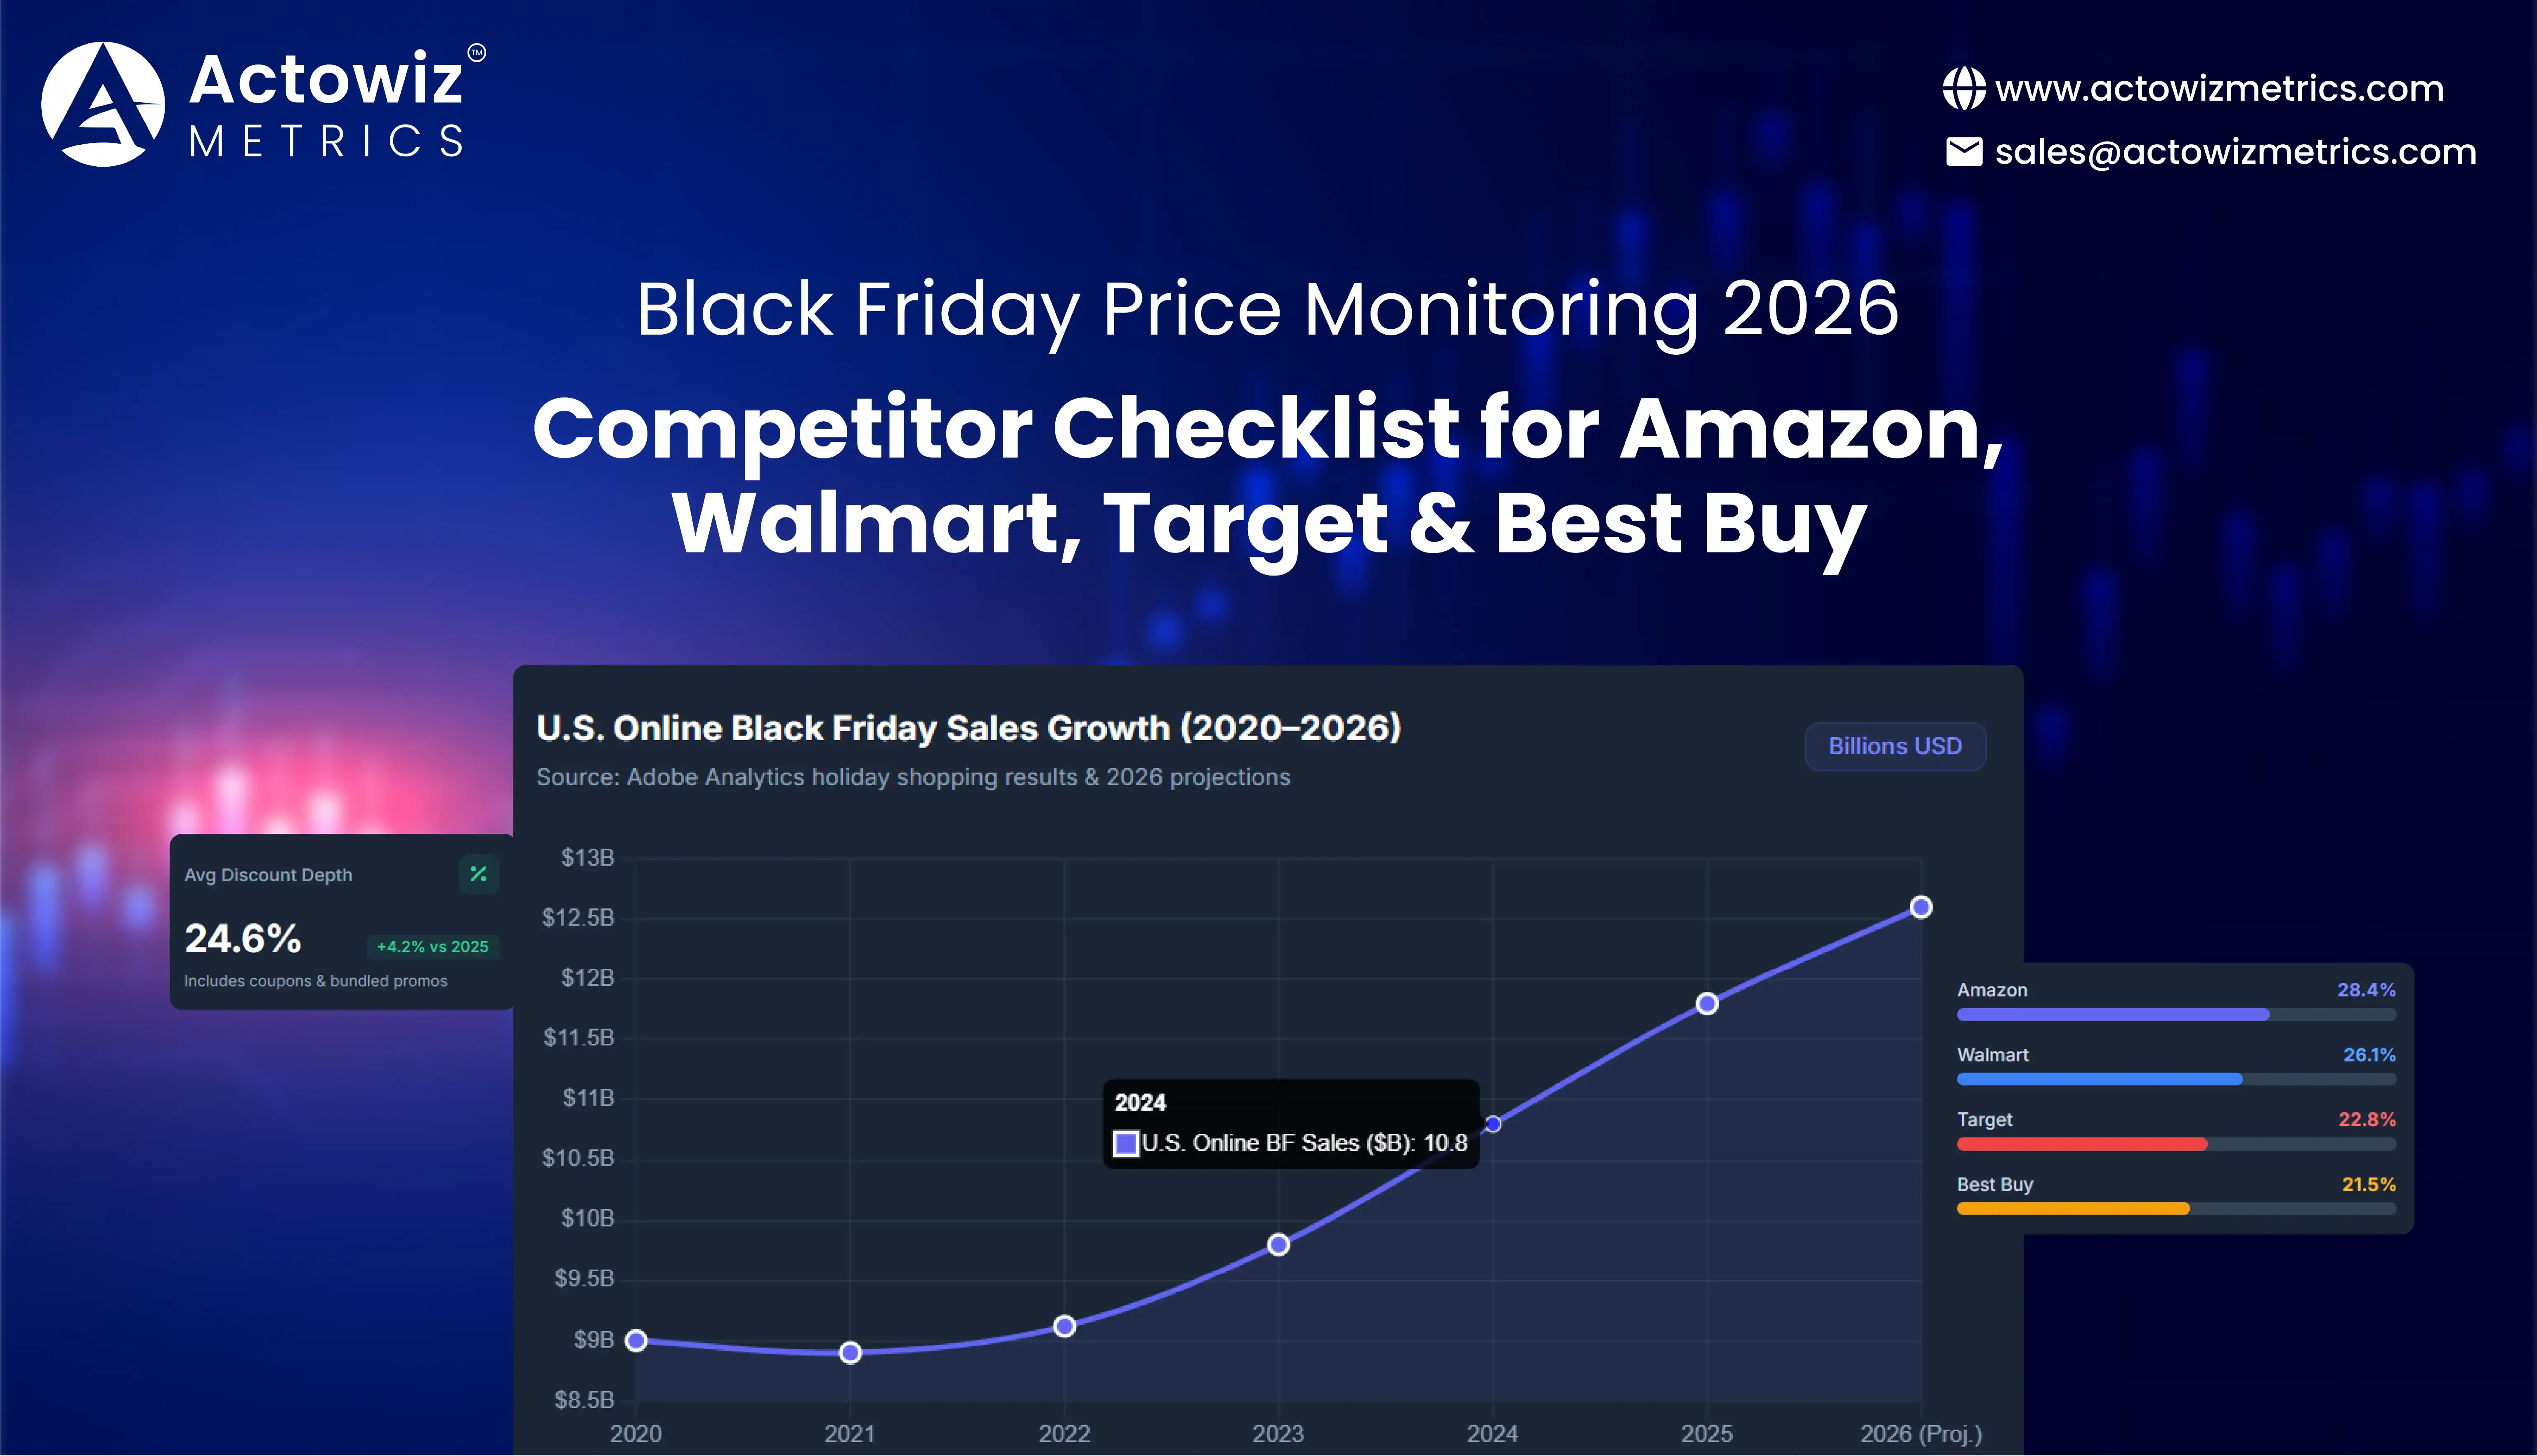
The National Retail Federation (NRF) reported that 197 million consumers shopped in stores and online during the five-day Thanksgiving-through-Cyber-Monday period in 2024, exceeding its initial expectations. Adobe Analytics separately reported US$10.8 billion in U.S. online sales on Black Friday 2024, a 10.2% increase over 2023. These measures cover different things: one counts shoppers across the five-day period, while the other measures online spending on Black Friday itself. Together, they illustrate why retailers need both market context and product-level competitive evidence.
This checklist explains what brands should track, how to build reliable historical comparisons from 2020 through 2026, and how Actowiz Metrics can help pricing, merchandising, and marketplace teams prepare for the holiday shopping rush.
A coordinated Amazon, Walmart, Target and Best Buy Black Friday price monitoring process starts with a clean list of comparable products. Retailers should match identical models, model numbers, sizes, colors, pack quantities, and configurations before comparing offers. This is particularly important for electronics, where small differences in memory, accessories, model year, or bundled services can make two listings appear comparable when they are not.
Teams should record the regular displayed price, current promotional price, coupon eligibility, shipping costs, membership restrictions, seller identity, and availability. On Amazon, for example, a product may be sold by Amazon or a third-party merchant. Walmart and Target also have marketplace listings alongside retailer-sold products. Best Buy promotions may involve product bundles, trade-in conditions, or membership-related benefits. Analysts should preserve these distinctions rather than treating every displayed offer as directly equivalent.
| Year | Real-world shopping indicator | How retailers should interpret it |
|---|---|---|
| 2020 | Adobe reported US$9.0 billion in U.S. online sales on Black Friday. | Use pandemic-era online shopping as a distinct historical period rather than a universal baseline. |
| 2021 | Adobe reported US$8.9 billion in U.S. online Black Friday sales. | Compare promotional depth and product availability with the prior year, accounting for changing demand. |
| 2022 | Adobe reported US$9.12 billion in U.S. online Black Friday sales. | Monitor price changes across the full event rather than relying on a single snapshot. |
| 2023 | Adobe reported US$9.8 billion in U.S. online Black Friday sales. | Evaluate competitive pricing alongside product demand and inventory. |
| 2024 | Adobe reported US$10.8 billion in U.S. online Black Friday sales. | Prepare for high-volume traffic and rapid promotional changes. |
| 2025 | Use published 2025 results and retain their original definitions when building year-over-year comparisons. | Separate measured outcomes from forecasts and avoid mixing daily sales with multi-day totals. |
| 2026 | Full Black Friday results are not yet available as of October 12, 2026. | Establish pre-sale baselines now and capture actual prices and availability throughout the event. |
Source for 2020–2024: Adobe Analytics holiday shopping reports and Black Friday results. Figures are U.S. online sales estimates, not sales attributed to individual retailers.
For the 2026 event, build a baseline several weeks before Black Friday. Collect regular prices and promotional observations at consistent intervals, then increase monitoring frequency as the event approaches. After the event, compare the sale price with both the immediate pre-sale price and a longer historical series. This helps identify whether an advertised reduction represents a meaningful change or simply returns a product to a frequently observed selling price.
Effective Black Friday 2026 retail price intelligence services should help pricing teams answer practical questions: Which competitors have lowered prices? Which promotions are conditional? Are products still available? Which changes justify a response? The objective is to turn a large stream of retail observations into decisions that protect competitiveness and margin.
A reliable checklist should include the following fields:
The visible discount is useful, but it does not always represent the customer's final price. Consider a hypothetical product with a reference price of US$200 and a displayed sale price of US$160. The visible reduction is 20%. If the customer can also apply an eligible US$10 coupon and pay US$5 for shipping, the final amount before taxes is US$155. The effective reduction from the reference price is 22.5%, provided the reference price is a valid comparison point and the coupon applies.
| Metric | Illustrative value | Why it matters |
|---|---|---|
| Reference price | US$200 | Establishes the comparison point |
| Displayed sale price | US$160 | Represents a visible 20% reduction |
| Eligible coupon | US$10 | Changes the effective payable amount |
| Shipping charge | US$5 | Affects total customer cost |
| Final amount before taxes | US$155 | Reflects the coupon and shipping in this example |
| Effective reduction | 22.5% | Measures the difference from the stated reference price |
This is an illustrative calculation, not a reported 2026 retailer offer. A defensible analysis should document how the reference price was selected and whether the offer is available to the customer being evaluated.
Retail teams should also distinguish between price competitiveness and profitability. A competitor's price may be lower because it is clearing old inventory, using a vendor-funded promotion, or selling a different product configuration. Before matching, check margin, stock cover, demand, and promotion eligibility. A disciplined response can be more effective than a blanket discount across an entire category.
Black Friday 2026 e-commerce competitor intelligence data helps retailers connect price changes with promotional tactics, assortment decisions, and availability. A price drop may be a short-lived traffic-driving offer, a product-specific clearance, or part of a broader category campaign. Monitoring price alone will not reveal the complete strategy.
Retailers should track leading products, close substitutes, high-volume categories, and items that commonly attract price comparisons. They should also identify products with multiple sellers, since the lowest offer may not be sold or fulfilled by the retailer being benchmarked. For electronics, the exact model and included accessories matter. For home goods, dimensions and pack quantities can alter the comparison. For personal care, multipacks and gift sets can distort unit-price comparisons.
| Signal | Example | Recommended response |
|---|---|---|
| Competitor undercut | Comparable item falls below an approved price threshold | Check margin and decide whether to adjust |
| Deep promotional change | Discount exceeds the category's expected range | Verify the listing, coupon, and product variant |
| Availability change | A leading competitor's item becomes unavailable | Evaluate demand and stock before reacting |
| Bundle change | Competitor adds accessories or extra units | Compare the value of the complete offer |
| Seller change | Product switches to a different marketplace seller | Reassess seller reliability and fulfillment terms |
| Price recovery | Competitor returns to its earlier price range | Reconsider temporary discounts and margin recovery |
The 2026 workflow should be designed around the decisions that teams need to make. A pricing manager may require threshold alerts, while a category manager may need a daily comparison report. Executives may prefer a concise summary of price position, discount depth, and availability for the most important products.
Data should be timestamped and stored in a consistent format. This allows analysts to compare the same product across multiple observations, identify recurring promotions, and distinguish one-off changes from sustained pricing behavior. Automated checks should flag duplicate listings, missing values, unexpected currency changes, and model mismatches before the information reaches decision-makers.
Market-wide spending figures can establish the importance of Black Friday, but they cannot determine the right price for a specific SKU. Retailers should use verified product-level observations alongside their own conversion, inventory, and margin data to make that decision.
A structured Amazon, Walmart, Target and Best Buy promotional price analysis process compares the entire offer rather than only the headline discount. Retailers should examine the product price, coupon requirements, bundle contents, delivery costs, loyalty benefits, and seller or fulfillment conditions. The comparison should reflect what a customer can actually purchase under clearly stated assumptions.
Consider two hypothetical offers for the same product. Retailer A lists it at US$150 with free shipping. Retailer B lists it at US$145 but charges US$8 for shipping. Before taxes and other conditions, Retailer A's delivered price is US$150, while Retailer B's is US$153. Comparing only the listed prices would incorrectly suggest that Retailer B is cheaper.
| Comparison factor | Retailer A | Retailer B |
|---|---|---|
| Displayed price | US$150 | US$145 |
| Shipping | US$0 | US$8 |
| Total before taxes | US$150 | US$153 |
| Lowest delivered price | Yes | No |
| Important caveat | Confirm stock and product equivalence | Check whether shipping varies by location |
Illustrative example only; these are not current retailer prices.
A robust offer comparison should follow five steps:
Retailers should also distinguish between advertised and realized discounts. A banner may promote a percentage off a reference price, but the final customer benefit depends on the reference price, eligibility rules, and any additional charges. Historical records help teams evaluate the context without assuming that every advertised reduction reflects an equivalent saving.
This process is particularly valuable when promotions run simultaneously across multiple retailers. It enables pricing teams to identify the most relevant competitor offer, respond selectively, and avoid matching a headline price that does not reflect the customer's final cost.
Walmart analytics can help brands assess competitive positioning across products listed on Walmart's retail site and, where relevant, its marketplace. The most useful analysis combines comparable product prices with seller identity, availability, shipping conditions, and promotion history.
For a brand that sells across several retailers, the first priority is product matching. A Walmart listing for a multipack should not be compared directly with a single-unit offer elsewhere without converting the prices to a common unit basis. Similarly, an online-only offer may differ from an in-store promotion or a location-specific pickup price. These distinctions should be retained in the dataset rather than flattened into one price field.
| Dashboard indicator | What it measures | How the team can use it |
|---|---|---|
| Price gap | Difference between the brand's price and a comparable Walmart offer | Identify where the brand is less competitive |
| Unit price | Price normalized by quantity or volume | Compare multipacks and different package sizes |
| Promotion frequency | How often a product appears at a promotional price | Identify recurring discount patterns |
| Stock availability | Whether a monitored item is available | Separate price pressure from availability issues |
| Offer conditions | Coupons, shipping, pickup, and other restrictions | Evaluate customer-facing value accurately |
| Price volatility | How much observed prices vary over time | Set monitoring priorities and alert thresholds |
Use the dashboard to prioritize products with a high commercial impact. For example, a price difference on a flagship product with substantial traffic may warrant immediate review, while a small difference on a low-demand item may not. Pricing teams should combine competitor data with internal contribution margins and stock forecasts before taking action.
The same framework can support post-event analysis. Compare actual Black Friday prices with the pre-sale baseline, then examine whether prices returned to normal, remained discounted, or changed because of availability. This provides evidence for future promotional planning instead of relying on recollection or isolated screenshots.
Target analytics can help retailers benchmark product prices, compare advertised offers, and identify shifts in category-level promotions. As with any retailer, the usefulness of the analysis depends on capturing the terms that influence the customer's final purchase.
Teams should monitor the difference between a product's regular and promotional prices, note any relevant loyalty or coupon requirements, and record whether an offer applies online, in store, or under specific fulfillment conditions. They should also preserve product identifiers and timestamps so that changes can be compared across days and years.
For 2026, build the historical view using verified observations wherever available. The following table provides a recommended data structure; it is not a claim that historical Target prices have been collected or verified.
| Year | Evidence to retain | Analysis opportunity |
|---|---|---|
| 2020 | Archived prices, promotional terms, and product availability | Establish a pandemic-era reference where reliable records exist |
| 2021 | Comparable product observations and sale windows | Identify changes from the previous year |
| 2022 | Price history and coupon conditions | Measure promotion depth using consistent definitions |
| 2023 | Comparable product and availability snapshots | Separate sustained price shifts from temporary deals |
| 2024 | Archived observations with timestamps and product identifiers | Compare the baseline with documented campaign pricing |
| 2025 | Verified pre-sale, event, and post-sale records | Calculate year-over-year differences where products match |
| 2026 | Current baseline and live campaign observations | Evaluate actual price changes once the event occurs |
This structure avoids filling gaps with invented historical values. If an archive does not contain a product's price for a given year, label the value as unavailable rather than estimating it and presenting it as a fact.
During the campaign, use alerts to flag large price movements, changing coupon conditions, and products that become unavailable. After the event, assess whether the lowest prices coincided with meaningful promotional periods and whether the discounts were sustainable. Compare price changes with internal sales and inventory results to understand the commercial outcome.
The most useful reporting separates confirmed observations from calculated metrics and assumptions. That distinction improves auditability, supports consistent year-over-year analysis, and helps pricing teams make decisions based on evidence rather than incomplete comparisons.
Actowiz Metrics can support businesses that need structured product and pricing data across competitive retail environments. A monitoring project can be designed around selected product categories, competitor retailers, priority SKUs, data fields, collection intervals, and reporting requirements.
For Black Friday Price Monitoring 2026, Actowiz Metrics can help teams organize competitive observations into a consistent workflow for analysis and decision-making.
Potential capabilities and deliverables include:
Before launching a project, retailers should define which products matter most, how often prices need to be refreshed, which fields are essential, and how the collected data will be used. Access methods and collection practices should comply with applicable law, retailer terms, and technical restrictions.
Actowiz Metrics can help reduce manual comparison work by delivering organized data for further analysis. The final pricing decision should still account for the retailer's own margin targets, stock position, supplier arrangements, and commercial strategy. A lower competitor price is a useful signal, not an automatic instruction to discount.
In practice, Black Friday Price Monitoring 2026 should combine these retailer-specific observations into one decision framework, allowing teams to prioritize high-impact products, validate offers, and measure performance consistently across channels.
A successful Black Friday strategy requires more than reacting to competitors' lowest prices. Retailers need reliable product matching, historical price records, promotion eligibility details, availability monitoring, and a clear understanding of how discounts affect profitability. Comparing identical products and calculating the final eligible customer price helps teams avoid misleading comparisons and unnecessary price cuts.
The historical data also demonstrates the scale of the opportunity. Adobe Analytics reported that U.S. online Black Friday spending increased from US$9 billion in 2020 to US$11.8 billion in 2025, highlighting the importance of preparing for a major online shopping event. These market totals provide context, but retailers still need their own product-level data to identify competitive opportunities.
For 2026, start collecting baseline prices now, define alerts for meaningful competitor changes, and prepare reports that distinguish observed facts from estimates. Review results after the event to understand which price changes supported sales, which promotions compressed margins, and where inventory affected competitiveness.
Ready to strengthen your holiday pricing strategy? Contact Actowiz Metrics to discuss a tailored data collection and competitor monitoring solution for Amazon, Walmart, Target, and Best Buy. Turn retail pricing data into actionable insights and make more informed decisions throughout the Black Friday season!
Expert blogs, research reports and infographics — practical, data-driven reading across e-commerce and quick-commerce.
Most fields are optional — the more you share, the better your sample.

.webp "infographics")
.webp "infographics")