BLOG


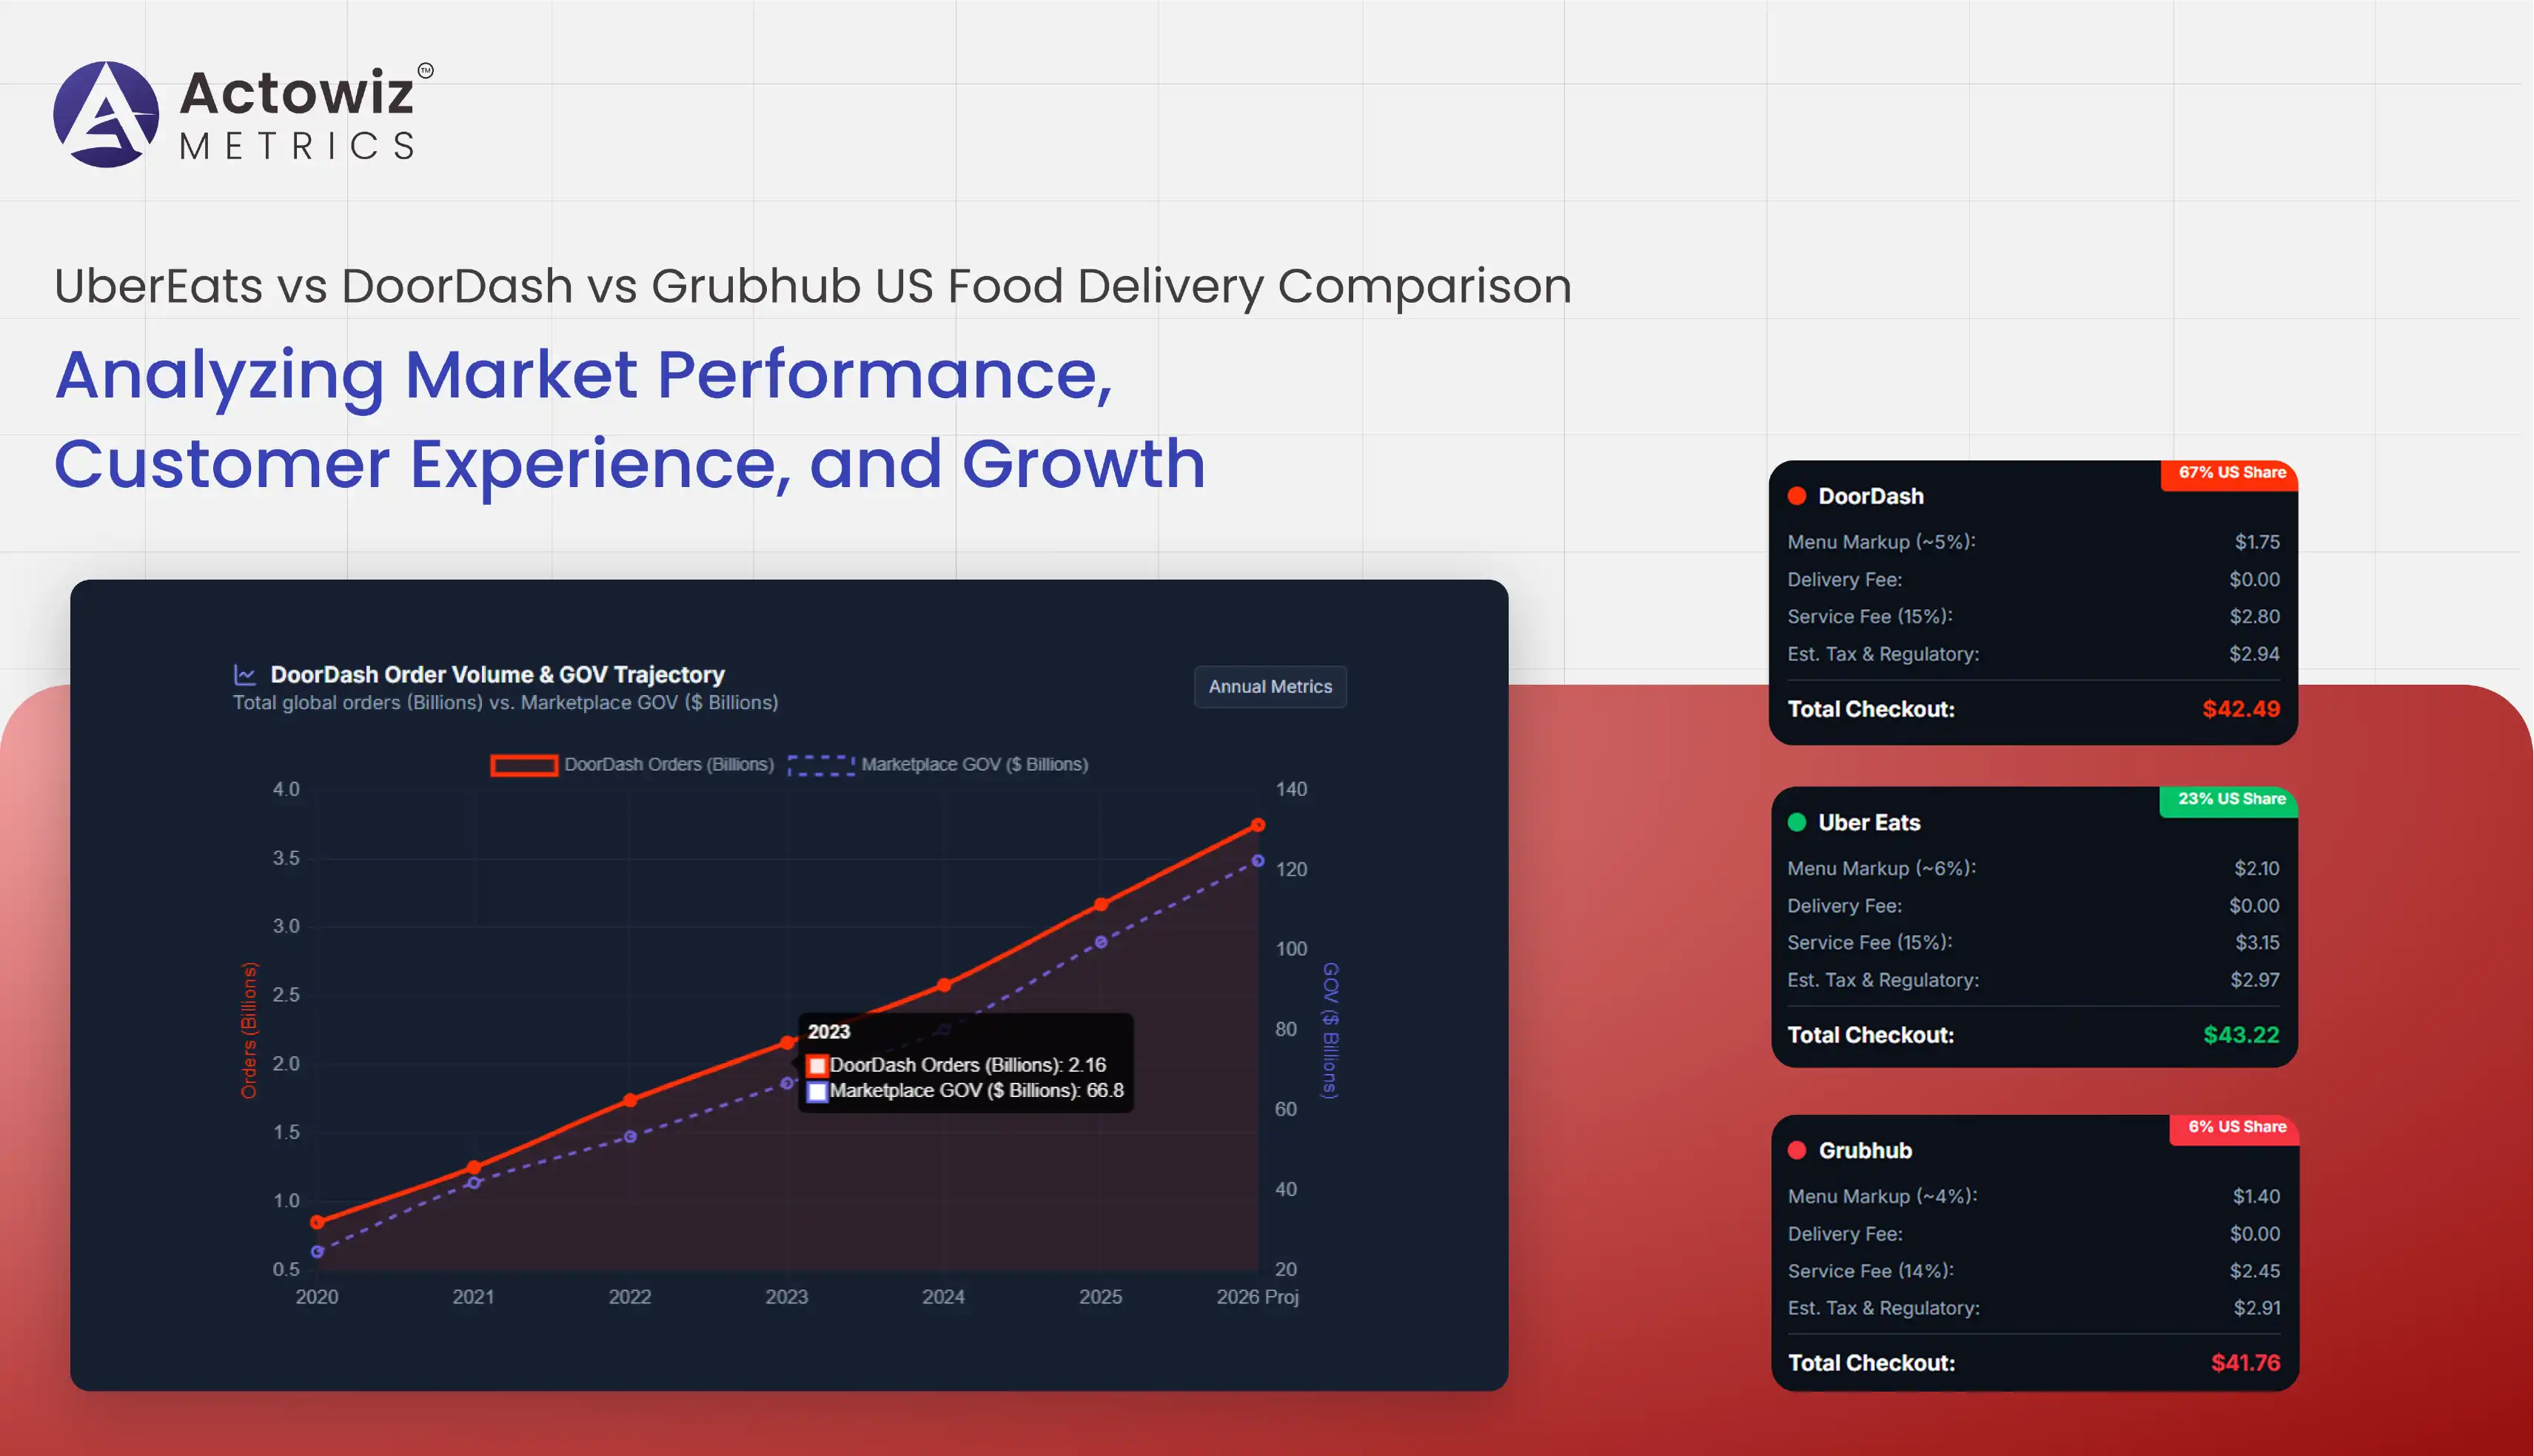
The U.S. food delivery industry has evolved from a convenience service into a data-rich competitive marketplace where restaurant selection, delivery speed, pricing, fees, promotions, customer ratings, and menu availability influence consumer decisions. This UberEats vs DoorDash vs Grubhub US Food Delivery Comparison examines how the three major platforms have developed from 2020 through 2026 and how businesses can use Food & beverage analytics to understand market movements, consumer behavior, and competitive opportunities. DoorDash reported 3.17 billion total orders and $102.0 billion in Marketplace GOV in 2025, while Uber reported $193.5 billion in company-wide Gross Bookings, with Delivery Gross Bookings continuing to expand.
The comparison is particularly relevant as food delivery platforms increasingly compete beyond restaurant meals, expanding into grocery, convenience, retail, subscriptions, advertising, and corporate food services. By tracking structured marketplace data, brands and restaurant operators can identify pricing gaps, availability differences, popular cuisines, promotional patterns, delivery conditions, and changes in consumer demand. The 2020–2026 period also demonstrates how pandemic-driven adoption transitioned into a more mature market focused on retention, profitability, personalization, and broader local-commerce ecosystems.
The U.S. food delivery market became significantly more competitive between 2020 and 2026 as consumers adopted app-based ordering at unprecedented levels during the pandemic and retained many of those habits afterward. Businesses increasingly rely on US food delivery platform market intelligence to compare platform reach, restaurant supply, order activity, consumer engagement, and geographic expansion.
DoorDash has maintained a leading position in the U.S. market. Industry estimates indicate that in 2025 DoorDash accounted for approximately 67% of major-platform sales, followed by Uber Eats at roughly 23% and Grubhub at around 6%. Together, the three represented approximately 96% of major-platform sales.
| Year | Market Development | Key Industry Signal |
|---|---|---|
| 2020 | Pandemic accelerated delivery adoption | Restaurant delivery became a critical sales channel |
| 2021 | High consumer adoption continued | Platforms expanded restaurant and courier networks |
| 2022 | Market normalized | Competition shifted toward retention and profitability |
| 2023 | Platform ecosystems broadened | Grocery and convenience gained importance |
| 2024 | Engagement increased | DoorDash reported 2.58B total orders globally |
| 2025 | Scale continued | DoorDash reported 3.17B total orders |
| 2026 | Ecosystem competition intensified | Delivery expanded toward retail, catering, and AI-enabled ordering |
DoorDash's 2024 total orders increased 20% to 2.58 billion, while Marketplace GOV reached $80.2 billion. In 2025, total orders rose another 23% to 3.17 billion and Marketplace GOV reached $102.0 billion.
From 2020 to 2026, the competitive structure therefore shifted from simple restaurant delivery toward a broader local-commerce model. For businesses, this creates opportunities to monitor platform-specific availability, order economics, restaurant coverage, and customer behavior. A structured comparison can reveal where each platform is strongest and where competitive gaps remain.
Consumers rarely evaluate food delivery based only on menu prices. The final purchase decision can depend on delivery fees, service fees, small-order charges, memberships, promotions, estimated delivery times, restaurant ratings, and order reliability. This makes UberEats vs DoorDash vs Grubhub Pricing and Performance Comparison valuable for brands seeking to understand the actual customer-facing economics of delivery.
| Period | DoorDash Indicator | Uber Delivery Indicator | Competitive Interpretation |
|---|---|---|---|
| 2020 | Rapid order expansion | Rapid delivery adoption | Pandemic-driven demand |
| 2021 | High marketplace engagement | Delivery remained a major growth area | Consumer habits strengthened |
| 2022 | 1.74B total orders | Delivery remained a core segment | Market normalization |
| 2023 | 2.16B total orders | Delivery Gross Bookings increased | Continued platform expansion |
| 2024 | 2.58B total orders | Delivery Gross Bookings rose 17% YoY | Strong platform activity |
| 2025 | 3.17B total orders | Uber MAPCs reached 202M | Greater ecosystem scale |
DoorDash's 2024 revenue reached $10.72 billion, up 24% year over year, while its net revenue margin increased to 13.4%. In 2025, revenue increased to $13.72 billion and adjusted EBITDA reached $2.78 billion. Uber's overall platform also expanded substantially. Its monthly active platform consumers increased from 171 million in 2024 to 202 million in 2025, while total Gross Bookings increased from $162.8 billion to $193.5 billion.
Between 2020 and 2026, pricing intelligence became more sophisticated. Instead of comparing a single delivery charge, businesses increasingly need to examine complete checkout economics. This includes menu price differences, promotions, delivery fees, membership benefits, minimum-order requirements, and time-based changes. Such analysis can help restaurants determine whether platform pricing remains competitive and whether consumers receive consistent value across marketplaces.
Restaurant selection is one of the strongest competitive advantages in food delivery. A consumer may choose one application over another because a preferred restaurant is available, because delivery is faster, or because a particular location offers better ordering conditions. UberEats DoorDash Grubhub restaurant availability tracking allows businesses to systematically monitor these differences across cities, neighborhoods, cuisines, and restaurant categories.
| Year | Availability Trend | Business Implication |
|---|---|---|
| 2020 | Restaurants rapidly joined delivery platforms | Digital presence became essential |
| 2021 | Platform restaurant coverage expanded | Consumers gained more choice |
| 2022 | Coverage became more competitive | Restaurant acquisition intensified |
| 2023 | Grocery and convenience expanded | Platforms moved beyond restaurants |
| 2024 | DoorDash added thousands of grocery stores in the U.S. | Broader local-commerce coverage |
| 2025 | Platform ecosystems continued expanding | Availability became increasingly multidimensional |
| 2026 | Retail and catering gained importance | Restaurant delivery became part of wider commerce ecosystems |
DoorDash stated that it added thousands of new grocery stores to its U.S. marketplace during 2024 while expanding selection across other new verticals. More than 25% of its monthly active users ordered from at least one new-vertical category in December 2024.
For restaurants and food brands, availability monitoring can reveal whether products or locations disappear from a platform, whether competitors have broader coverage, and whether certain cities have stronger marketplace penetration. Businesses can also identify differences between delivery zones and restaurant branches.
From 2020 to 2026, availability evolved from a basic restaurant-listing issue into a strategic visibility metric. Monitoring restaurant presence can help brands understand geographic white spaces, identify underserved markets, and evaluate the effectiveness of marketplace partnerships.
Food delivery menus contain extensive information that can be transformed into structured business intelligence. US food delivery menu data scraping enables businesses to collect product names, descriptions, prices, categories, modifiers, ratings, promotional offers, availability, restaurant information, and other publicly visible attributes at scale.
| Year | Menu Data Development | Analytical Opportunity |
|---|---|---|
| 2020 | Digital menus expanded rapidly | Establish baseline menu coverage |
| 2021 | More restaurants digitized menus | Compare product assortments |
| 2022 | Menu structures became more standardized | Improve cross-platform matching |
| 2023 | Promotions became increasingly important | Track discount strategies |
| 2024 | New verticals expanded data scope | Compare food with grocery/convenience |
| 2025 | Platform scale increased | Build larger competitive datasets |
| 2026 | Personalization and AI gained importance | Enable deeper menu intelligence |
Menu data becomes especially valuable when the same restaurant operates across multiple platforms. A restaurant may list different prices, promotions, item availability, descriptions, or bundles depending on the marketplace. Comparing these records allows businesses to identify inconsistencies and measure how menus change over time.
DoorDash's increasing scale demonstrates why structured data collection is important. The company processed 2.58 billion orders in 2024 and 3.17 billion in 2025, creating a large and continually changing marketplace environment.
Between 2020 and 2026, menu intelligence shifted from simple menu aggregation toward continuous competitive monitoring. Businesses can use historical snapshots to determine when products were introduced, removed, repriced, discounted, or made unavailable. For restaurant groups, this creates a centralized way to compare branches and platforms without relying on manual checks.
Consumers increasingly judge food delivery based on the final checkout amount rather than the advertised menu price. UberEats DoorDash Grubhub menu pricing and delivery fee analysis helps businesses understand how platform fees and menu-level pricing influence the final customer experience.
| Year | Pricing Environment | Major Change |
|---|---|---|
| 2020 | Delivery demand surged | Fees became a visible consumer concern |
| 2021 | Promotions remained important | Platforms competed for customer loyalty |
| 2022 | Inflation increased pressure | Menu and delivery costs became more sensitive |
| 2023 | Subscription programs expanded | Membership value influenced ordering |
| 2024 | Advertising became more important | Platform monetization diversified |
| 2025 | Larger marketplace scale | Pricing intelligence became more data-driven |
| 2026 | Broader local commerce | Consumers compare increasingly complex baskets |
DoorDash's 2024 net revenue margin increased to 13.4%, with the company noting that advertising revenue contributed to the improvement. Its 2025 net revenue margin remained 13.4%. Pricing analysis should therefore examine more than the restaurant's listed item price. A useful dataset can include base menu price, promotional price, delivery fee, service fee, minimum order requirement, estimated delivery time, membership-related benefits, and total checkout cost where publicly observable.
From 2020 through 2026, inflation and changing consumer expectations made price transparency increasingly important. Restaurants can use historical data to determine whether platform prices remain aligned with their direct channels. Brands can also compare competitors to identify premium or discount positioning within the same cuisine and geographic area.
This analysis is valuable for revenue managers, restaurant operators, marketplace teams, and consumer brands. It can reveal hidden pricing patterns and support more informed decisions about promotions, menu engineering, marketplace participation, and customer acquisition.
Understanding which restaurant brands generate strong visibility and consumer interest can help businesses assess market positioning. Uber Eats Bestselling Brands Analytics can support analysis of brand presence, menu assortment, category performance, ratings, reviews, pricing, promotions, and marketplace visibility.
| Year | Consumer Behavior Trend | Analytics Focus |
|---|---|---|
| 2020 | Heavy reliance on delivery | Brand availability |
| 2021 | High digital ordering frequency | Order and menu visibility |
| 2022 | Value became increasingly important | Price and promotion |
| 2023 | Convenience expanded | Category and location analysis |
| 2024 | New verticals gained adoption | Cross-category demand |
| 2025 | Platform ecosystems scaled | Brand benchmarking |
| 2026 | Personalization intensified | Bestselling and consumer-intent signals |
DoorDash reported that more than 42 million monthly active users ordered through its marketplaces in December 2024, compared with more than 37 million in December 2023. It also reported more than 22 million DashPass and Wolt+ members exiting 2024.
These metrics illustrate the increasing importance of loyalty and repeat engagement. Bestselling-brand analysis can identify which restaurant chains, cuisines, meal categories, and menu items consistently attract attention. When combined with pricing and availability data, businesses can build a stronger picture of why certain brands outperform others.
For example, a high-performing brand may benefit from broader restaurant coverage, stronger ratings, aggressive promotions, greater menu variety, or better perceived value. Historical datasets can help separate temporary promotional spikes from sustained demand.
From 2020 to 2026, food delivery analytics therefore became increasingly centered on consumer behavior rather than simple order counts. Brands can examine demand signals alongside competitive pricing, menu changes, availability, and ratings to develop more precise market strategies.
Actowiz Metrics helps businesses convert large volumes of marketplace and food-service information into structured, analysis-ready datasets. Instead of relying on manual monitoring, businesses can establish recurring data collection workflows designed around their specific competitive intelligence requirements.
The approach can cover restaurant information, menu data, prices, promotions, availability, ratings, reviews, delivery conditions, categories, locations, and other publicly available attributes. Data can then be cleaned, normalized, validated, and organized for dashboards, business intelligence systems, market research, or historical analysis.
Another important advantage is scalability. Food delivery marketplaces can change frequently, with new restaurants appearing, menu items being modified, prices changing, and promotions being introduced or removed. Recurring collection helps businesses maintain a current competitive dataset rather than depending on outdated snapshots.
Actowiz Metrics can also support cross-platform benchmarking, enabling businesses to compare marketplace performance across locations and time periods. This helps restaurant groups, food brands, market researchers, and retail analysts understand competitive movements and identify actionable opportunities.
For organizations seeking deeper brand-level visibility, Doordash Bestselling Food Brands Analytics can be incorporated into a broader monitoring strategy covering bestselling brands, product categories, prices, availability, ratings, and promotional activity. The resulting datasets can support strategic planning, competitor benchmarking, assortment optimization, and market intelligence.
The U.S. food delivery industry has moved significantly beyond its pandemic-era expansion. Between 2020 and 2026, DoorDash, Uber Eats, and Grubhub increasingly competed through restaurant coverage, pricing, memberships, advertising, delivery capabilities, grocery expansion, convenience, and broader local-commerce services. DoorDash's 3.17 billion total orders in 2025 demonstrate the scale reached by the leading marketplace, while Uber's 2025 platform growth shows the strength of an ecosystem that combines mobility and delivery.
For businesses, the next stage of competition will depend heavily on continuous data. Monitoring menus, prices, restaurant availability, fees, promotions, ratings, and bestselling brands can provide a more complete understanding of marketplace performance.
Actowiz Metrics can help businesses turn these continuously changing marketplace signals into structured datasets for competitive research, pricing intelligence, assortment analysis, and strategic decision-making.
Businesses can also use Grubhub Bestselling Food Brands Analytics to benchmark leading brands and identify changes in consumer demand across locations, categories, and time periods.
Connect with Actowiz Metrics to build scalable food delivery marketplace datasets and turn competitive platform data into actionable business intelligence!
Expert blogs, research reports and infographics — practical, data-driven reading across e-commerce and quick-commerce.
Most fields are optional — the more you share, the better your sample.
.webp "infographics")
.webp "infographics")