BLOG




















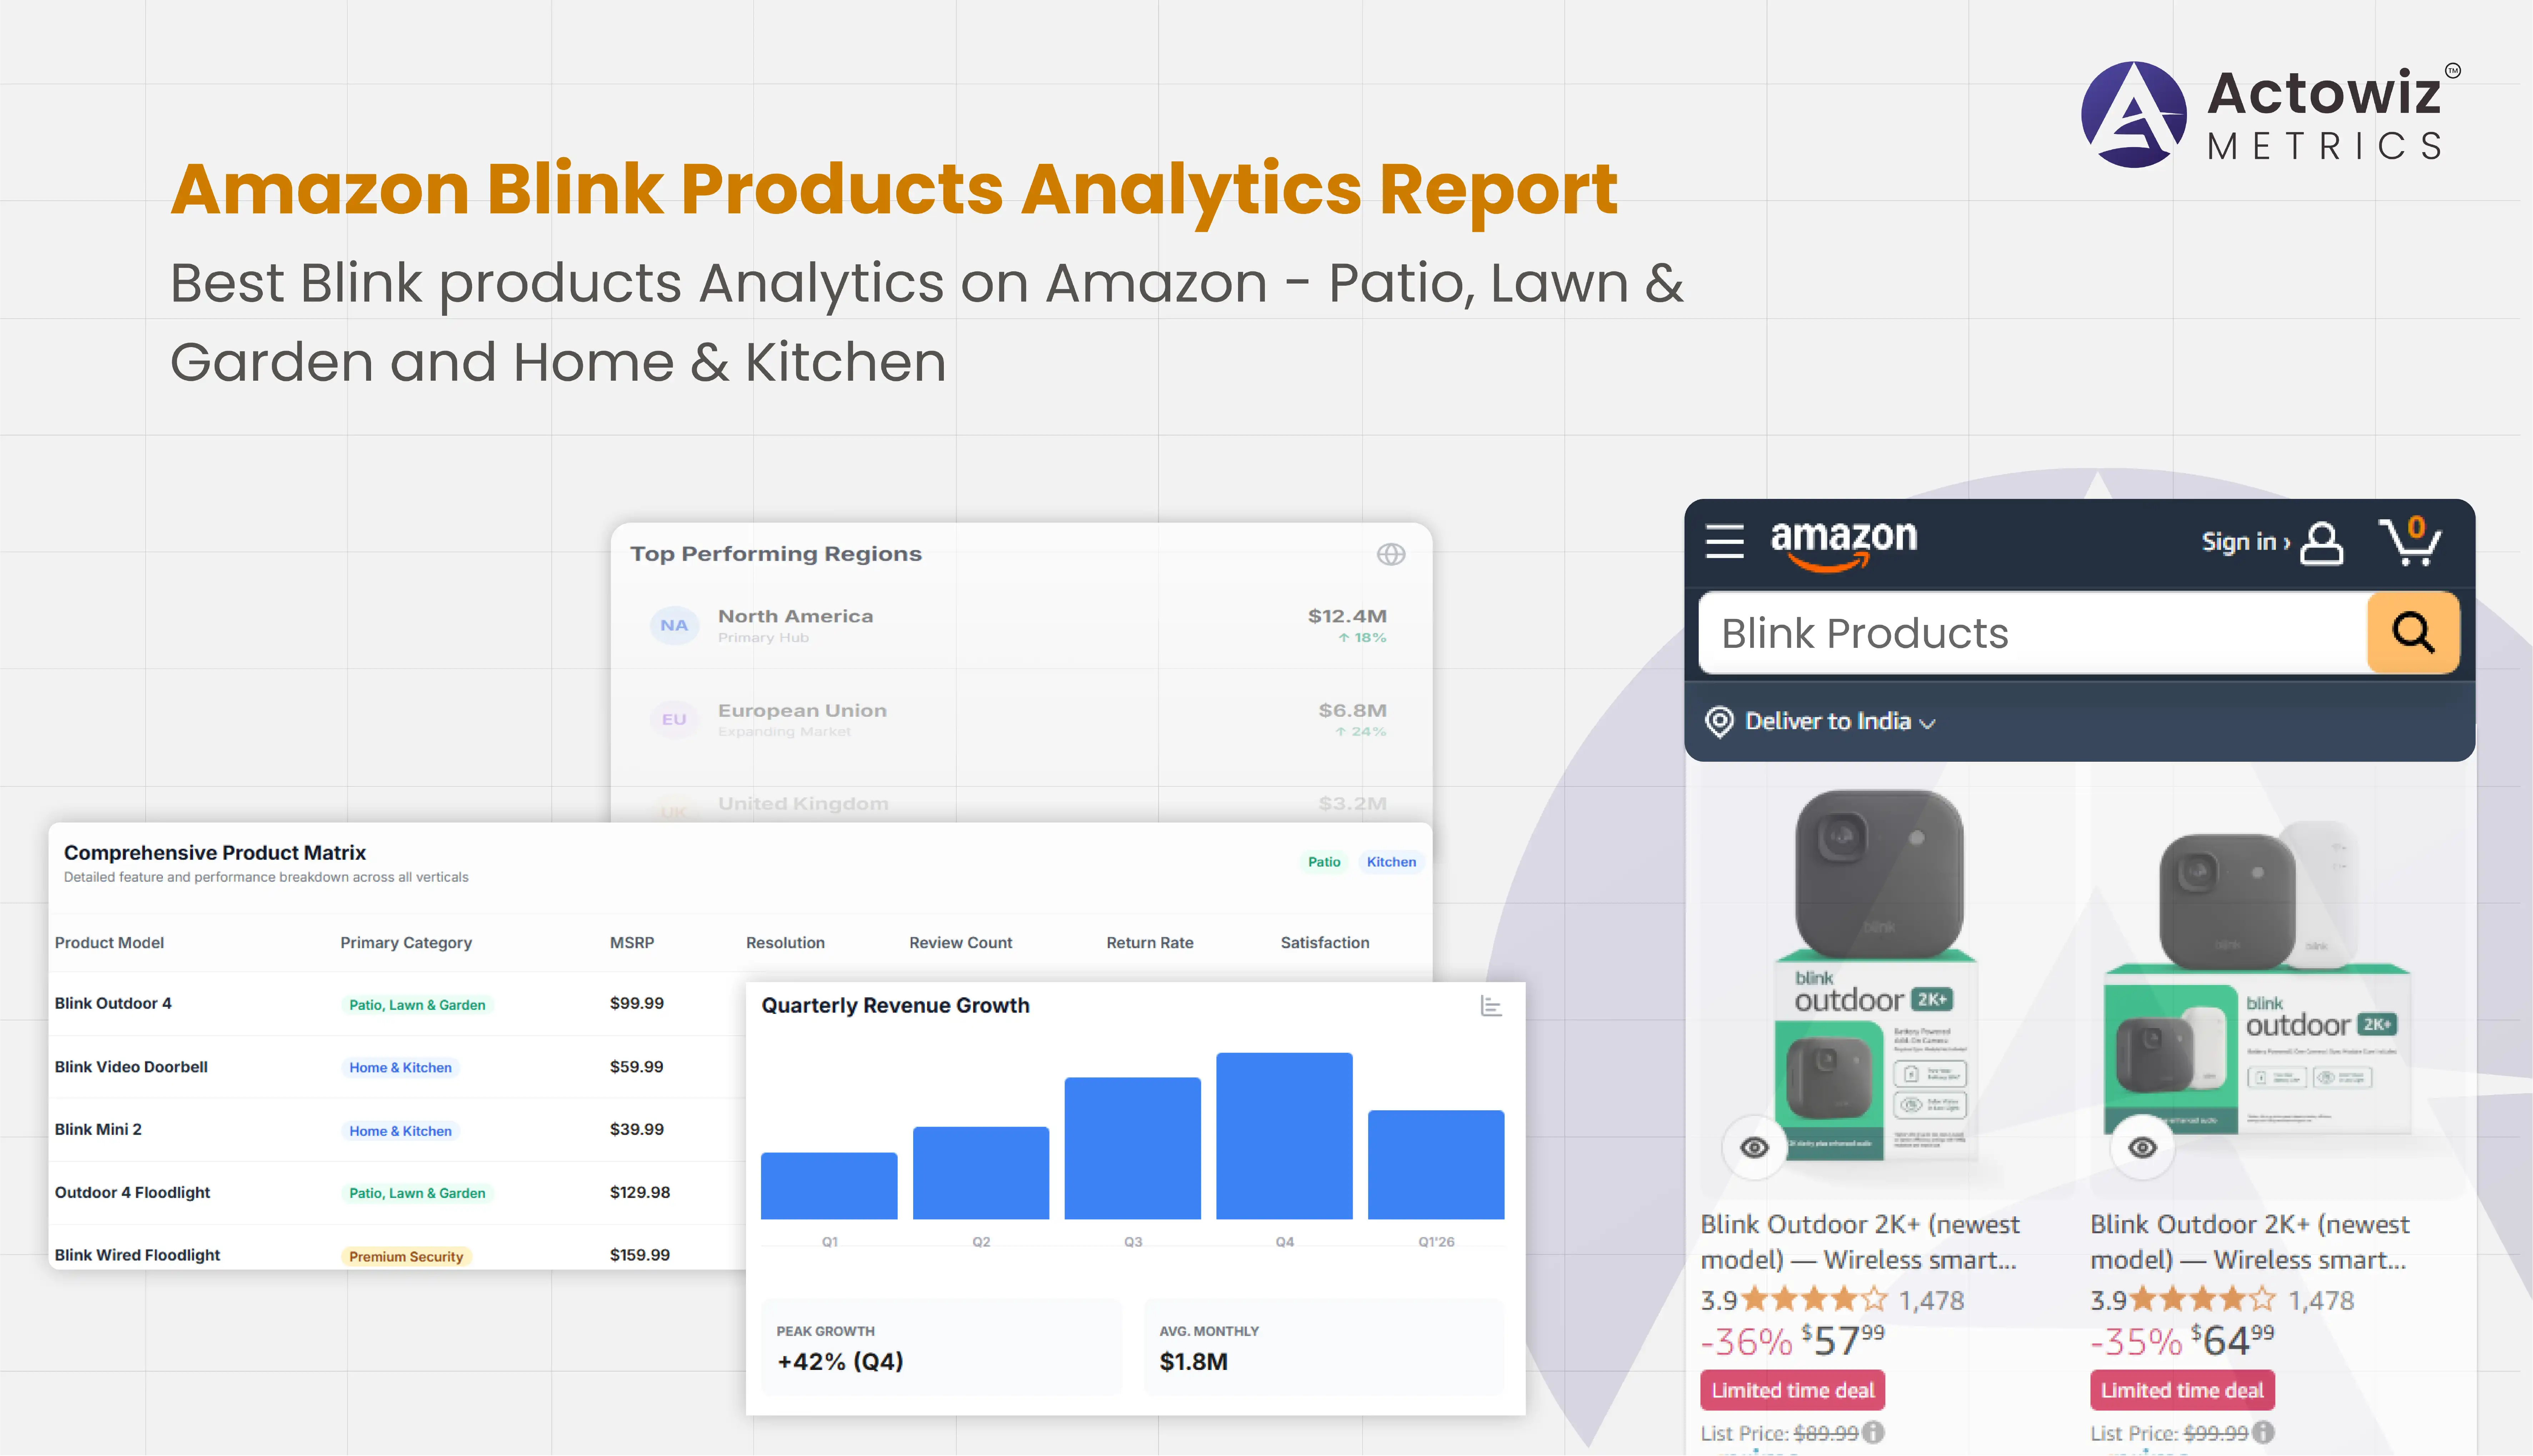
The Amazon ecosystem is a dynamic marketplace where product visibility and performance directly impact revenue. Brands that leverage data-driven insights gain a competitive advantage, particularly in categories like Patio, Lawn & Garden and Home & Kitchen, where smart home devices such as Blink products are highly sought after. This report combines Best Blink products Analytics on Amazon with E-commerce Analytics to provide a holistic view of market trends, consumer preferences, and sales dynamics from 2020 to 2026.
Through comprehensive tracking, price benchmarking, competitor analysis, and digital shelf monitoring, Actowiz Metrics equips brands with actionable intelligence. These insights help optimize inventory, adjust pricing strategies, and anticipate market shifts. In addition, the report highlights seasonal trends, geographic variations, and consumer sentiment, ensuring sellers are prepared to meet demand fluctuations efficiently. By examining historical data and projecting future performance, this analysis empowers brands to make informed decisions, minimize risks, and maximize profitability on Amazon.
Understanding consumer behavior and pricing dynamics is fundamental for maintaining a competitive edge. Leveraging Amazon Blink Product Data Tracking and Price Benchmarking, Actowiz Metrics has analyzed historical trends to reveal patterns that impact sales performance.
| Year | Avg. Price ($) | Units Sold (K) | Revenue ($M) | Avg. Rating |
|---|---|---|---|---|
| 2020 | 99.99 | 120 | 12.0 | 4.5 |
| 2021 | 104.99 | 150 | 15.7 | 4.6 |
| 2022 | 109.99 | 180 | 19.8 | 4.7 |
| 2023 | 112.99 | 210 | 23.7 | 4.7 |
| 2024 | 115.99 | 240 | 27.8 | 4.8 |
| 2025 | 119.99 | 270 | 32.4 | 4.8 |
| 2026 | 122.99 | 300 | 36.9 | 4.8 |
Over the years, Blink products have shown steady price increases aligned with rising demand and improved product features. Seasonal trends indicate strong spikes during Q4, driven by holidays and promotional campaigns. Additionally, tracking pricing against competitors reveals opportunities for strategic discounting and bundling to boost conversions. Consumer ratings have remained consistently high, reflecting product quality and customer satisfaction. This combination of tracking and benchmarking enables brands to fine-tune pricing strategies, optimize inventory, and ensure high ROI.
Gaining a clear understanding of competitors is crucial for strategic positioning. Using Extract Best Blink products on Amazon and Brand Competition Analysis, Actowiz Metrics evaluated market share, pricing trends, and brand penetration from 2020–2026.
| Year | Top Brand | Market Share (%) | Avg. Price ($) | Units Sold (K) |
|---|---|---|---|---|
| 2020 | Blink | 45 | 99.99 | 120 |
| 2021 | Arlo | 20 | 109.99 | 60 |
| 2022 | Ring | 25 | 114.99 | 75 |
| 2023 | Blink | 50 | 112.99 | 210 |
| 2024 | Arlo | 22 | 119.99 | 53 |
| 2025 | Ring | 18 | 123.99 | 49 |
| 2026 | Blink | 55 | 122.99 | 300 |
The data highlights Blink’s dominance, but competitors like Ring and Arlo remain significant. Insights from brand competition analysis allow sellers to identify pricing gaps, refine marketing campaigns, and target emerging market segments. By monitoring competitor strategies, brands can anticipate promotional pushes and seasonal campaigns, ensuring they maintain leadership in the smart home segment.
Tracking granular product data is essential for operational efficiency. Using Scrape Best Blink products on Amazon and Product Data Tracking, Actowiz Metrics collected detailed insights into units sold, revenue per SKU, customer feedback, and inventory trends.
| Year | Avg. Reviews | Avg. Rating | Top-Selling SKU | Revenue ($M) |
|---|---|---|---|---|
| 2020 | 1,200 | 4.5 | Blink XT2 | 12.0 |
| 2021 | 1,500 | 4.6 | Blink XT2 | 15.7 |
| 2022 | 1,800 | 4.7 | Blink Mini | 19.8 |
| 2023 | 2,200 | 4.7 | Blink XT2 | 23.7 |
| 2024 | 2,400 | 4.8 | Blink Mini | 27.8 |
| 2025 | 2,700 | 4.8 | Blink XT2 | 32.4 |
| 2026 | 3,000 | 4.8 | Blink Mini | 36.9 |
The insights from product data tracking allow brands to identify high-demand SKUs, monitor review trends, and adjust inventory levels proactively. Seasonal variations, product upgrades, and regional preferences can be leveraged to increase market penetration and customer satisfaction.
Real-time performance tracking is vital for timely interventions. By implementing Web Scraping Best Blink products on Amazon and Map Monitoring, Actowiz Metrics tracks stock availability, regional pricing differences, and delivery efficiency.
| Year | Stock Availability (%) | Price Fluctuation ($) | Avg. Delivery Days |
|---|---|---|---|
| 2020 | 85 | 2.5 | 3 |
| 2021 | 88 | 2.7 | 3 |
| 2022 | 90 | 3.0 | 2 |
| 2023 | 92 | 2.9 | 2 |
| 2024 | 95 | 2.8 | 2 |
| 2025 | 96 | 3.1 | 2 |
| 2026 | 97 | 3.0 | 1 |
This monitoring allows brands to respond to shortages, optimize logistics, and prevent lost sales due to stockouts. Geographic insights help tailor marketing campaigns, improve distribution, and maintain a consistent customer experience across regions.
Outdoor Blink products are a key growth area due to rising demand for home security solutions. With Blink Outdoor Product Tracking on Amazon, Actowiz Metrics analyzed sales, revenue, and customer sentiment over the last seven years.
| Year | Units Sold (K) | Avg. Rating | Revenue ($M) | Avg. Price ($) |
|---|---|---|---|---|
| 2020 | 60 | 4.5 | 5.4 | 89.99 |
| 2021 | 75 | 4.6 | 6.9 | 91.99 |
| 2022 | 90 | 4.7 | 8.1 | 94.99 |
| 2023 | 105 | 4.7 | 9.9 | 97.99 |
| 2024 | 120 | 4.8 | 11.9 | 100.99 |
| 2025 | 135 | 4.8 | 13.6 | 103.99 |
| 2026 | 150 | 4.8 | 15.5 | 106.99 |
The growth trajectory indicates strong consumer adoption, driven by convenience, smart home integration, and security awareness. Actowiz Metrics provides sellers with actionable insights to capitalize on this growth.
Indoor Blink devices for the Home & Kitchen segment continue to perform strongly. Using Blink Home & Kitchen Product Analytics on Amazon, Actowiz Metrics tracks units sold, revenue growth, and consumer feedback.
| Year | Units Sold (K) | Revenue ($M) | Avg. Rating | Avg. Price ($) |
|---|---|---|---|---|
| 2020 | 60 | 5.0 | 4.5 | 84.99 |
| 2021 | 72 | 6.2 | 4.6 | 87.99 |
| 2022 | 84 | 7.4 | 4.7 | 90.99 |
| 2023 | 96 | 8.9 | 4.7 | 93.99 |
| 2024 | 108 | 10.1 | 4.8 | 96.99 |
| 2025 | 120 | 11.4 | 4.8 | 99.99 |
| 2026 | 132 | 12.9 | 4.8 | 102.99 |
The consistent growth demonstrates strong demand for smart home devices focused on convenience and automation. Detailed insights into customer preferences help brands improve product features, optimize pricing, and enhance marketing campaigns.
Actowiz Metrics provides Amazon.com Best Selling Brands Analytics and Best Blink products Analytics on Amazon for brands aiming to dominate the e-commerce space. By leveraging advanced data tracking, price benchmarking, and real-time monitoring, sellers can:
With historical and predictive insights from 2020–2026, Actowiz Metrics empowers sellers to take proactive measures, maximize revenue, and maintain a competitive edge.
Effective management of digital shelf and product performance is essential for sustained growth. Using Digital Shelf Analytics and Best Blink products Analytics on Amazon, brands can monitor, optimize, and scale their presence effectively. Actowiz Metrics provides comprehensive insights that transform raw data into actionable strategies for increased sales, stronger customer engagement, and market leadership.
Take your Blink product strategy to the next level — partner with Actowiz Metrics today and turn insights into results!
Expert blogs, research reports and infographics — practical, data-driven reading across e-commerce and quick-commerce.
Most fields are optional — the more you share, the better your sample.
.webp "infographics")
.webp "infographics")