BLOG




















India's online food delivery ecosystem has evolved from a convenience-led service into a highly competitive digital marketplace where menu prices, discounts, delivery fees, restaurant availability, ratings, cuisine trends, and customer demand can change rapidly. For food brands, restaurant chains, aggregators, investors, and market researchers, monitoring these variables consistently is essential for understanding competitive positioning and consumer behavior. Swiggy Zomato EatSure price monitoring India enables businesses to systematically observe pricing movements across leading food delivery platforms and convert marketplace data into actionable intelligence.
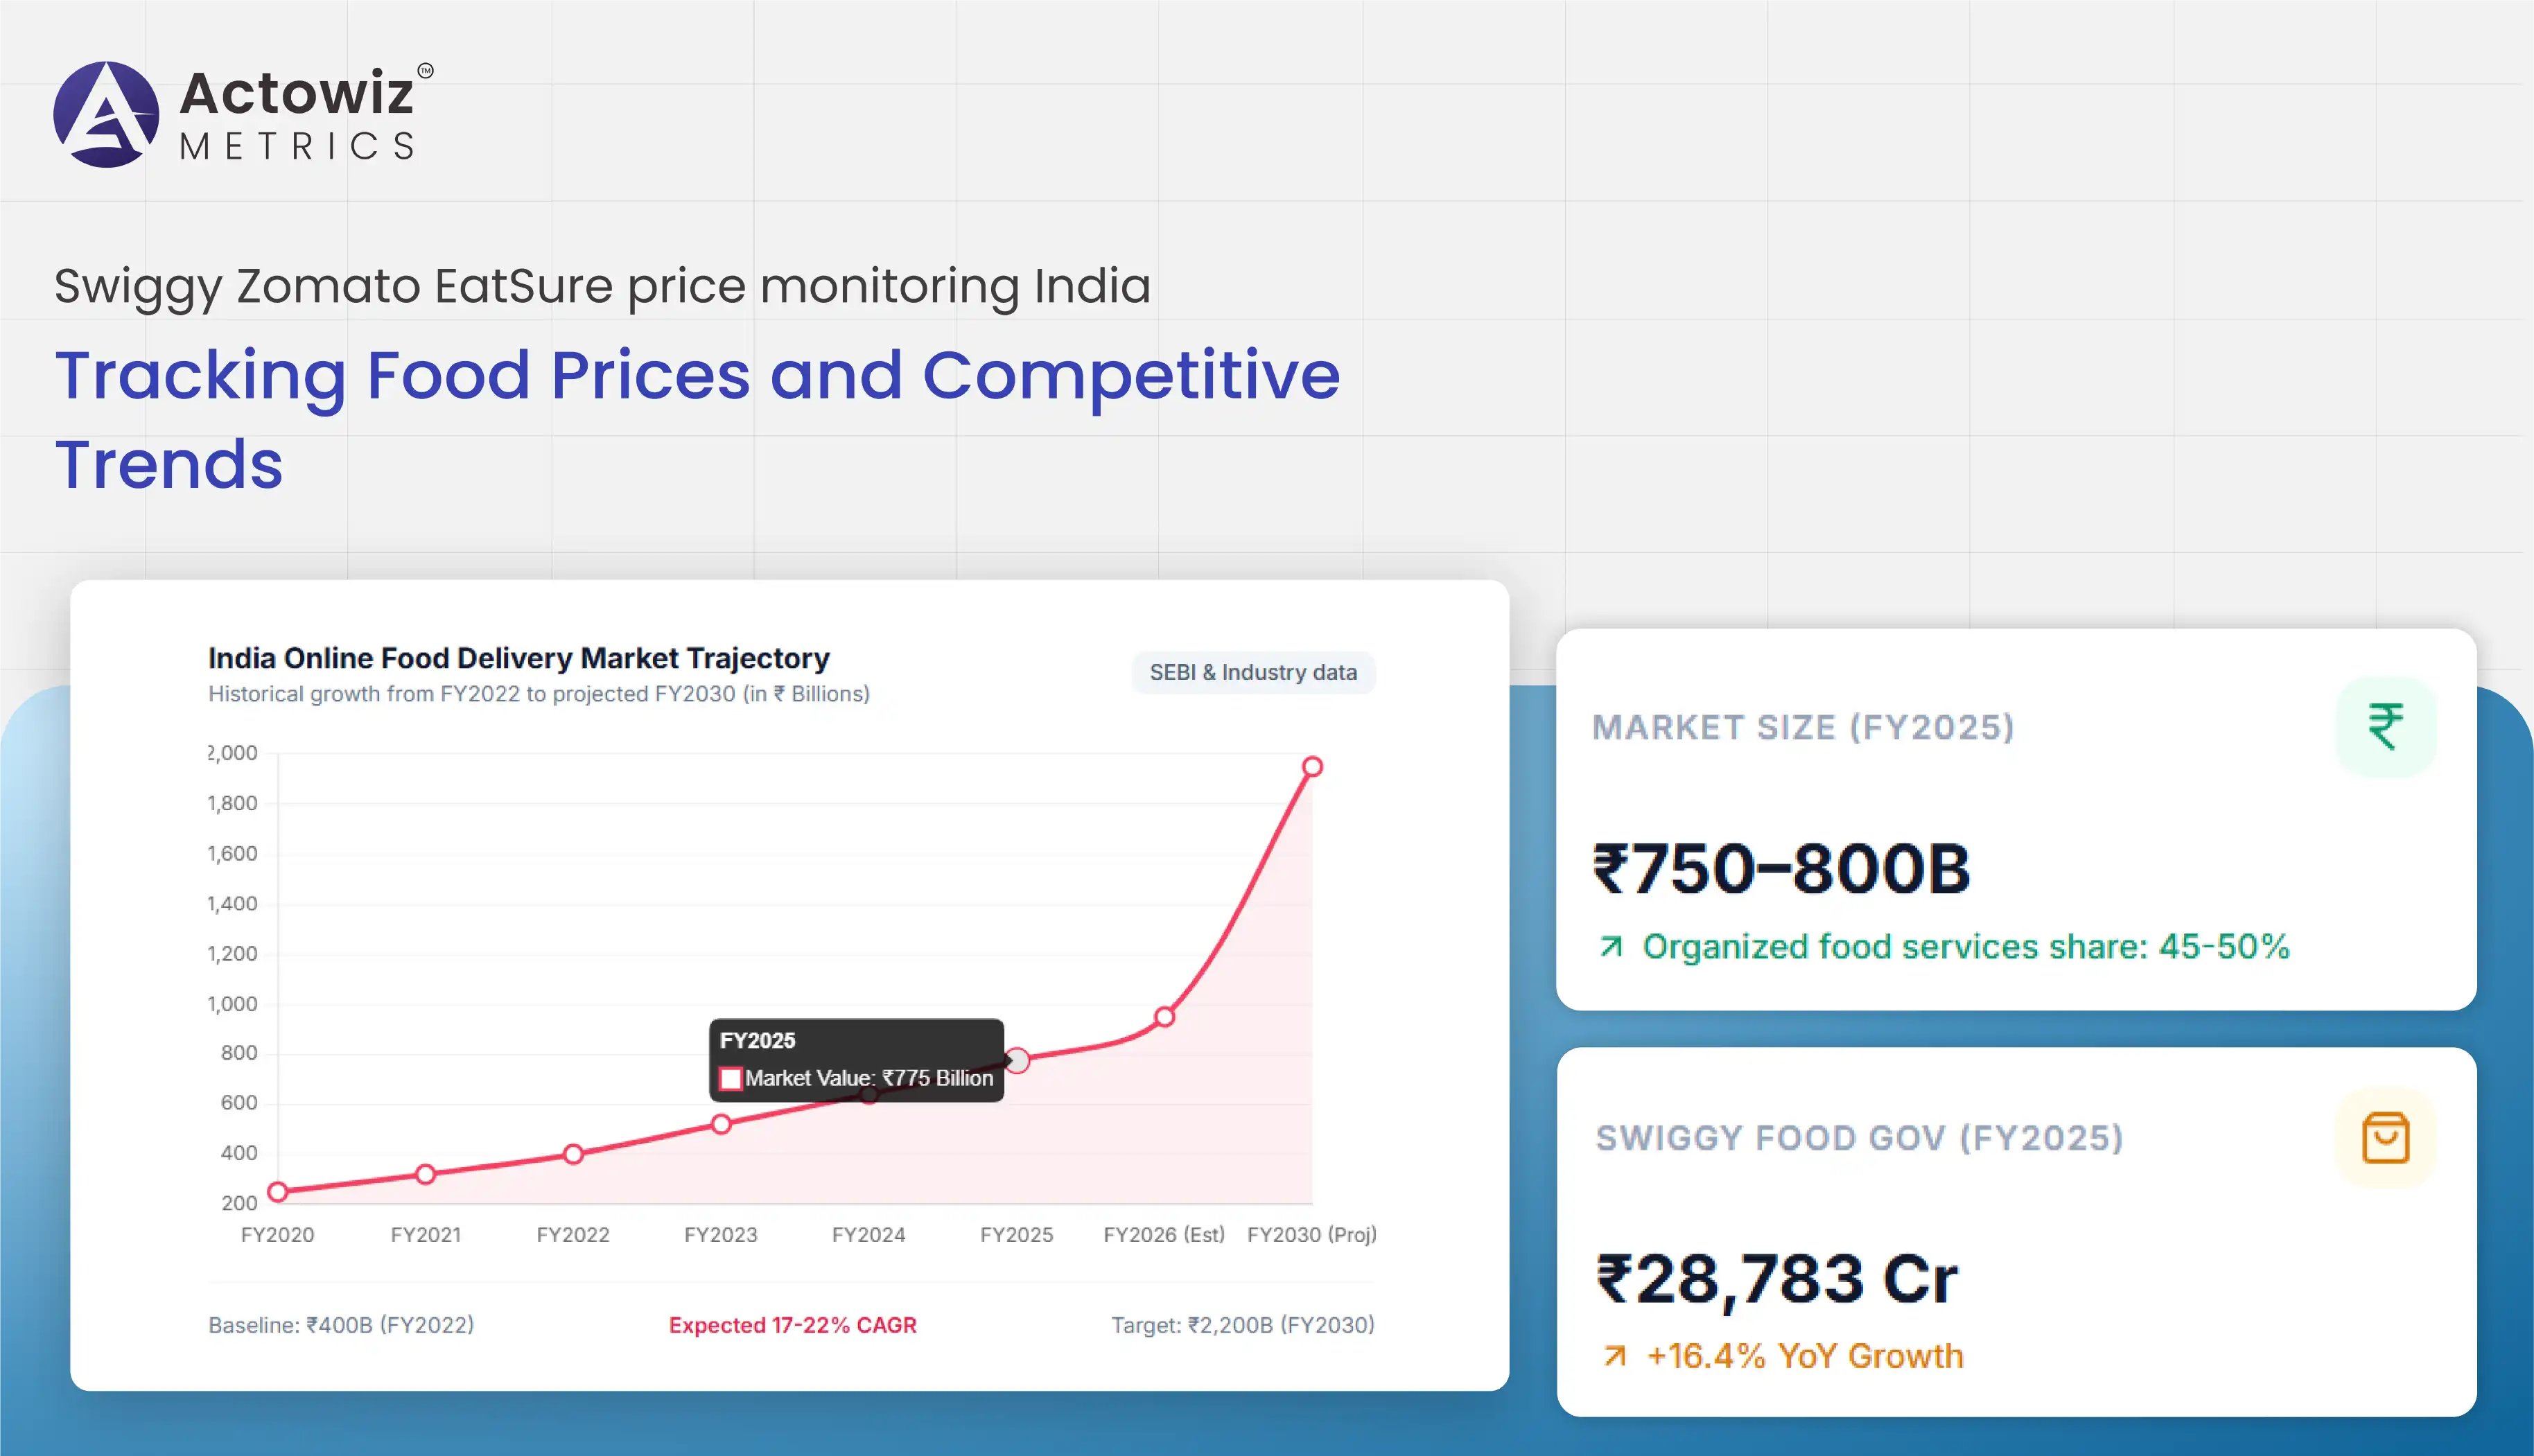
At the same time, Food & beverage analytics helps businesses connect menu-level observations with broader trends such as average order values, bestselling categories, promotional intensity, geographic demand, restaurant visibility, and price competitiveness. India's online food delivery market was estimated at ₹750–800 billion in FY2025, with industry projections indicating continued double-digit growth toward FY2030. (Securities and Exchange Board of India)
Actowiz Metrics helps businesses collect, normalize, validate, and analyze food delivery marketplace information at scale. By tracking restaurants, dishes, prices, discounts, delivery charges, ratings, reviews, and availability across multiple locations, businesses can develop a structured view of the competitive food delivery environment.
Food Delivery Market Intelligence India provides the foundation for understanding how online food ordering is developing across cities, categories, restaurants, and consumer segments. Instead of relying only on periodic market reports, businesses can use recurring marketplace data to observe actual menu availability, pricing changes, promotional activity, restaurant density, and customer engagement.
| Indicator | Market Insight |
|---|---|
| India online food delivery market, FY2025 | £750–800 billion |
| FY2022 market size | Approx. £400 billion |
| Projected FY2030 market | £1,700–2,200 billion |
| FY2025–FY2030 expected CAGR | 17–22% |
| Organized food services share, FY2025 | 45–50% |
| Online food delivery share of organized food services | 25–29% |
Source: SEBI prospectus/industry data. (Securities and Exchange Board of India)
From 2020 onward, India's food delivery market experienced a major transformation as consumers increasingly adopted app-based ordering. In 2020, pandemic-related restrictions accelerated digital food ordering while restaurants increasingly depended on delivery channels to maintain customer access. During 2021, wider reopening combined with persistent digital ordering habits strengthened platform adoption. By 2022, the Indian online food delivery market was estimated at approximately £400 billion, demonstrating the scale achieved after the pandemic-driven acceleration. (Securities and Exchange Board of India)
In 2023, competition increasingly shifted toward customer retention, restaurant partnerships, delivery speed, memberships, and personalized recommendations. By 2024, market expansion was being supported by higher ordering frequency and broader adoption beyond India's largest metropolitan areas. In FY2025, the market reached an estimated £750-800 billion opportunity, while organized food services represented roughly 45-50% of the broader food-services market. (Securities and Exchange Board of India)
In 2026, the focus has moved further toward profitability, frequency, Tier-2 expansion, premiumization, and data-led competition. Industry estimates vary depending on whether they measure gross order value, platform revenue, or the broader online food-delivery ecosystem. Current forecasts nevertheless point toward sustained double-digit growth. For example, Grand View Research projects India's online food delivery revenue to reach approximately US$59.6 billion by 2030 from US$26.2 billion in 2024. (Grand View Research)
For businesses, this growth creates a larger and more complex data environment. Continuous monitoring can reveal where prices are rising, where discounts are intensifying, which cuisines are expanding, and which restaurant brands are gaining marketplace visibility.
Swiggy menu data analytics India enables businesses to examine menu structures at a granular level rather than analyzing only overall platform trends. Menu datasets can include restaurant names, cuisine types, dish names, item descriptions, base prices, discounted prices, taxes where accessible, delivery charges, ratings, review counts, availability, restaurant locations, and URLs.
| Data Point | Business Use |
|---|---|
| Restaurant name | Brand identification |
| Cuisine | Category analysis |
| Dish name | Product-level benchmarking |
| Base price | Price positioning |
| Discounted price | Promotion analysis |
| Rating | Customer perception |
| Review count | Demand/engagement proxy |
| Availability | Supply monitoring |
| Delivery fee | Total-cost comparison |
| Location | Geographic benchmarking |
In 2020, restaurant menus on delivery platforms became more important as consumers shifted toward remote ordering. Businesses increasingly needed digital visibility into menu availability, pricing, and restaurant operations. During 2021, menu digitization accelerated as restaurants optimized their online presence and adapted offerings to delivery-oriented demand.
2022, structured menu information became increasingly useful for competitor benchmarking. Businesses could compare similar dishes, restaurant positioning, cuisine categories, and promotional strategies across neighborhoods. In 2023, the expansion of cloud kitchens and virtual restaurant concepts created additional complexity because multiple brands could operate within similar categories while competing for the same digital customer.
During 2024 and 2025, menu analysis became more sophisticated. Businesses began looking beyond individual prices to examine assortment depth, combo structures, discounts, premium products, portion descriptions, ratings, and review volumes. Swiggy reported FY2024-25 food-delivery GOV of ₹28,783 crore, up 16.4% year over year, while monthly transacting users increased 15% to 14.7 million. (Swiggy)
In 2026, menu analytics increasingly supports automated competitive intelligence. Swiggy's FY2026 results showed continued acceleration, with food-delivery GOV growth of 22.6% year over year for the reported period and platform monthly transacting users reaching 25.2 million across services. (Swiggy)
For brands, recurring menu collection helps identify new dishes, removed products, price revisions, discount changes, and shifts in restaurant assortment. This creates a continuously updated dataset for pricing, category, and assortment decisions.
Zomato competitor restaurant monitoring India helps businesses understand how restaurants compete at the city, locality, cuisine, and dish levels. Restaurant competition is not uniform across India. The same brand may face different competitors, prices, discounts, and customer expectations depending on location.
The 2020 market disruption changed the restaurant competitive environment dramatically. Businesses that had strong digital ordering capabilities could continue serving customers while others struggled with limited delivery infrastructure. In 2021, restaurants increasingly optimized their marketplace listings, menu presentation, delivery availability, and promotional offers.
During 2022, competition expanded as more restaurants adopted aggregator platforms and cloud kitchens became established in major cities. Businesses increasingly needed to understand not only direct competitors but also restaurants competing for the same cuisine or customer occasion.
In 2023, restaurant discovery became increasingly data-driven. Ratings, reviews, photos, menus, discounts, delivery estimates, and location became important signals affecting digital visibility. During 2024, businesses increasingly focused on benchmarking competitors at neighborhood and cuisine levels rather than using citywide averages alone.
2025, the industry's scale made automated monitoring more valuable. The Indian online food delivery market was estimated at ₹750–800 billion for FY2025, while major platforms continued expanding restaurant networks and customer reach. (Securities and Exchange Board of India)
By 2026, competition is increasingly influenced by frequency, restaurant selection, service quality, delivery economics, and personalization. Current industry analysis suggests that Tier-2 expansion and higher order frequency will remain important growth drivers. (The Economic Times)
For restaurant groups and food brands, recurring competitor monitoring can reveal when competitors change prices, introduce new menu items, increase discounts, improve ratings, or gain visibility within target locations.
EatSure menu price monitoring India provides another layer of visibility for brands that want to understand menu pricing, promotions, product assortment, and competitive positioning. Price monitoring becomes particularly valuable when the same or comparable food categories appear across multiple delivery platforms.
| Price Variable | Monitoring Objective |
|---|---|
| Listed price | Establish base benchmark |
| Sale price | Measure effective customer price |
| Discount | Track promotional strategy |
| Combo price | Compare bundled offers |
| Delivery charge | Estimate additional customer cost |
In 2020, restaurant pricing was strongly influenced by reduced physical dining activity, changing supply costs, and operational restrictions. Delivery economics became an important factor as restaurants attempted to balance affordability with the additional costs associated with online fulfillment.
In 2021, restaurants increasingly used online discounts and promotional bundles to encourage repeat orders. By 2022, competitive pricing became more sophisticated as restaurants experimented with combos, limited-time offers, premium products, and differentiated menu structures.
During 2023, consumers had access to a wider range of restaurants and price points, increasing the importance of comparative pricing. In 2024, inflationary pressures across food ingredients, labor, packaging, and logistics encouraged businesses to monitor price movements more closely.
By 2025, online food delivery had become a large organized component of India's food-services ecosystem. Industry data placed online delivery at 25-29% of organized food services, highlighting its strategic importance for restaurants and food brands. (Securities and Exchange Board of India)
(Securities and Exchange Board of India)
In 2026, pricing intelligence is moving beyond simply identifying the cheapest restaurant. Businesses increasingly evaluate effective prices after discounts, delivery charges, combinations, and promotional conditions. A recurring dataset can therefore help identify pricing gaps, promotional patterns, and changes in customer-facing costs.
For brands operating across multiple locations, location-level price monitoring can also reveal regional pricing differences and help management teams determine whether pricing strategies remain consistent with local market conditions.
Swiggy Zomato EatSure menu price and delivery benchmark enables businesses to compare the customer-facing economics of food delivery across platforms. A meaningful benchmark should go beyond menu price because the amount paid by customers can be influenced by discounts, delivery fees, packaging charges, platform fees, minimum-order requirements, and other visible components.
| Benchmark Component | Platform A | Platform B | Platform C |
|---|---|---|---|
| Menu price | Track | Track | Track |
| Discount | Track | Track | Track |
| Effective price | Calculate | Calculate | Calculate |
| Delivery fee | Track | Track | Track |
| Packaging fee | Track | Track | Track |
| Platform fee | Track | Track | Track |
| Final payable amount | Calculate | Calculate | Calculate |
| Delivery estimate | Track | Track | Track |
In 2020, customers primarily valued availability and delivery access. Price comparisons existed, but the rapidly changing operating environment made consistent benchmarking difficult. In 2021, as delivery volumes stabilized, customers and brands gained more opportunities to compare prices and promotions across platforms.
During 2022, multi-platform ordering increased the relevance of direct comparisons. A restaurant could display similar dishes at different prices depending on platform commissions, promotions, delivery structures, or menu configurations.
In 2023, businesses increasingly recognized that headline menu prices did not necessarily represent the final customer cost. Delivery charges, packaging fees, discounts, and minimum-order conditions could materially affect purchasing decisions.
During 2024 and 2025, benchmark models became more sophisticated. Businesses began evaluating effective customer prices alongside delivery speed, ratings, availability, and assortment. Swiggy's reported FY2025 food-delivery GOV of ₹28,783 crore illustrates the scale of transaction value moving through a major platform. (Swiggy)
In 2026, benchmarking is increasingly focused on competitive decision-making. Businesses can use recurring datasets to compare equivalent dishes, restaurant chains, cuisine categories, locations, and promotional periods. This allows teams to identify whether a price difference is caused by genuine positioning or temporary promotional activity.
A standardized benchmark also supports historical analysis. By storing daily or weekly observations, businesses can determine whether competitors are consistently cheaper, whether discounts are seasonal, and whether delivery costs are changing across locations.
Swiggy Bestselling Food Brands Analytics helps businesses understand which restaurant brands, cuisines, dishes, and product categories demonstrate strong marketplace visibility and customer engagement. When combined with Swiggy Zomato EatSure price monitoring India, businesses can connect popularity indicators with pricing and promotional behavior.
| Metric | Intelligence Value |
|---|---|
| Restaurant ranking | Visibility measurement |
| Ratings | Customer perception |
| Review count | Engagement proxy |
| Dish availability | Supply consistency |
| Price | Positioning |
| Discount | Promotion intensity |
| Cuisine | Category demand |
| Location | Geographic opportunity |
In 2020, identifying bestselling food brands was difficult because restaurant operations and demand patterns changed rapidly. As ordering became more digital, platform visibility, customer ratings, menu availability, and delivery capability increasingly influenced restaurant performance.
During 2021, businesses began using customer feedback and ordering trends to refine menus and identify popular products. In 2022, the growth of cloud kitchens and specialized food brands expanded the competitive landscape. Restaurants could target specific cuisine categories without requiring traditional dine-in infrastructure.
2023, ratings and review volumes became increasingly useful as marketplace signals. Businesses could compare customer engagement across restaurant brands and identify products that appeared repeatedly within popular categories.
During 2024, premiumization and category diversification encouraged brands to examine both bestselling products and higher-value products. In 2025, expanding food delivery usage and restaurant networks created larger datasets for identifying winners at city and neighborhood levels.
By 2026, analytics can combine price, rating, review volume, availability, cuisine, restaurant visibility, and promotional activity to develop a more comprehensive view of marketplace performance. Swiggy's FY2026 results reported strong food-delivery growth and a platform MTU base of 25.2 million, demonstrating the scale of the digital consumer ecosystem. (Swiggy)
This intelligence can support assortment planning, competitive benchmarking, campaign optimization, restaurant acquisition strategies, and location-specific menu decisions. Instead of relying solely on sales data, businesses can use marketplace signals to understand what customers are seeing, comparing, and potentially choosing.
Zomato Bestselling Food Brands Analytics can help businesses move from fragmented marketplace observations to structured competitive intelligence. Actowiz Metrics focuses on scalable web data collection, data normalization, validation, historical tracking, and analytics-ready datasets.
The solution can monitor restaurant and menu attributes across selected cities, locations, categories, and platforms. Businesses can receive structured information covering restaurant names, cuisine, menu items, prices, discounts, ratings, reviews, availability, delivery information, and other accessible marketplace attributes.
With Swiggy Zomato EatSure price monitoring India, companies can establish recurring monitoring workflows rather than conducting occasional manual checks. This makes it easier to identify price changes, promotional patterns, assortment shifts, restaurant visibility changes, and competitive movements.
Key advantages include:
Actowiz Metrics can also help businesses design datasets around their specific KPIs. Whether the objective is restaurant competitor tracking, price benchmarking, bestseller analysis, menu intelligence, or geographic market research, the data structure can be customized around business requirements.
India's food delivery ecosystem has developed into a data-intensive competitive marketplace where pricing, menus, promotions, restaurant visibility, customer ratings, and availability continuously influence consumer decisions. For food brands and market intelligence teams, periodic manual checks are increasingly insufficient for understanding these rapid changes.
Eatsure Bestselling Food Brands Analytics can help businesses identify popular brands, categories, and menu opportunities while connecting marketplace visibility with pricing and customer engagement signals. When combined with Swiggy Zomato EatSure price monitoring India, businesses can develop a broader view of platform-level pricing, competitive movements, menu changes, and customer-facing offers.
From 2020 through 2026, the Indian online food delivery market has moved toward greater digital adoption, geographic expansion, increased order frequency, and more sophisticated competition. Industry estimates differ by methodology, but multiple current forecasts point to continued strong growth in the sector. (Securities and Exchange Board of India)
The next phase of competition will increasingly depend on how effectively businesses convert marketplace data into timely decisions. Structured datasets can help teams benchmark prices, monitor competitors, identify high-performing products, evaluate promotional strategies, and uncover emerging market opportunities.
Partner with Actowiz Metrics to build scalable food delivery marketplace datasets and turn real-time pricing, menu, and competitor data into actionable business intelligence!
Expert blogs, research reports and infographics — practical, data-driven reading across e-commerce and quick-commerce.
Most fields are optional — the more you share, the better your sample.
.webp "infographics")
.webp "infographics")