BLOG




















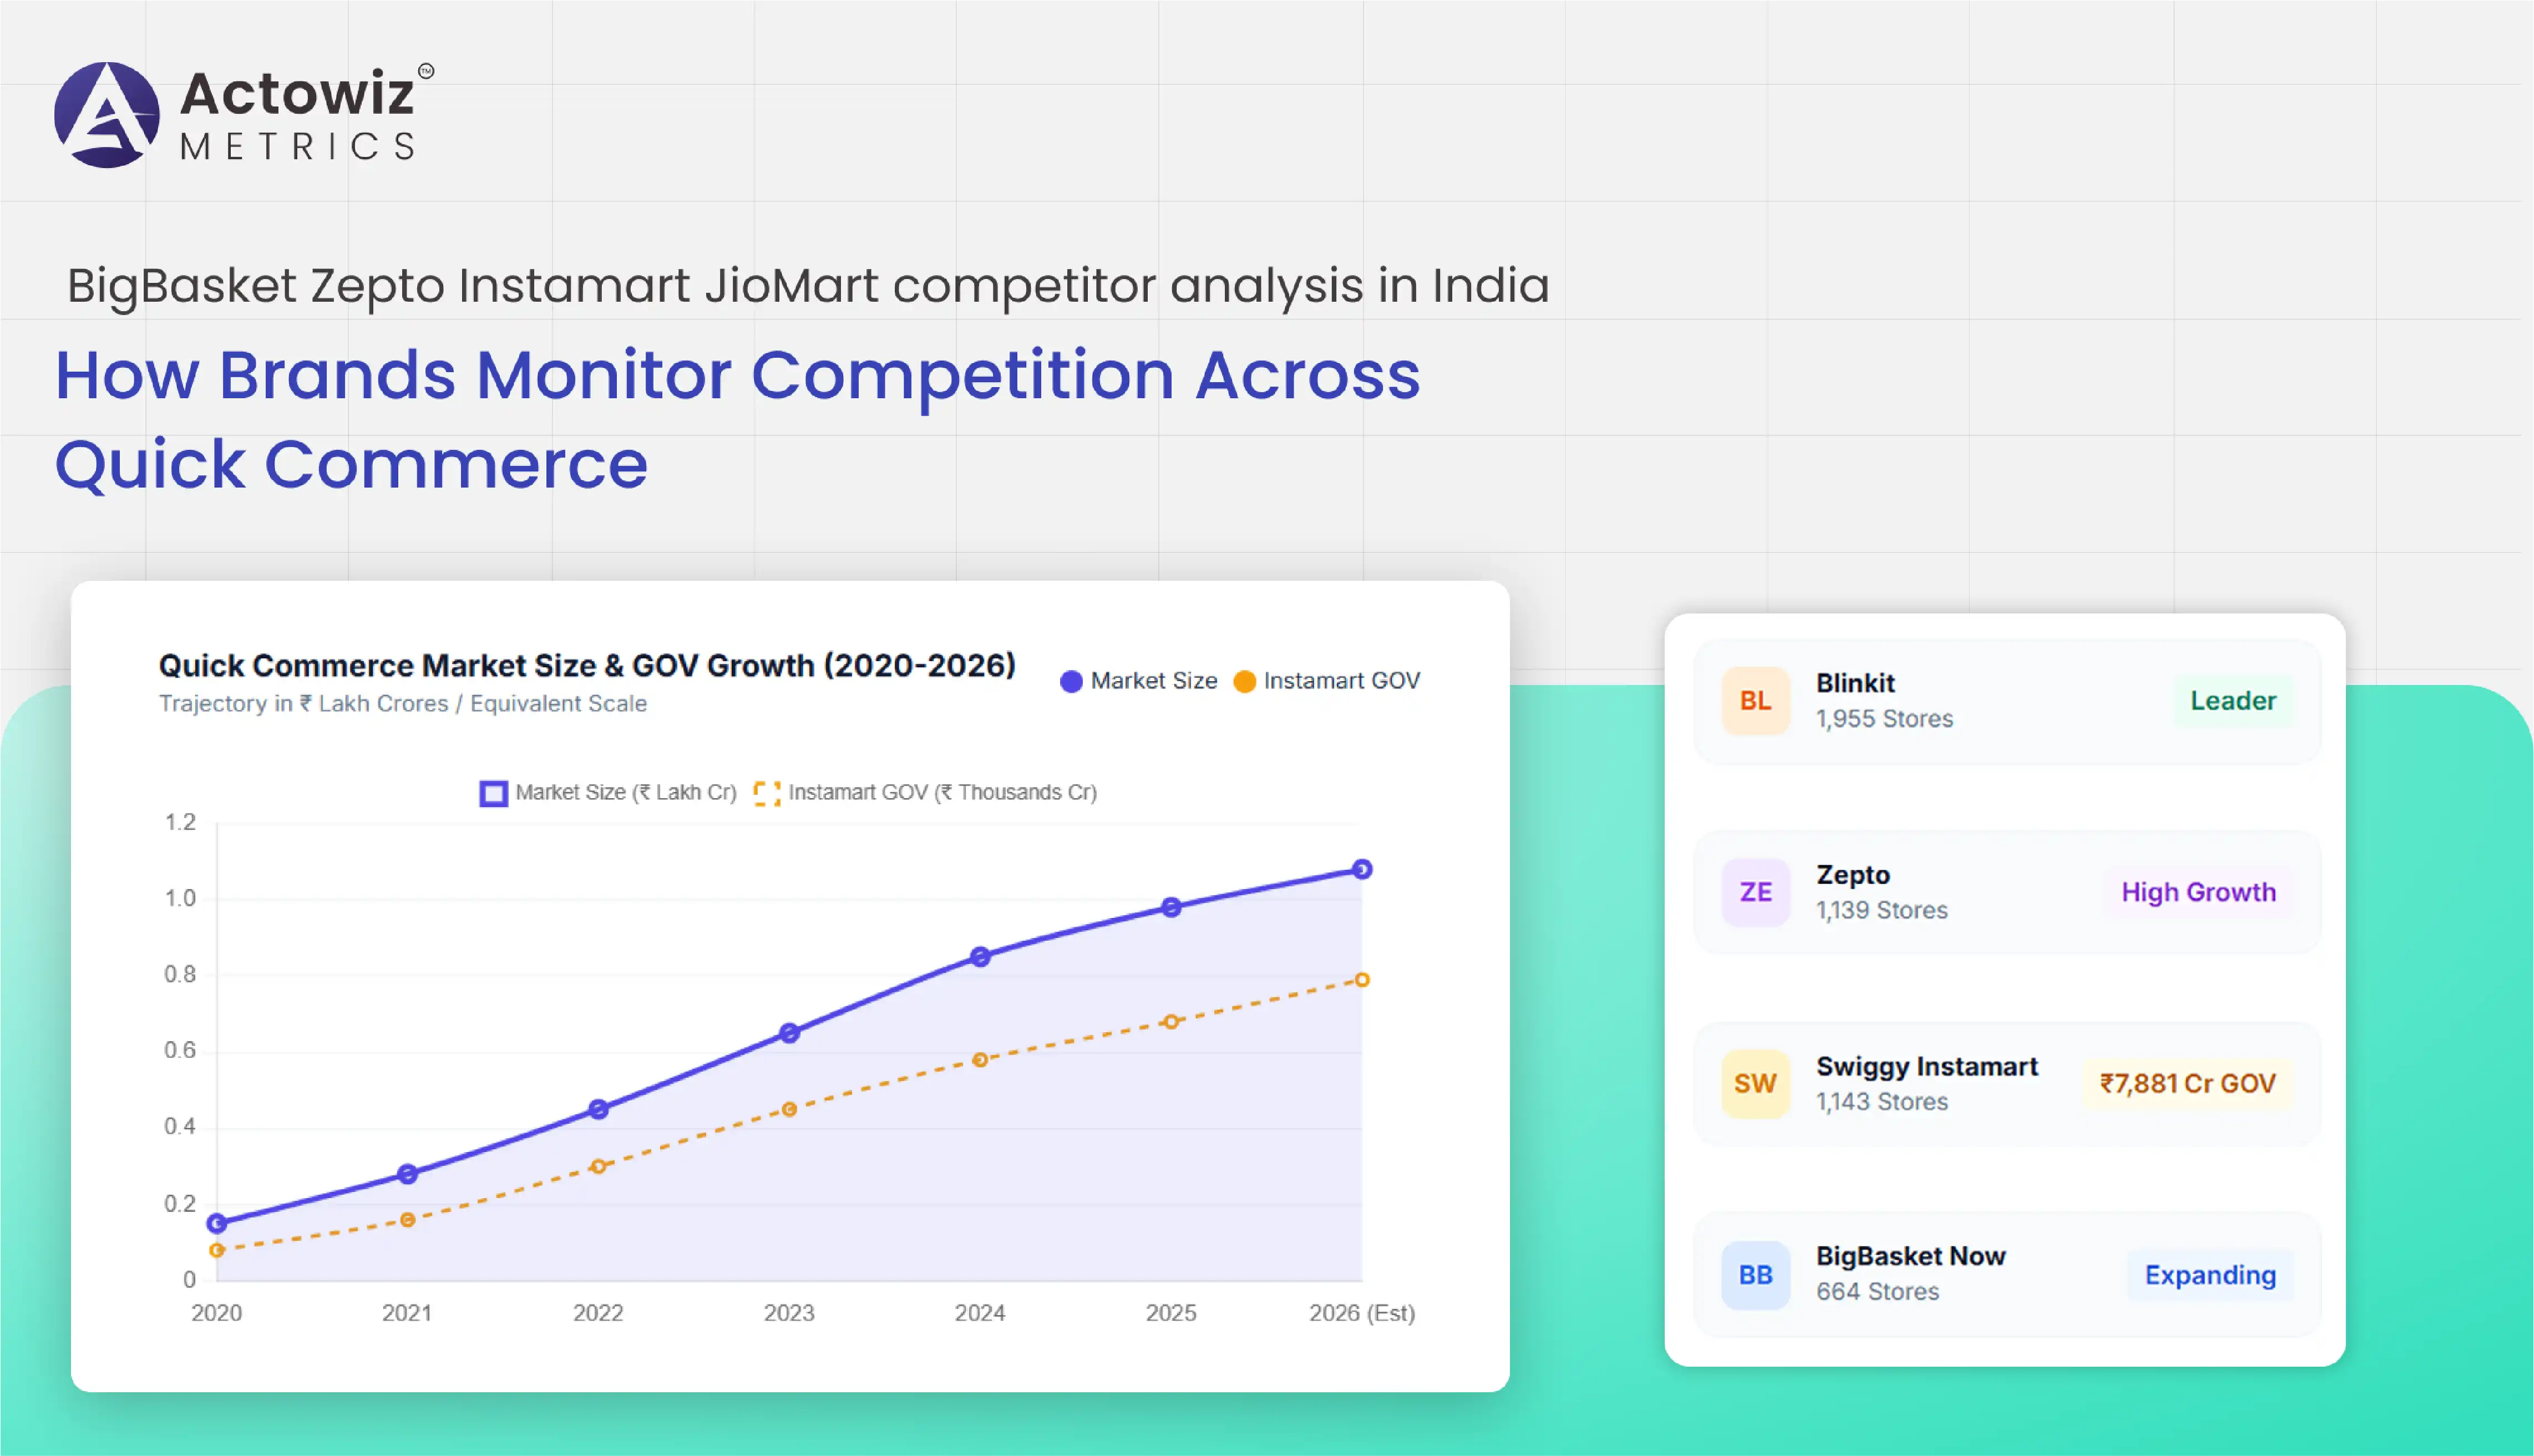
BigBasket Zepto Instamart JioMart competitor analysis in India helps brands compare grocery prices, product assortments, promotions, availability, digital shelf visibility, and competitive movements across rapidly evolving online and quick-commerce channels. For FMCG manufacturers, D2C brands, retailers, distributors, and category managers, continuous marketplace intelligence can reveal where competitors are gaining visibility, changing prices, expanding assortments, or creating availability gaps.
India's quick-commerce ecosystem has moved significantly beyond its early 10-minute-delivery proposition. By July 2026, an independent mapping exercise identified 5,625 dark stores across Blinkit, Zepto, Swiggy Instamart, Flipkart Minutes, and BigBasket, covering 408 cities and 26 states. (QuickCommerceMap) Separately, an Equirus report estimated India's quick-commerce market at ₹1.08 lakh crore in 2026, representing approximately 40% year-over-year growth. (The Economic Times)
Swiggy Instamart reported ₹7,881 crore in FY2026 GOV, up 68.8% year over year, with 1,143 dark stores across 129 cities at the end of March 2026. (Swiggy) Zepto reported 1,139 dark stores at the end of FY2026 and throughput of 1,677 orders per dark store per day during the fiscal year. (Zepto Now)
These numbers demonstrate why brands need systematic competitive monitoring. A single price check cannot explain whether a competitor has a stronger assortment, higher availability, more promotional exposure, or greater geographic reach. A structured dataset can connect these signals and convert marketplace observations into actionable category intelligence.
Grocery Quick Commerce Platform Analytics provides a framework for comparing platforms across store footprint, assortment, pricing, availability, promotions, and geographic coverage.
Quick-commerce competition increasingly operates at the neighbourhood level. Two platforms may offer the same brand nationally but differ substantially in availability and price within a specific pincode.
| Competitive Metric | What Brands Should Track | Business Application |
|---|---|---|
| Store footprint | Stores by city/locality | Market coverage |
| SKU assortment | Number of listed products | Assortment benchmarking |
| Price | MRP and selling price | Price comparison |
| Discount | Absolute and percentage discount | Promotion analysis |
| Availability | In-stock/OOS status | Supply monitoring |
| Delivery promise | Displayed delivery window | Service benchmarking |
| Promotions | Coupons, bundles, offers | Campaign intelligence |
Between 2020 and 2022, quick commerce was primarily concentrated in selected urban markets and focused on convenience and rapid fulfilment. From 2023 onward, competition became increasingly dependent on assortment, dark-store density, discounts, customer retention, and geographic expansion. By 2026, the market had developed into a multi-platform ecosystem with thousands of local fulfilment points. Equirus estimated that the combined dark-store networks of Blinkit, Instamart, and Zepto reached 5,026 locations in May 2026, compared with 3,405 a year earlier. (The Economic Times) This expansion changes how brands should conduct competitor research. Instead of monitoring only national averages, companies should segment observations by city, pincode, category, SKU, pack size, and time. A product that is competitively priced in Bengaluru may have a different price or availability status in Delhi. Similarly, a brand may have a strong national assortment but limited local availability. Platform analytics therefore becomes most useful when it combines commercial and geographic dimensions. For FMCG businesses, the resulting intelligence can support pricing decisions, assortment planning, channel strategy, inventory allocation, and promotional planning.
BigBasket grocery price tracking India enables brands to compare grocery prices, discounts, promotional offers, pack sizes, and effective selling prices across competing platforms.
Price comparison should not rely solely on headline selling prices. A proper benchmark should account for pack-size differences, MRP, discount percentage, coupons, bundles, and other visible promotional mechanics.
| Price Metric | Example Measurement | Strategic Use |
|---|---|---|
| MRP | £100 | Reference price |
| Selling price | £85 | Customer-facing price |
| Discount | 15% | Promotion intensity |
| Unit price | £8.50/100g | Fair comparison |
| Coupon | £10 off | Conditional discount |
| Effective price | £75 after offer | Basket economics |
| Price gap | Platform A vs B | Competitive benchmarking |
Recent market evidence also shows that discounting can differ substantially by category. A September 2026 Jefferies comparison of a 45-item grocery basket in Bengaluru found different average discount levels across platforms and categories, with personal care showing much deeper average discounts than dairy. (The Financial Express)
Grocery price intelligence changed considerably between 2020 and 2026. Earlier online grocery comparisons often focused on scheduled delivery marketplaces, where prices were relatively straightforward to record. Quick commerce introduced greater volatility because pricing can change according to location, promotions, inventory conditions, and customer-facing offers. From 2023 onward, brands increasingly needed SKU-level monitoring to understand whether price changes were temporary promotions or broader competitive moves. By 2026, category managers could benefit from tracking the same SKU across multiple platforms and multiple pincodes. A useful system records MRP, selling price, discount, promotion type, pack size, availability, timestamp, and location together. This makes it possible to calculate price gaps and identify repeated patterns. For example, if a competitor consistently offers a lower effective price on a specific pack size, the brand can investigate whether the difference is caused by a permanent price strategy, temporary promotion, platform-funded discount, or product-pack variation. Such context prevents teams from reacting to isolated price observations and helps them distinguish meaningful competitive movements from short-lived marketplace fluctuations.
Zepto competitor product monitoring India helps brands understand how competing platforms differ in product breadth, SKU availability, brands carried, pack sizes, and category depth.
Product monitoring becomes especially important as quick-commerce platforms expand beyond essential groceries into personal care, beauty, electronics, home products, and other categories.
| Assortment KPI | What It Reveals |
|---|---|
| Total SKUs | Overall product breadth |
| Brand count | Competitive brand diversity |
| SKU overlap | Common products across platforms |
| Missing SKUs | Assortment gaps |
| Pack-size mix | Portfolio positioning |
| New SKU additions | Assortment expansion |
| Delisted SKUs | Portfolio changes |
| Availability rate | Actual purchasability |
Zepto's FY2026 prospectus provides a useful operational benchmark: its dark-store count increased from 337 at the end of FY2024 to 1,029 at the beginning of FY2026 and 1,139 at the end of FY2026. Throughput increased from 1,325 orders per dark store in FY2024 to 1,677 in FY2026. (Zepto Now)
From 2020 to 2022, product selection on quick-commerce services was comparatively concentrated around groceries and daily essentials. Between 2023 and 2025, platforms increasingly expanded category coverage and added non-grocery products to raise basket value. By 2026, assortment had become a major competitive variable. Zepto's growth in dark-store infrastructure illustrates how fulfilment capacity can support wider local product availability. Its reported throughput of 1,677 orders per dark store per day in FY2026 also indicates the operational intensity of the model. (Zepto Now) For brands, monitoring should therefore distinguish catalogue assortment from active availability. A SKU can appear on a platform but remain unavailable in a particular location. Businesses should track product presence, price, stock status, pack size, brand, category, and timestamp together. Historical data can then identify when competitors introduce new products, discontinue SKUs, add larger or smaller packs, or increase their presence within a category. This can help category teams identify whitespace opportunities and determine where their own product portfolio may be underrepresented compared with competitors.
Instamart grocery product data analytics India allows brands to evaluate grocery assortment, pricing, availability, promotions, and category movements on Swiggy's quick-commerce platform. Swiggy Instamart analytics can further connect product-level observations with platform-level growth and geographic expansion.
Swiggy reported that Instamart's FY2026 GOV increased 68.8% year over year to 7,881 crore. The network reached 1,143 dark stores across 129 cities, while average order value increased 32.8% year over year to 700. (Swiggy)
| Instamart Indicator | FY2026 Figure |
|---|---|
| GOV | 7,881 crore |
| YoY GOV growth | 68.8% |
| Dark stores | 1,143 |
| Cities | 129 |
| Average order value | 700 |
| Quick-commerce adjusted EBITDA loss | 858 crore |
These figures provide context for why brands should monitor both product-level and platform-level changes.
Swiggy's quick-commerce business evolved from a relatively focused convenience offering into a large multi-category retail network. By FY2026, Instamart was operating in 129 cities and carrying products across 20+ categories, according to Swiggy. (Swiggy) The increase in average order value also indicates that basket composition matters alongside order frequency. For brands, this means competitor monitoring should examine not only individual SKU prices but also complementary products and category relationships. For example, a beverage brand may need to monitor snacks and ready-to-eat products that frequently appear within the same shopping mission. Likewise, personal-care brands can examine adjacent products and promotional bundles. A structured dataset can capture product title, brand, category, pack size, price, discount, availability, ratings, reviews, promotional badges, and timestamp. Over time, this information can reveal changes in category assortment, promotional intensity, and product visibility. The data becomes especially useful when segmented by city and pincode because local assortment can vary considerably according to demand and inventory.
JioMart grocery price monitoring India helps businesses observe grocery pricing, promotions, product availability, pack-size differences, and competitive changes across JioMart's digital retail ecosystem. JioMart analytics can extend this monitoring into SKU-level historical analysis.
| KPI | Monitoring Purpose |
|---|---|
| MRP | Reference price |
| Selling price | Current customer price |
| Discount | Promotion measurement |
| Unit price | Cross-pack comparison |
| Availability | Stock visibility |
| SKU count | Assortment breadth |
| Promotion frequency | Promotional strategy |
| Price change | Historical movement |
JioMart can be evaluated alongside quick-commerce platforms to understand how pricing and assortment differ between rapid-delivery and broader digital grocery channels.
Between 2020 and 2022, Indian digital grocery competition was heavily shaped by established e-commerce and grocery platforms. From 2023 onward, the rapid growth of quick commerce changed customer expectations around speed, availability, and convenience. By 2026, brands increasingly needed to understand how products perform across different digital retail formats rather than treating each channel independently. The broader quick-commerce environment is now substantial: a July 2026 independent mapping exercise identified 5,625 dark stores across five major platforms, including BigBasket, Zepto, and Instamart. (QuickCommerceMap) JioMart monitoring therefore adds another layer to cross-channel intelligence. A brand may observe different pricing or promotional strategies on a traditional digital grocery marketplace compared with a quick-commerce service. Tracking the same SKU across channels can reveal whether a price difference is caused by pack-size variation, promotional funding, inventory conditions, or channel strategy. Businesses can use historical datasets to calculate average price gaps, identify recurring promotions, and detect products that are consistently more or less competitive on specific channels. This helps category managers avoid making decisions from isolated snapshots and instead use comparable historical evidence.
Grocery Quick Commerce Digital Shelf Monitoring helps brands measure how products are presented and discovered across digital grocery platforms.
A digital shelf includes more than the product price. It can include product title, images, category placement, search visibility, ratings, reviews, promotional badges, availability, pack information, and competing products.
Digital shelf analytics became increasingly important as consumers shifted from physical retail discovery toward online product discovery. From 2020 onward, brands began monitoring marketplace listings, search placement, ratings, reviews, and product content more systematically. The quick-commerce boom added another dimension: products must not only be discoverable but also locally available for rapid fulfilment. By 2026, the competitive environment had expanded across thousands of fulfilment locations. QuickCommerceMap's July 2026 dataset identified 5,625 mapped dark stores across five platforms and 408 cities. (QuickCommerceMap) This scale makes manual digital shelf checks inefficient for large SKU portfolios. Automated monitoring can instead collect product observations at predefined intervals and normalize them into comparable records. Brands can then calculate digital shelf presence, availability rate, price position, promotional visibility, assortment share, and content completeness. These metrics can be segmented by platform, city, pincode, category, and SKU. Historical comparisons can reveal whether a product's visibility is improving or declining and whether competitor activity coincides with changes in price or availability. For FMCG and D2C businesses, this creates a more comprehensive view of marketplace execution and helps teams prioritize the SKUs and locations requiring attention.
Actowiz Metrics helps brands convert fragmented marketplace observations into structured competitive datasets. Instead of relying on occasional manual checks, businesses can establish recurring monitoring across platforms, locations, categories, and SKU groups.
BigBasket analytics can be incorporated into a broader monitoring framework covering product details, prices, promotions, availability, assortment, and digital shelf attributes.
A typical workflow can include:
For FMCG manufacturers and D2C brands, comparing the same product across platforms is particularly valuable. A standardized schema makes it possible to compare equivalent SKUs even when product titles or category structures differ.
For example, a brand can identify:
1. Which platform has the lowest effective selling price.
2. Which platform has the highest SKU availability.
3. Where competitors have introduced new pack sizes.
4. Which locations experience recurring stockouts.
5. Where promotional activity is concentrated.
6. Which products have stronger digital shelf visibility.
7. Where assortment gaps create potential distribution opportunities.
The strongest competitive datasets are historical rather than one-time snapshots. Timestamped observations allow teams to identify recurring patterns, compare promotional periods, monitor product launches, and evaluate competitive responses.
This can help pricing teams, category managers, sales teams, marketplace managers, and supply-chain teams work from a common data foundation.
India's grocery and quick-commerce landscape has become increasingly data-driven. Platforms are expanding fulfilment networks, increasing category depth, changing promotional strategies, and competing for consumer baskets across cities and neighbourhoods.
The July 2026 independent market mapping identified 5,625 dark stores across five major quick-commerce platforms, while Swiggy reported 7,881 crore in Instamart GOV for FY2026 and Zepto reported 1,139 dark stores at the end of the same fiscal year. (QuickCommerceMap)
For brands, this means competitive monitoring should move beyond simple price checks. Effective intelligence combines price, product, assortment, availability, promotion, digital shelf visibility, geography, and historical trends.
Zepto analytics can be one component of a broader cross-platform intelligence strategy that helps brands understand how products and competitors are changing over time.
Partner with Actowiz Metrics to build structured quick-commerce and grocery intelligence datasets for monitoring prices, products, promotions, availability, and digital shelf performance across India's leading platforms!
Expert blogs, research reports and infographics — practical, data-driven reading across e-commerce and quick-commerce.
Most fields are optional — the more you share, the better your sample.
.webp "infographics")
.webp "infographics")