BLOG




















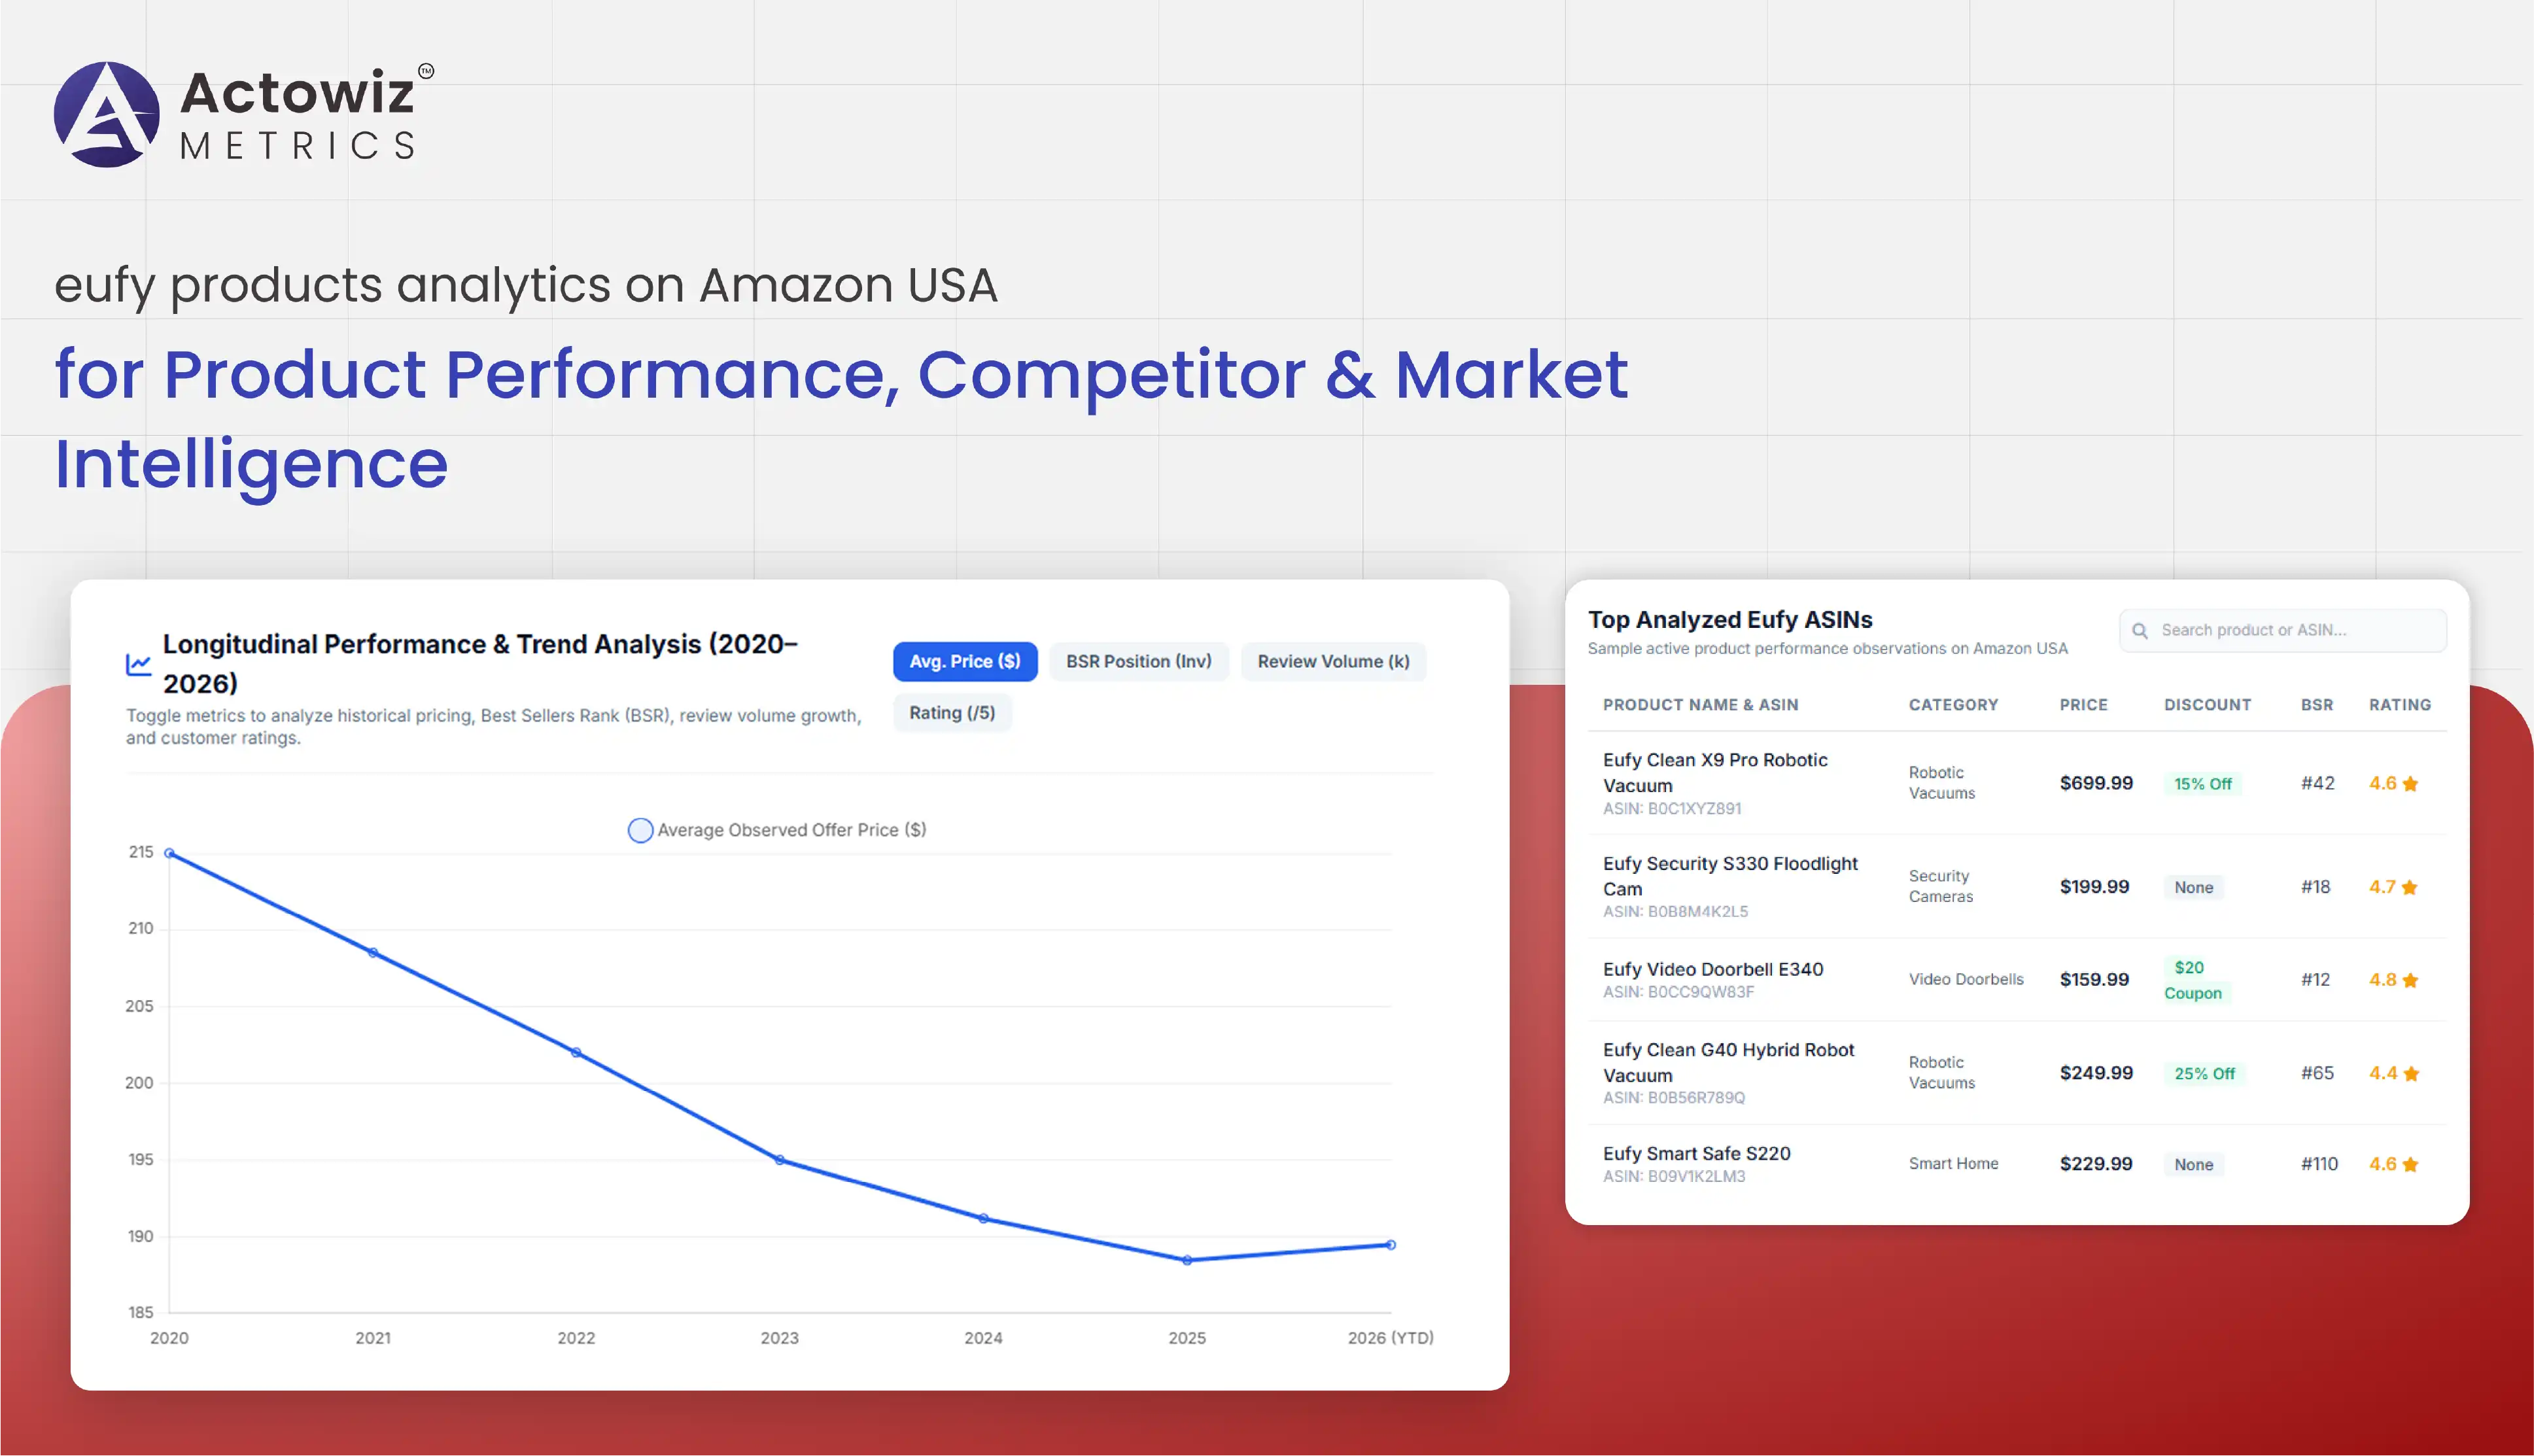
The Amazon U.S. marketplace provides a large amount of product-level information that can help brands evaluate pricing, assortment, customer response, availability, and competitive positioning. For a connected-home brand such as eufy, analyzing product listings over time can provide a structured view of how products perform across different categories and customer segments. eufy products analytics on Amazon USA can combine product prices, discounts, ratings, review volumes, Best Sellers Rank (BSR), availability, categories, specifications, and other accessible listing attributes into an analytics-ready dataset.
Amazon describes BSR as a sales-based metric showing how a product ranks against similar products in its category, with recent sales weighted more heavily than older sales. This makes historical product monitoring useful for interpreting relative marketplace performance, while recognizing that BSR is not itself a direct sales-volume figure.
For brands, retailers, researchers, and e-commerce teams, Amazon analytics can help connect product-level observations with pricing intelligence, competitor benchmarking, demand signals, category movement, and digital shelf monitoring. This report examines six analytical dimensions across the 2020-2026 period.
eufy product performance analytics Amazon can be structured around several observable marketplace indicators, including price, discount, ratings, review count, BSR, availability, product category, seller information, and listing attributes. These indicators should be monitored together rather than interpreted independently.
For example, Amazon states that BSR is calculated from sales volume and that recent sales have greater weight than older sales. It also notes that BSR does not directly reflect page views or customer reviews. Therefore, a research dataset should preserve BSR alongside review and pricing information instead of treating one metric as a complete measure of product success.
eufy products analytics on Amazon USA can help create a product-by-product historical view. Researchers can compare individual ASINs, identify changes in relative category position, and connect movements with changes in price, promotions, ratings, reviews, or availability.
| Performance Metric | What It Helps Measure | Research Use |
|---|---|---|
| BSR | Relative sales position | Demand-performance signal |
| Price | Current offer positioning | Price benchmarking |
| Discount | Promotional intensity | Promotion tracking |
| Rating | Customer satisfaction signal | Product-quality perception |
| Review count | Accumulated customer feedback | Product maturity and engagement |
| Availability | Listing accessibility | Digital shelf monitoring |
| Seller count | Marketplace offer environment | Competitive pressure |
From 2020 through 2022, online shopping acceleration increased the importance of digital product visibility and marketplace monitoring. Product listings became an increasingly important source of competitive information for brands operating in connected-home categories.
During 2023 and 2024, marketplace analytics increasingly moved toward recurring product-level monitoring rather than occasional manual checks. Teams could compare price changes, review growth, category positioning, and availability over time.
In 2025 and 2026, the emphasis has increasingly shifted toward integrated digital shelf intelligence. Instead of examining individual metrics in isolation, businesses can combine price, BSR, reviews, ratings, availability, and category information into a longitudinal product dataset. For eufy research, this approach creates a consistent framework for evaluating product performance while avoiding the assumption that any single Amazon metric represents actual revenue or unit sales.
eufy competitor analysis on Amazon USA can examine comparable products across smart-home and consumer-electronics categories. A useful competitive dataset can include competing brand names, ASINs, prices, discounts, ratings, review counts, BSR, specifications, seller information, and availability.
Amazon's product-listing guidance identifies the product detail page and associated seller offers as key components of an Amazon listing. Offers can include pricing, shipping information, and promotion details. This creates multiple observable variables for competitive benchmarking.
Competitor analysis should therefore focus on patterns rather than isolated snapshots. A product priced below another listing may have different specifications, seller conditions, promotions, or fulfillment arrangements. Similarly, a higher review count does not necessarily mean higher current sales.
| Competitive Indicator | Comparison Dimension | Potential Insight |
|---|---|---|
| Brand | Market presence | Competitive set |
| Price | Offer positioning | Price gaps |
| Discount | Promotion level | Promotional activity |
| Rating | Customer perception | Rating differences |
| Reviews | Feedback volume | Product maturity |
| BSR | Category sales position | Relative demand signal |
| Features | Product proposition | Feature differentiation |
| Availability | Digital shelf presence | Stock visibility |
Between 2020 and 2022, competitive monitoring often centered on product discovery, pricing, reviews, and assortment. As connected-home categories expanded, brands faced more products competing for similar customer needs.
From 2023 onward, competitive research increasingly benefited from historical datasets. Instead of asking only what competitors were charging today, analysts could examine how prices, discounts, reviews, and category positions changed across time.
In 2025-2026, automated competitive intelligence can combine multiple listing attributes into recurring datasets. For eufy, this enables researchers to identify comparable products, monitor category-level movements, and study changes in competitive positioning without interpreting any single marketplace signal as definitive.
eufy product pricing intelligence Amazon USA can help brands monitor list prices, current offers, discounts, promotional changes, and relative price positioning across comparable products.
Amazon's Seller Central guidance highlights pricing and shipping as important components of the customer offer and provides sellers with tools to manage and adjust pricing. For research purposes, this makes historical price tracking useful for identifying changes in marketplace positioning.
eufy products analytics on Amazon USA can organize price observations by ASIN, date, category, product type, seller, and promotional status. This can reveal whether a product's price remains stable, fluctuates periodically, or changes around promotional events.
| Pricing Metric | Example Research Question |
|---|---|
| Current price | What is the latest observed offer price? |
| Historical price | How has the price changed over time? |
| Discount percentage | How frequently are promotions observed? |
| Price range | What is the observed minimum-to-maximum range? |
| Competitor price gap | How does the offer compare with selected competitors? |
| Promotion frequency | How often are promotional events visible? |
During 2020-2022, price visibility became increasingly important as online consumers compared products across marketplaces. In 2023-2024, recurring price monitoring became more useful for identifying changes that short-term snapshots could miss.
By 2025-2026, pricing datasets can be combined with competitor, review, and availability information to create broader digital shelf intelligence. Historical price observations can help distinguish temporary promotions from longer-term positioning changes.
For eufy products, this approach can support SKU-level price benchmarking, promotion tracking, and category-level analysis. However, observed Amazon prices should be interpreted as marketplace observations for specific dates and offers, rather than as universal or permanent prices.
eufy product demand analytics Amazon USA can use multiple observable signals to build a more complete demand-monitoring framework. BSR is particularly relevant because Amazon states that it reflects a product's sales rank relative to similar products in the same category.
However, BSR should not be interpreted as a precise sales-volume number. A stronger research model combines BSR with review growth, ratings, pricing, promotions, and availability.
| Demand Signal | Interpretation |
|---|---|
| BSR movement | Change in relative sales position |
| Review growth | Accumulation of customer feedback |
| Rating changes | Movement in customer ratings |
| Availability | Product accessibility |
| Price movement | Possible relationship with market activity |
From 2020 to 2022, demand analysis increasingly relied on online marketplace signals as digital purchasing became more prominent. During 2023 and 2024, historical monitoring helped researchers understand demand patterns beyond individual snapshots.
In 2025 and 2026, demand intelligence can become more granular by combining multiple signals at the ASIN level. For example, analysts can examine whether changes in BSR occur alongside price reductions, promotions, review growth, or availability changes.
For eufy products, such a dataset can help identify products showing sustained marketplace activity, products experiencing changes in category position, and products whose performance indicators move alongside promotional activity. These observations can inform further research without claiming that marketplace signals alone reveal exact sales.
eufy product category analytics Amazon USA can help organize the brand's assortment into meaningful product groups and compare performance indicators within each category.
Category analysis is important because Amazon's BSR is category-specific. Amazon notes that products can have multiple BSR numbers when they appear in multiple categories, and rankings can differ between Amazon country stores. This makes category context essential when comparing products.
eufy products analytics on Amazon USA can therefore be structured by product category, subcategory, ASIN, price range, rating, review volume, BSR, and availability.
| Category-Level Metric | Business Application |
|---|---|
| Product count | Assortment breadth |
| Average observed price | Category pricing benchmark |
| Price range | Market positioning |
| Average rating | Customer response signal |
| Review volume | Engagement indicator |
| BSR distribution | Relative demand analysis |
| Availability rate | Digital shelf visibility |
Between 2020 and 2022, connected-home product categories expanded their presence across online marketplaces, increasing the importance of structured assortment analysis.
During 2023-2024, category-level datasets allowed businesses to move beyond individual product comparisons. Analysts could examine groups of products based on category, price band, product type, and customer response.
In 2025-2026, category intelligence can connect assortment breadth with pricing, competitive presence, and demand signals. For eufy, this means researchers can examine how products are distributed across relevant Amazon categories and identify changes in the observable marketplace structure.
Because Amazon can assign products to multiple categories, analysts should preserve the category and subcategory associated with each observation instead of assuming that every product belongs to a single universal classification.
eufy bestseller analytics on Amazon USA can use Best Sellers Rank and related marketplace indicators to identify products that show stronger relative sales positioning within their respective categories.
Amazon states that Best Sellers lists showcase top-selling products based on BSR and that these lists are frequently updated. Amazon also explains that BSR is based on sales volume, with recent sales receiving greater weight than older sales.
| Bestseller Metric | Research Application |
|---|---|
| Current BSR | Current relative category position |
| Historical BSR | Trend tracking |
| BSR change | Movement in relative position |
| Category | Context for comparison |
| Review count | Customer feedback scale |
| Rating | Customer response |
| Price | Commercial positioning |
From 2020-2022, bestseller indicators provided a useful marketplace signal for identifying products with visible sales activity. However, one-time rankings provided limited historical context.
During 2023-2024, recurring BSR collection became more valuable because it allowed researchers to observe changes over time. By tracking dates alongside BSR, teams could identify periods of relative movement.
In 2025-2026, bestseller monitoring can be integrated with price, review, rating, availability, and category datasets. This produces a more comprehensive product-performance research model.
For eufy, historical bestseller observations can help identify products requiring deeper analysis, compare relative positioning within categories, and investigate whether notable ranking changes occur alongside pricing or promotional movements. Such analysis should remain a comparative marketplace indicator rather than a direct estimate of unit sales.
Actowiz Metrics provides structured e-commerce data solutions designed around product, pricing, competitive, and digital shelf intelligence requirements. Digital shelf analytics can bring together product-level information from online marketplaces into datasets that are easier to monitor, compare, and analyze.
We can organize product names, ASINs, categories, prices, discounts, ratings, reviews, BSR, availability, seller information, and other accessible attributes.
Recurring collection can create time-series datasets that help businesses examine changes rather than relying on isolated marketplace snapshots.
Datasets can be structured around brand, category, ASIN, competitor, geography, or other business dimensions.
Data processing can include normalization, validation, deduplication, and field mapping to improve consistency.
The resulting information can support dashboards, research reports, competitive benchmarking, pricing analysis, category intelligence, and business intelligence workflows.
For brands researching eufy products analytics on Amazon USA, Actowiz Metrics can design a scalable data collection framework aligned with specific product categories, monitoring frequencies, and analytical objectives.
Marketplace intelligence becomes more useful when product observations are collected consistently and analyzed across multiple dimensions. A structured dataset covering price, discounts, ratings, reviews, BSR, availability, categories, and seller information can provide a stronger foundation for understanding product performance and competitive activity.
Amazon confirms that BSR provides a category-relative sales ranking and that recent sales carry greater weight, while listing and offer information provides additional observable context. Therefore, combining multiple indicators is more informative than treating any single metric as a complete measure of marketplace performance.
Price & promotion intelligence can complement product, category, competitor, and demand analysis by showing how commercial positioning changes over time.
For brands and researchers seeking eufy products analytics on Amazon USA, Actowiz Metrics can build structured, recurring datasets tailored to product intelligence and marketplace monitoring requirements.
Connect with Actowiz Metrics to build a customized Amazon product intelligence dataset for pricing, competitor, category, and marketplace performance analysis!
Expert blogs, research reports and infographics — practical, data-driven reading across e-commerce and quick-commerce.
Most fields are optional — the more you share, the better your sample.
.webp "infographics")
.webp "infographics")