BLOG




















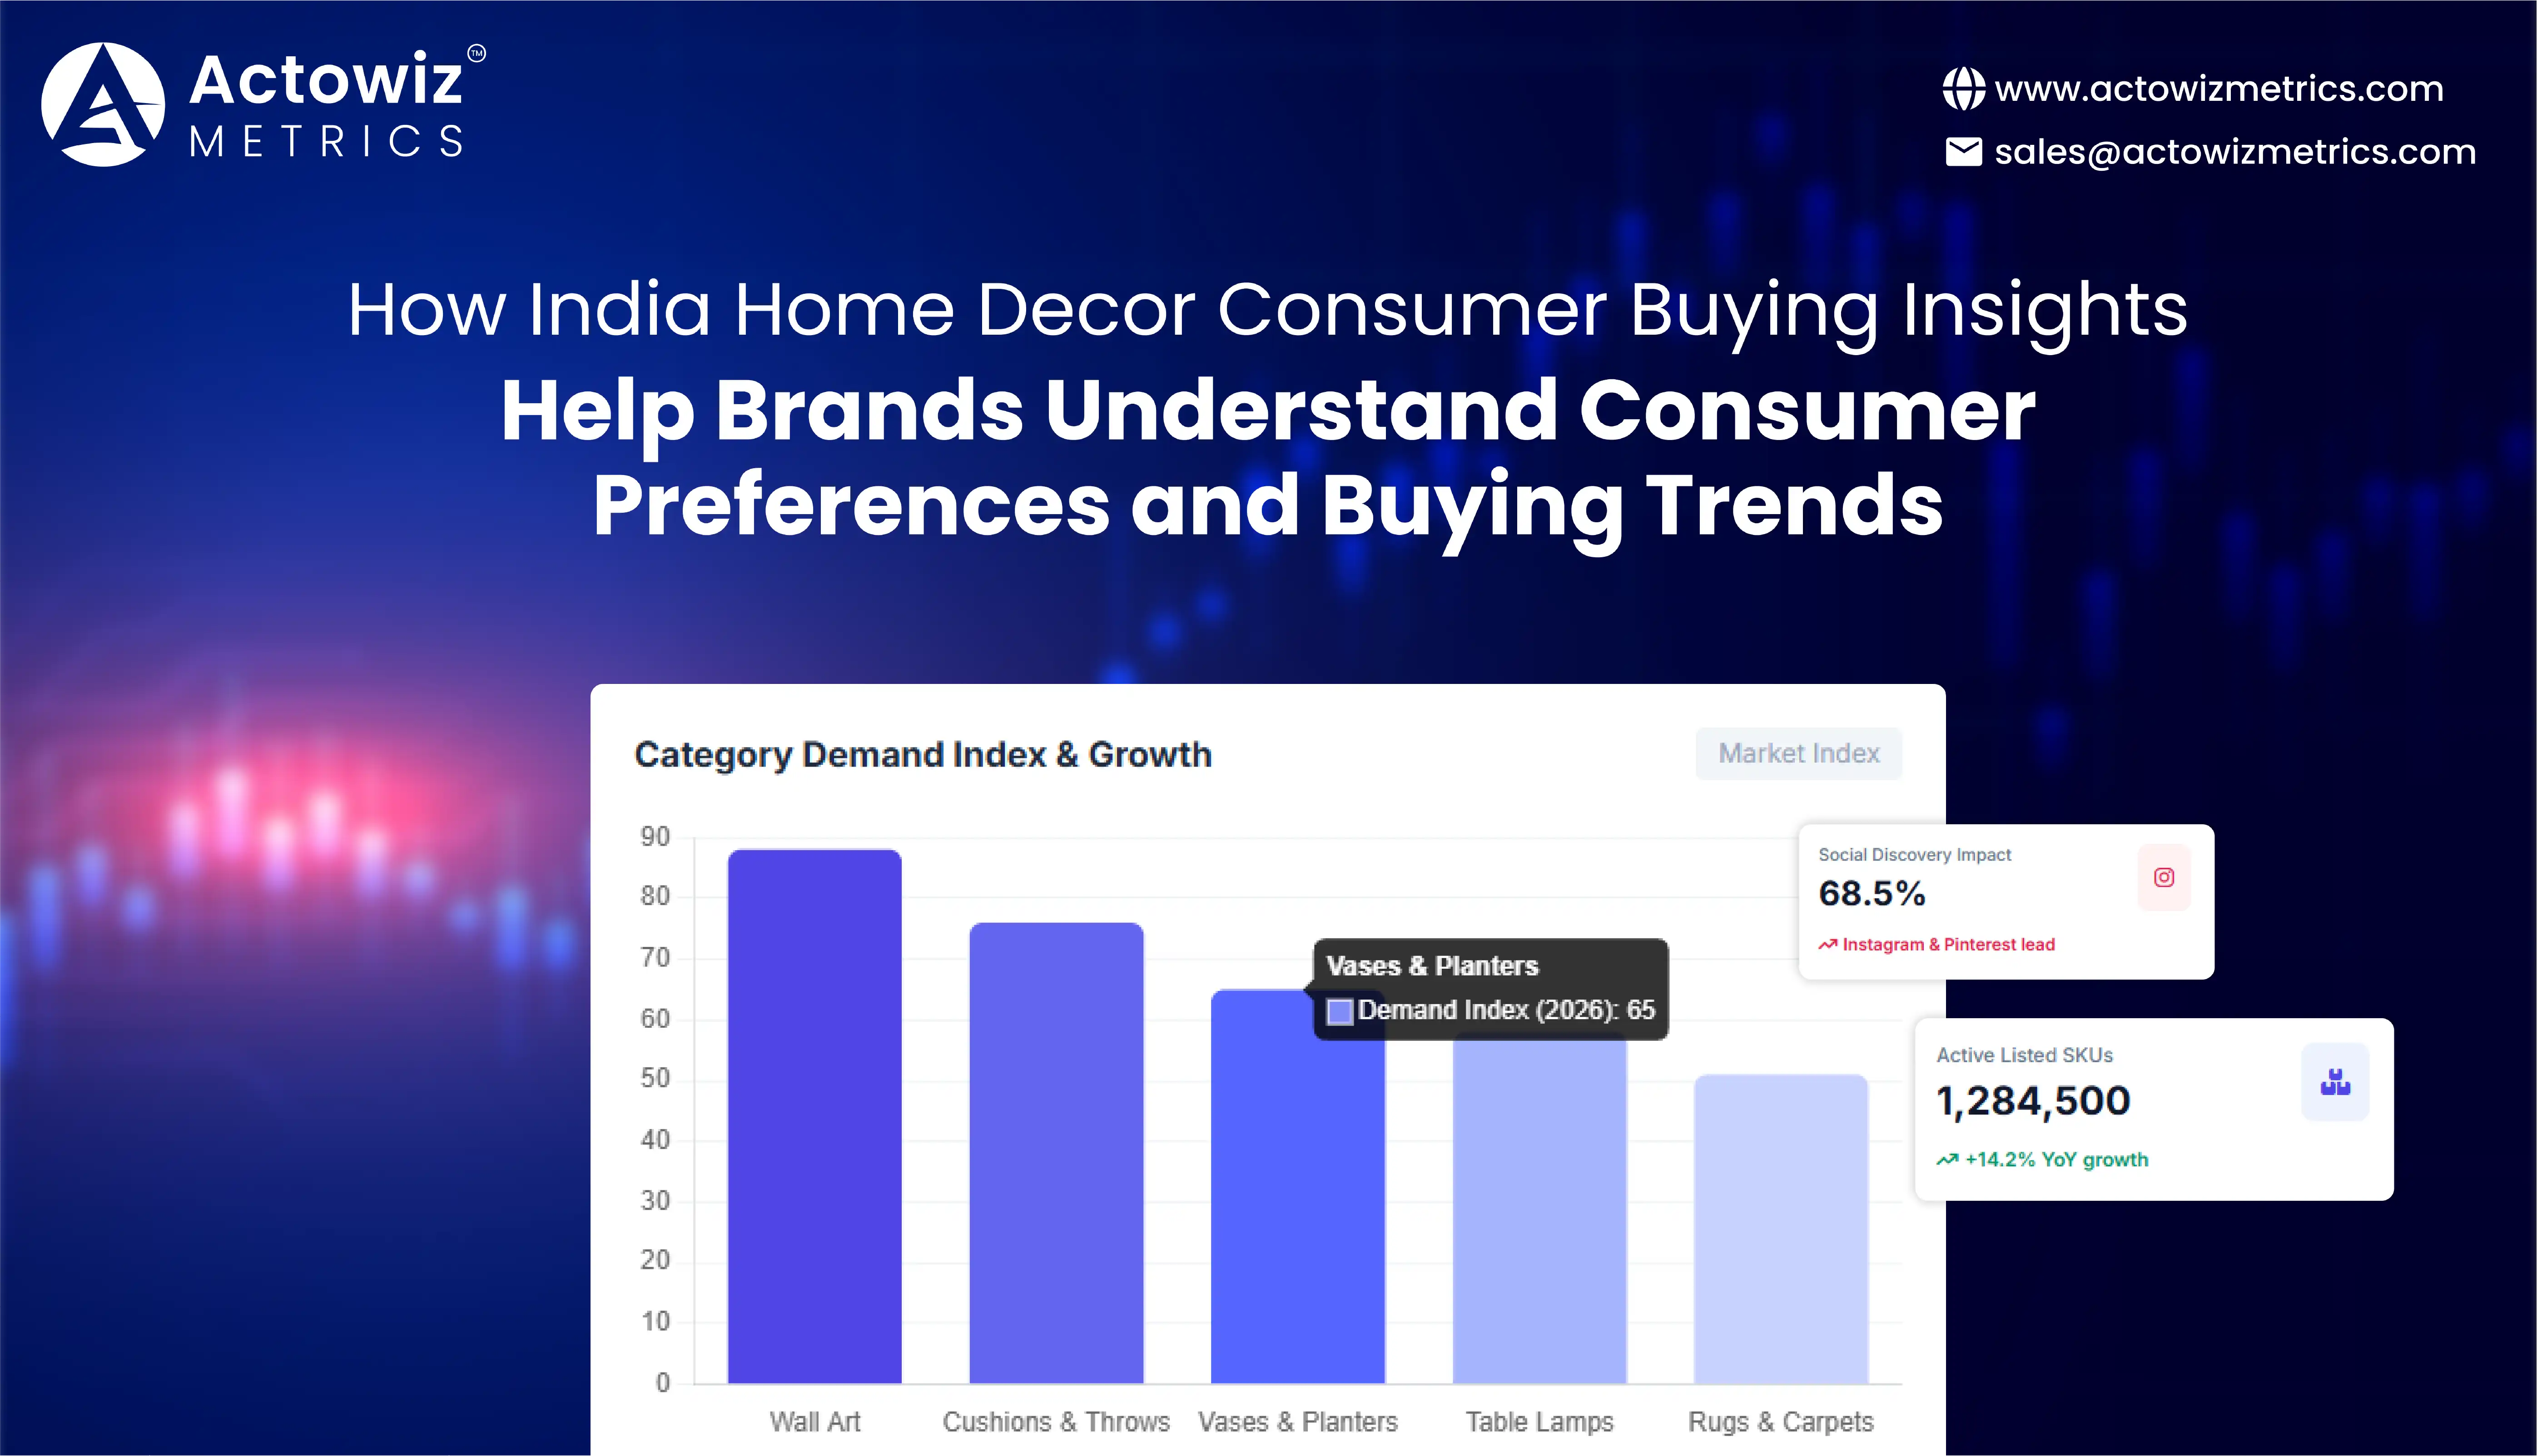
India Home Decor Consumer Buying Insights help brands understand what consumers want, where they shop, what influences their purchase decisions, and how preferences change across product categories and locations. For home decor brands, the core challenge is not simply generating more products; it is identifying the right designs, price points, promotions, channels, and customer segments before demand shifts.
India's home décor industry is becoming increasingly dynamic because consumers are exposed to global styles, social media inspiration, e-commerce marketplaces, and personalized recommendations. IBEF notes that rising incomes, urbanization, e-commerce, and changing lifestyle preferences are supporting the expansion of India's home décor industry. (India Brand Equity Foundation)
For brands, Price & promotion intelligence can connect consumer demand with actual marketplace conditions. By studying product prices, discounts, ratings, reviews, availability, categories, and competitor assortments, businesses can identify which products attract attention and which fail to convert.
This blog examines six practical dimensions of consumer and marketplace data, from changing preferences and Indian home decor trends Analysis to product demand, online shopping behavior, and competitor monitoring. The objective is to help home décor manufacturers, retailers, marketplaces, D2C brands, and investors convert fragmented market signals into actionable commercial decisions.
Indian home decor trends are becoming more diverse as consumers combine traditional Indian design elements with contemporary, minimalist, Scandinavian, bohemian, luxury, and Indo-Western aesthetics. Instead of following one dominant style, brands increasingly need to address multiple micro-segments.
Social media is an important discovery layer. Instagram, Pinterest, creator content, interior-design videos, and marketplace recommendations expose shoppers to new colors, textures, furniture arrangements, lighting concepts, wall décor, and decorative accessories. IBEF highlights the growing influence of Instagram and Pinterest on Indian interior and home décor preferences. (India Brand Equity Foundation)
| Consumer signal | What brands can monitor | Business implication |
|---|---|---|
| Style preference | Minimal, ethnic, modern, boho | Create targeted collections |
| Color demand | Neutral, earthy, vibrant | Optimize seasonal inventory |
| Material interest | Wood, metal, ceramic, fabric | Improve assortment planning |
| Product size | Compact vs. large décor | Match urban space constraints |
| Price sensitivity | MRP, selling price, discount | Improve price positioning |
| Seasonal interest | Diwali, weddings, housewarming | Plan campaign calendars |
Between 2020 and 2026, the home décor buying journey moved through several important stages. In 2020, lockdowns pushed consumers toward home improvement as more time was spent inside residential spaces. During 2021 and 2022, online discovery and e-commerce purchasing became more familiar across lifestyle categories. By 2023, social media increasingly influenced how consumers discovered interiors, décor themes, and products. In 2024, brands had to respond to more fragmented preferences across urban, Tier-II, and Tier-III consumers. By 2025, personalization, digital discovery, and premium lifestyle positioning became increasingly important. IBEF also reported that India's broader e-lifestyle market was being driven by urbanization, income growth, smartphones, internet penetration, and tech-savvy younger consumers. (India Brand Equity Foundation) In 2026, the opportunity is to combine these behavioral signals with marketplace-level product data. Rather than treating home décor as one homogeneous market, brands can identify specific combinations of style, price, product type, location, and seasonality. This creates a more precise foundation for assortment planning and customer segmentation.
Home decor product demand can vary significantly by city, income segment, season, platform, and product type. A decorative vase may perform strongly during festive periods, while storage products may benefit from year-round demand. Similarly, premium furniture accessories may attract affluent urban shoppers while affordable décor bundles may perform better among value-conscious consumers.
A structured demand analysis should combine product availability, pricing, ratings, reviews, discounts, seller count, category placement, and historical visibility.
| Indicator | What it reveals |
|---|---|
| Number of listed products | Market depth |
| New product additions | Innovation activity |
| Price movement | Competitive pressure |
| Discount frequency | Promotional intensity |
| Rating volume | Consumer engagement |
| Review growth | Recent purchase activity |
| Availability changes | Supply-demand pressure |
| Bestseller movement | Product momentum |
India's wider consumer market is becoming more research-driven as digital literacy, internet access, and e-commerce adoption increase. IBEF reports that India's internet connections reached 895 million by June 2023, with smartphones and digital payments further supporting online purchasing behavior. (India Brand Equity Foundation)
The 2020-2026 period shows why demand should be analyzed continuously rather than through occasional market surveys. In 2020, demand signals were disrupted by lockdowns and changing household priorities. In 2021, consumers continued investing in products that improved home comfort and functionality. In 2022, online product discovery became more established, giving marketplaces a larger role in influencing product consideration. In 2023, brands increasingly used ratings, reviews, pricing, and search visibility as commercial signals. In 2024, the growing diversity of Indian consumers made city-level and category-level analysis more valuable. A 2024 LocalCircles survey covering 49,000 households across 342 urban districts found that 40% expected to spend on home décor during the festive season, while budget/value and product quality were major purchase considerations. (India Brand Equity Foundation) By 2025 and 2026, brands can go beyond broad demand estimates by monitoring product-level marketplace changes. This enables businesses to identify emerging products before they become saturated, detect declining demand earlier, and adjust procurement or promotions accordingly.
Online home decor shopping trends Analysis in India shows that digital channels increasingly influence product discovery, comparison, and purchasing decisions, even when consumers eventually visit physical stores.
Home décor is particularly suited to visual commerce. Home decor product demand analysis can use product photographs, room settings, dimensions, material descriptions, customer reviews, ratings, videos, and comparison tools to help consumers evaluate products without physically visiting multiple stores.
India's e-commerce market was estimated at US$125 billion in 2024 and is forecast by IBEF to reach US$163 billion in 2026. Furniture and home décor represented 6% of the e-commerce retail segment in a 2022 sector composition snapshot. (India Brand Equity Foundation)
| Signal | Why it matters |
|---|---|
| Search visibility | Indicates product discovery |
| Product views | Measures consumer interest |
| Wishlist activity | Shows consideration |
| Ratings | Supports trust assessment |
| Reviews | Reveals product experience |
| Discount levels | Indicates conversion strategy |
| Delivery promise | Influences convenience |
| Product images | Supports visual evaluation |
The online home-shopping journey changed substantially from 2020 to 2026. In 2020, physical retail restrictions accelerated digital product discovery and online purchasing. In 2021, consumers became more comfortable evaluating products remotely using images, specifications, reviews, and seller information. In 2022, e-commerce platforms expanded assortment and improved product discovery features. By 2023, smartphones, digital payments, and marketplace competition made online shopping more accessible. IBEF reported that India had more than 830 million internet users in 2023, while smartphone usage had also expanded substantially. (India Brand Equity Foundation) In 2024, online and offline channels increasingly worked together rather than operating independently. Consumers could discover a product online, compare prices across marketplaces, visit a store, and return online for the final purchase. In 2025, personalization and social discovery became more important as brands used digital content to reach specific audiences. By 2026, home décor businesses need to understand the complete digital path from discovery to consideration and conversion. Monitoring marketplace listings alongside consumer feedback provides a stronger picture of why shoppers choose one product over another.
Home decor product data extraction enables brands to convert scattered online product information into structured datasets. Instead of manually reviewing thousands of listings, businesses can organize product information into standardized fields for analysis.
A useful dataset can include:
| Data field | Example use |
|---|---|
| Product category | Category growth analysis |
| Selling price | Competitive benchmarking |
| Discount | Promotion monitoring |
| Rating | Quality perception |
| Reviews | Consumer sentiment |
| Availability | Inventory visibility |
| Seller | Marketplace competition |
| Material | Preference analysis |
| Size | Product positioning |
| Images | Visual merchandising |
From 2020 to 2026, product-level data became increasingly valuable because digital assortment expanded faster than manual research processes could handle. In 2020, many businesses were still relying heavily on store-level observations and periodic competitor checks. In 2021 and 2022, marketplace expansion created larger and more frequently changing online catalogs. By 2023, structured product datasets became useful for identifying pricing differences, assortment gaps, and emerging competitors. In 2024, omnichannel retail made it necessary to compare online and offline signals rather than analyze either channel in isolation. By 2025, D2C brands and organized retailers were competing across marketplaces, brand websites, social commerce, and physical stores. IBEF's 2025 e-commerce overview highlighted continued growth in India's digital commerce ecosystem, supported by rising disposable incomes, digital adoption, and increasing demand from Tier-II and Tier-III cities. (India Brand Equity Foundation) In 2026, structured product data can support automated monitoring across thousands of listings. The commercial advantage comes from turning raw product records into normalized, historical datasets that reveal changes over time rather than providing only one-time snapshots.
Scrape home decor products from Indian ecommerce can help brands monitor competitor assortments, price changes, promotions, availability, seller activity, and customer feedback at scale.
For example, a home décor brand competing in wall art could monitor competing listings across marketplaces and categorize them by price range, design theme, material, dimensions, ratings, review volume, and discount.
| Competitive factor | Monitoring objective |
|---|---|
| Product assortment | Identify gaps and overlaps |
| Price | Benchmark positioning |
| Discounts | Detect promotional pressure |
| Availability | Identify stock changes |
| Ratings | Compare customer perception |
| Reviews | Identify recurring complaints |
| New launches | Detect emerging competition |
| Seller count | Measure marketplace intensity |
The objective is not simply to collect competitor data. The greater value comes from identifying patterns. If competitors repeatedly discount a category, a brand can investigate whether demand is weak or whether promotional competition is intensifying. If several sellers introduce similar designs, the category may be moving toward saturation.
Competitive monitoring evolved rapidly during 2020-2026. In 2020, brands faced disrupted supply chains and unpredictable consumer demand, making traditional competitor benchmarks less reliable. In 2021, digital marketplaces became increasingly important for product visibility. During 2022 and 2023, expanding assortments increased the difficulty of tracking competitor prices and product launches manually. In 2024, omnichannel competition meant that brands needed to compare marketplace prices, promotional campaigns, seller activity, and availability. By 2025, India's e-commerce market was entering a high-growth phase, with IBEF citing rising digital adoption and strong demand from Tier-II and Tier-III cities. (India Brand Equity Foundation) In 2026, continuous monitoring can help brands detect changes sooner. A structured historical dataset can reveal whether a competitor's discount is temporary, whether a product has disappeared from multiple channels, or whether a new category is expanding rapidly. This supports faster decisions around assortment, pricing, inventory, promotions, and positioning.
E-commerce & D2C analytics brings together multiple datasets to explain not just what is happening in the market, but why it may be happening.
For a home décor business, analytics can connect product demand with price, promotions, ratings, reviews, availability, category, location, and competitor activity.
| Business question | Data required | Possible action |
|---|---|---|
| Which products are gaining interest? | Product + review trends | Increase assortment |
| Which products face price pressure? | Competitor prices | Reassess pricing |
| Where are gaps emerging? | Category + location data | Expand assortment |
| Which promotions work? | Discount + demand data | Refine campaigns |
| What frustrates customers? | Reviews + ratings | Improve products |
| Which products are becoming saturated? | Seller + listing counts | Diversify portfolio |
Between 2020 and 2026, analytics moved from retrospective reporting toward continuous decision support. In 2020, brands primarily needed visibility into disrupted consumer behavior and supply conditions. In 2021, digital commerce generated larger volumes of customer and product signals. In 2022, marketplaces became increasingly important sources of competitive intelligence. By 2023, brands could combine pricing, reviews, assortment, and availability into more detailed dashboards. In 2024, India's expanding digital consumer base created stronger opportunities for data-led segmentation. IBEF reported that non-food consumption accounted for 60.8% of urban household expenditure in 2022-23, compared with 57.4% in 2011-12, illustrating the broader shift in consumption composition. (India Brand Equity Foundation) By 2025, D2C and e-commerce models were increasingly supported by personalization and technology. By 2026, analytics can help home décor businesses build a unified view of consumer behavior across marketplaces and direct channels. The most valuable insight is often the intersection of signals-for example, a product with rising reviews, stable availability, moderate discounts, and increasing visibility may deserve greater attention than a product with high views but weak customer feedback.
Actowiz Metrics helps home décor businesses transform marketplace information into structured, decision-ready intelligence.
1. Marketplace Data Collection
Data can be collected from relevant e-commerce channels and organized into standardized product, pricing, seller, availability, and review fields.
2. Competitive Monitoring
Brands can monitor competitor assortments, price changes, promotions, new listings, stock conditions, and marketplace positioning.
3. Ratings and Reviews Analysis
Ratings and Reviews Analysis data can reveal customer satisfaction patterns, recurring product complaints, perceived quality issues, and emerging preferences. This information can support product improvement, assortment decisions, and customer-experience strategies.
4. Price and Promotion Tracking
Historical pricing datasets can help identify discount frequency, price movements, promotional intensity, and competitor positioning.
5. Category and Assortment Intelligence
Businesses can identify fast-growing categories, underrepresented product segments, price gaps, and assortment opportunities.
6. Structured Analytics-Ready Datasets
Actowiz Metrics can transform fragmented marketplace information into structured datasets suitable for dashboards, BI systems, reporting workflows, and advanced analytics.
For home décor brands, this means moving from periodic manual research toward a repeatable intelligence workflow that supports faster and more informed commercial decisions.
The Indian home décor market is becoming more fragmented, digital, visual, and consumer-led. Brands must understand not only which products sell, but also how style preferences, pricing, promotions, reviews, availability, online discovery, and competitor activity influence purchasing decisions.
The period from 2020 to 2026 demonstrates the importance of continuous market monitoring. E-commerce has expanded access to products and consumers, while social media and digital marketplaces have accelerated trend discovery. India's e-commerce market is projected to reach US$163 billion in 2026, according to IBEF's 2025 industry data, creating a larger digital environment for brands to monitor. (India Brand Equity Foundation)
The strongest strategy is to connect consumer behavior with product-level marketplace intelligence. Brands can then identify demand shifts, optimize prices, improve assortments, detect competitor movements, and understand customer expectations with greater precision.
Ready to turn home décor marketplace data into actionable consumer intelligence? Partner with Actowiz Metrics to build scalable product, pricing, competitor, and review datasets for smarter decisions!
Expert blogs, research reports and infographics — practical, data-driven reading across e-commerce and quick-commerce.
Most fields are optional — the more you share, the better your sample.
.webp "infographics")
.webp "infographics")