BLOG




















Grocery shoppers increasingly discover products while searching, browsing categories, checking previously purchased items, and comparing products before adding them to a basket. This makes digital shelf visibility a measurable commercial priority for grocery and CPG brands. Instacart's advertising ecosystem now spans thousands of brands, more than 1,800 retail banners, and nearly 100,000 stores, giving advertisers access to high-intent grocery shoppers across a large retail network.
Instacart advertising sponsored placement for brands provides a way to put products into prominent positions across search, browsing, homepage, category, and recommendation experiences. Sponsored products are designed around sales objectives and can be optimized using bidding, relevance, product selection, and performance signals. Instacart states that sponsored products can appear throughout the customer journey, while its Ads Manager provides campaign and analytics capabilities for advertisers.
For brands, however, simply buying placements is not enough. They need to understand which products gain visibility, which searches generate clicks, how competitors occupy the digital shelf, whether advertising drives incremental sales, and how investment changes category performance. This is where Instacart analytics becomes strategically important.
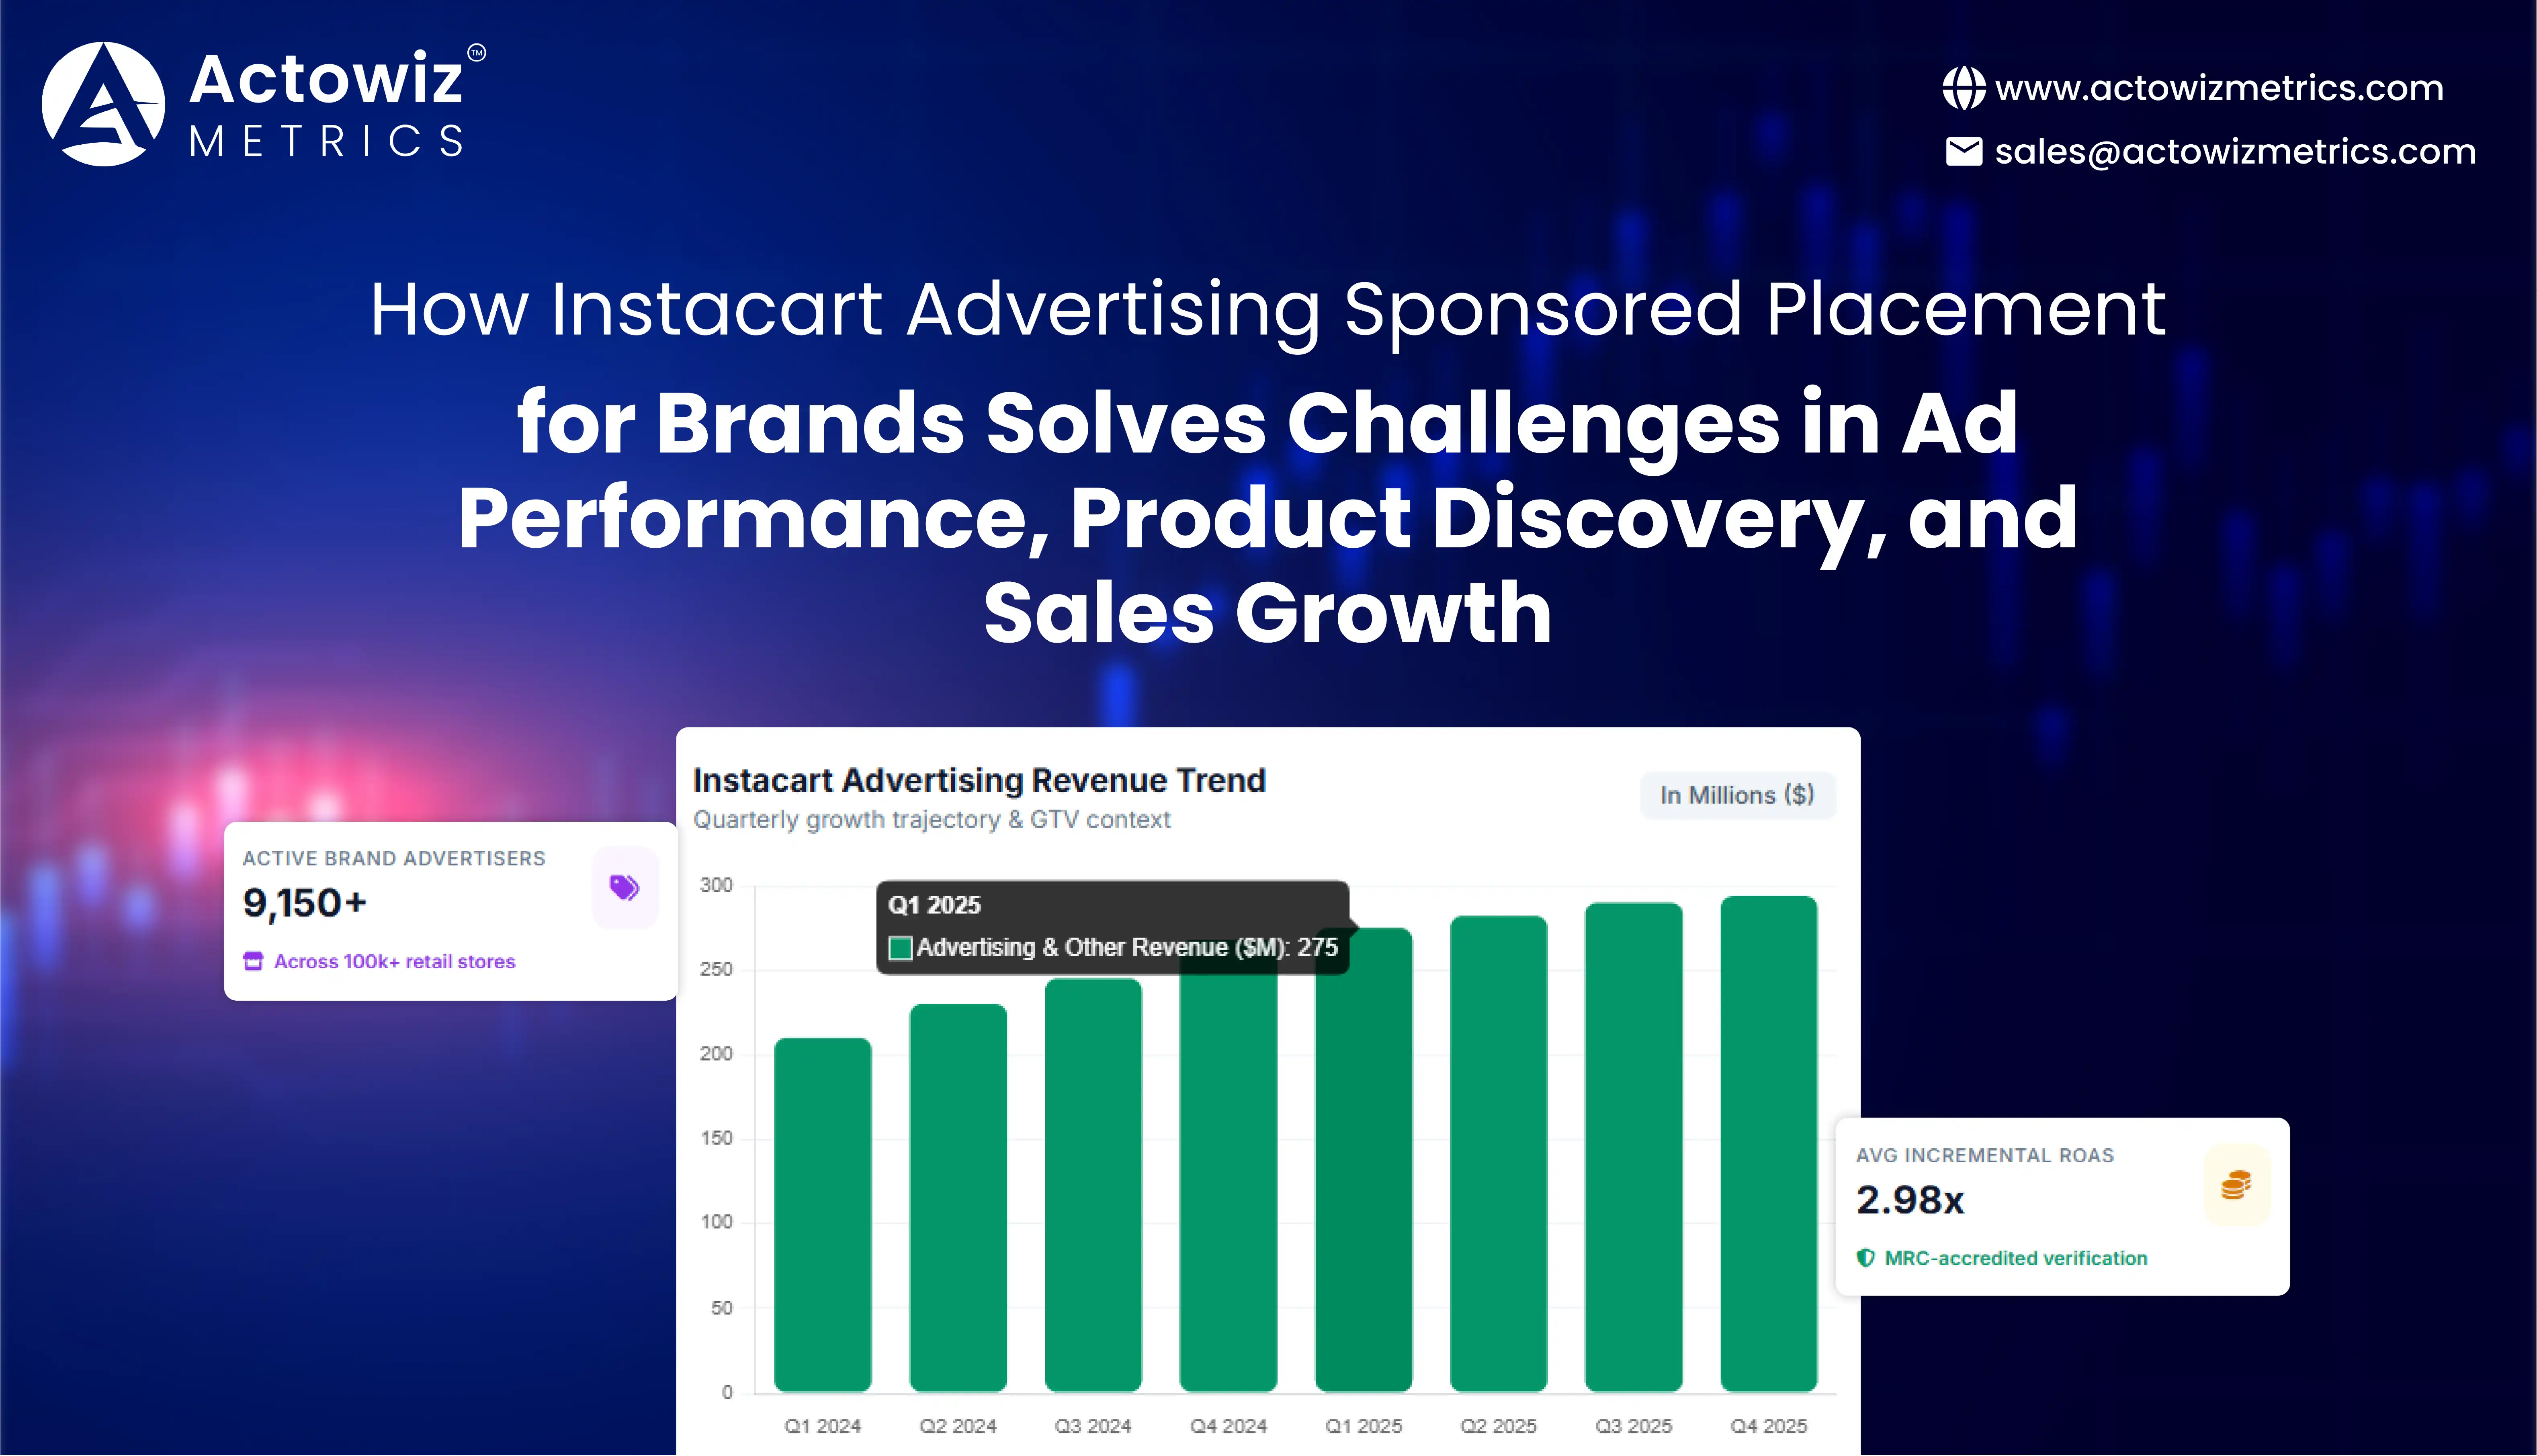
The opportunity is substantial. Instacart generated more than $1 billion in advertising and other revenue in 2025, while its Q4 2025 advertising and other revenue reached $294 million, up 10% year over year. Q4 GTV was $9.85 billion and orders reached 89.5 million, demonstrating the scale of the shopping environment in which advertising operates.
A common advertising challenge is knowing whether increasing spend actually improves business outcomes. A campaign can generate impressions and clicks while failing to produce sufficient incremental sales. Brands therefore need to evaluate the relationship between exposure, engagement, attributed sales, ROAS, incremental lift, and product-level performance.
Instacart Ads performance analytics for brands can help organize these signals into a structured measurement framework. Key indicators should include impressions, clicks, CTR, CPC, attributed sales, ROAS, conversion rate, new-to-brand customers, and incremental sales lift.
Instacart's advertising platform supports CPC bidding for sponsored products and provides campaign performance and analytics capabilities. Its measurement tools also include sales-lift testing designed to estimate incremental revenue rather than relying exclusively on attributed conversions.
The value of incrementality becomes clearer through actual brand tests. Reckitt's Q3-Q4 2022 lift test reported a 16.5% incremental sales lift from sponsored product advertising, alongside positive incremental ROAS.
| Performance signal | Why brands should monitor it | Real-world evidence |
|---|---|---|
| Incremental sales lift | Separates additional sales from attributed sales | Reckitt reported 16.5% lift |
| Incremental ROAS | Evaluates return from additional sales | Reckitt reported positive incremental ROAS |
| Sales lift | Tests causal campaign impact | Applegate reported >35% lift |
| CTR | Identifies shopper engagement | MRC-accredited measurement includes clicks |
| Viewability | Helps evaluate exposure quality | Instacart has MRC-accredited viewability measurement |
Instacart received MRC accreditation covering impressions, clicks, CTR-related measurement, and viewability for eligible ad placements, providing additional measurement standards for advertisers.
For brands, the analytical implication is important: campaign reporting should move beyond "how many clicks did we buy?" toward "which products, searches, placements, audiences, and retail environments generated incremental commercial value?"
Product discovery is strongly influenced by where an item appears when shoppers are ready to purchase. A brand may have strong distribution and competitive pricing but still lose digital visibility if competing products consistently occupy prominent positions.
Instacart digital shelf advertising intelligence helps address this visibility challenge by examining the relationship between sponsored placements and organic product discovery.
Instacart's search architecture places sponsored products within search results, while organic rankings use machine-learning signals including conversion, search-term relevance, and likelihood that products are in stock. Sponsored product positions are also influenced by ad relevance and auction dynamics.
This creates several analytical questions:
| Digital shelf metric | Business question |
|---|---|
| Sponsored position | How prominently is the product displayed? |
| Search-term visibility | Where does the brand appear for important shopper queries? |
| Share of visible placements | How much competitive shelf space does the brand occupy? |
| SKU coverage | Are priority products consistently advertised? |
| Availability | Can shoppers purchase the advertised product? |
| Competitor presence | Which brands compete for the same digital space? |
Availability is particularly important because advertising cannot compensate for an unavailable product. Instacart documentation notes that its advertising systems use availability signals and may avoid returning sponsored products when inventory is running low.
For a grocery brand, this means advertising analytics should be connected with assortment and inventory monitoring. A high-value keyword with strong demand but poor product availability represents a very different business problem from a keyword with weak shopper engagement.
A major challenge in grocery retail media is that brands rarely advertise in isolation. A consumer searching for "protein bars," "sparkling water," "coffee pods," or "baby snacks" can encounter several competing products within the same shopping session.
Instacart sponsored product competitor analysis can help brands study competitive positioning across product, category, search, and placement dimensions. The objective is not simply to identify who appears, but to understand how frequently competitors appear, which SKUs they promote, and where competitive pressure is strongest.
Instacart has explained that its sponsored product system uses auctions and relevance signals to determine advertising placement. Its earlier description of second-price auctions also highlighted the importance of both bids and product relevance in placement decisions.
A structured competitor dataset can therefore include:
| Data point | Competitive use |
|---|---|
| Brand | Identify competing advertisers |
| Product/SKU | Compare promoted products |
| Category | Map competitive concentration |
| Search query | Identify high-value demand areas |
| Sponsored position | Measure visibility |
| Price | Evaluate price positioning |
| Discount | Compare promotional intensity |
| Availability | Detect lost-sales opportunities |
| Rating/reviews | Assess shopper trust signals |
| Retailer | Identify distribution differences |
The scale of the ecosystem makes this analysis increasingly relevant. Instacart reported that its retail network grew from more than 1,800 banners to over 2,200 by early 2026, while more than 9,000 brands advertised on the platform in Q4 2025.
This expansion creates a larger competitive dataset but also increases analytical complexity. A brand may perform strongly at one retailer and lose visibility at another. Likewise, a SKU can dominate one category search while being barely visible for a related query.
Instacart advertising sponsored placement for brands therefore needs to be assessed at multiple levels: SKU, category, keyword, retailer, geography, and time period. Monitoring these dimensions helps identify where advertising investment is defending existing shelf visibility versus creating incremental opportunities.
Retail media data changes rapidly. Campaign performance can shift with daily shopping patterns, promotions, competitor bids, product launches, holidays, weather, seasonality, and inventory availability. Manual reporting makes it difficult to identify these changes quickly.
Instacart Advertising Data Analytics Services can address this challenge by creating a structured data pipeline that collects, normalizes, validates, and analyzes advertising and product signals.
A scalable analytics workflow can combine:
Instacart's own advertising APIs support campaign management and performance reporting, including product selection, keywords, budgets, CPC bids, and analytics retrieval.
| Analytics layer | Example output |
|---|---|
| Collection | Daily campaign and product records |
| Normalization | Standardized SKU and brand identifiers |
| Validation | Duplicate, missing-data, and anomaly checks |
| Enrichment | Category, retailer, price, promotion |
| Competitive analysis | Share of sponsored visibility |
| Trend analysis | Week-over-week and month-over-month movement |
| Dashboard | Brand, SKU, category, and retailer views |
This approach is particularly useful for organizations managing hundreds or thousands of products. Instead of evaluating campaigns one by one, analysts can create rules that flag unusual performance automatically.
For example, a dashboard can identify SKUs where impressions increased by 40% but CTR declined, products where CPC increased without corresponding sales growth, or campaigns where sales rose but inventory availability fell. These patterns can then trigger further investigation.
The goal is not merely to collect more data. It is to convert fragmented advertising observations into comparable, historical datasets that support faster decisions.
For grocery brands, advertising performance ultimately has to connect with products being added to baskets. High visibility is useful only when it contributes to discovery, conversion, customer acquisition, or sales.
Instacart sponsored product ads for grocery brands are positioned across search, browsing, homepage, category, and recommendation experiences. Instacart describes sponsored products as a sales-oriented ad format, while its current advertising ecosystem supports campaigns designed around sales, new-to-brand acquisition, awareness, and other objectives.
Real-world tests demonstrate why measurement matters. Saffron Road reported a 68% incremental sales lift in a sponsored product study covering January 1-February 11, 2024. Torani reported a 67% incremental sales lift and $2.98 incremental ROAS in a six-week study ending November 15, 2024.
| Brand/test | Reported result | Measurement period |
|---|---|---|
| Reckitt | 16.5% incremental sales lift | Q3-Q4 2022 |
| Applegate | >35% incremental sales lift | Q3 2022 |
| Saffron Road | 68% incremental sales lift | Jan-Feb 2024 |
| Torani | 67% incremental sales lift; $2.98 incremental ROAS | Six weeks ending Nov. 15, 2024 |
| CPG A | 21% in-store sales lift | Q2 2024 |
| CPG B | 15% in-store sales lift | Q2 2024 |
These figures are brand-specific case-study results and should not be interpreted as guaranteed outcomes for every advertiser. Instacart itself notes that prior results do not guarantee future performance.
The broader lesson is that brands should evaluate advertising against actual commercial outcomes. In-store impact is also relevant. Instacart reported Circana analyses in which one CPG brand saw a 21% in-store sales lift and another saw 15% among consumers exposed to sponsored product ads.
That makes omnichannel measurement increasingly important for grocery advertisers whose customers move between online research, digital ordering, pickup, delivery, and physical-store shopping.
Bestselling products do not necessarily remain bestsellers indefinitely. Grocery demand can change quickly due to seasonality, pricing, promotions, new product launches, changing consumer preferences, and competitor activity.
Instacart Bestselling Grocery Brands Analytics can help brands examine product velocity, category performance, sales trends, basket behavior, and competitive movement over time.
Instacart launched its Consumer Insights Portal in 2025 to provide brands with real-time grocery shopping trends across more than 1,800 retail partners. The company said the platform uses daily activity from nearly 100,000 stores and provides SKU-level performance, search behavior, substitution patterns, and promotion-impact information based on actual transactions.
| Trend to monitor | Why it matters |
|---|---|
| Top-selling SKUs | Identifies products driving category demand |
| Emerging SKUs | Finds products gaining momentum |
| Category share | Tracks competitive position |
| Basket association | Identifies complementary products |
| Search growth | Detects rising shopper interest |
| Price movement | Connects pricing with demand |
| Promotion response | Measures promotional effectiveness |
| Retailer variation | Finds regional or retailer-specific opportunities |
Between 2020 and 2026, grocery e-commerce and retail media moved from rapid pandemic-era adoption toward a more mature, measurement-focused environment. Instacart's filing data shows orders increased from 223.4 million in 2021 to 262.6 million in 2022, while GTV increased from $24.9 billion to $28.8 billion during the same period. By 2025, the advertising business had surpassed $1 billion in annual ads and other revenue, while Q4 2025 alone produced $294 million in advertising and other revenue. In 2026, Instacart described an ecosystem spanning more than 2,200 retail banners, nearly 100,000 marketplace stores, more than 310 ecommerce sites and marketplaces, and more than 9,000 active advertising brands. Measurement also matured: MRC accreditation expanded to Instacart's Carrot Ads network in 2025, covering verified advertising metrics across more than 240 ecommerce partners. The progression shows how grocery advertising has evolved from basic digital visibility toward integrated measurement of placements, shopper behavior, sales, incrementality, and omnichannel performance.
Retail media is becoming increasingly data intensive. Brands need more than campaign dashboards; they need a consolidated view of advertising visibility, competitor activity, product availability, pricing, promotions, and category movement.
Actowiz Metrics can support this requirement through Retail media intelligence solutions designed around structured data collection, normalization, monitoring, and analytics.
For Instacart advertising sponsored placement for brands, a scalable intelligence framework can help businesses:
The analytical layer can also connect advertising observations with digital shelf indicators. For example, brands can identify whether a reduction in sponsored visibility coincides with a competitor gaining placement, whether a price promotion changes product visibility, or whether an advertised SKU remains sufficiently available to convert shopper interest.
This is especially useful for FMCG organizations managing broad product portfolios. Instead of treating each campaign as an isolated activity, businesses can create a continuous intelligence system that connects advertising, assortment, pricing, availability, competition, and shopper demand.
Instacart's scale demonstrates why grocery advertising requires increasingly sophisticated measurement. The platform generated more than $1 billion in ads and other revenue in 2025, while its advertising ecosystem continued expanding across retailers, ecommerce sites, marketplaces, and in-store experiences.
For brands, the challenge is no longer simply obtaining a sponsored placement. The bigger challenge is understanding what happens before, during, and after that placement: whether shoppers see the product, whether competitors capture the same search demand, whether the product is available, whether clicks become purchases, and whether advertising generates incremental sales.
Grocery and FMCG (CPG) digital shelf analytics can provide the broader analytical framework required to answer these questions by connecting product visibility, advertising activity, competitive positioning, pricing, promotions, availability, and sales signals.
Ultimately, Instacart advertising sponsored placement for brands becomes more valuable when supported by continuous data analysis rather than isolated campaign reporting. A structured intelligence approach allows brands to benchmark performance, identify competitive gaps, discover emerging products, and make advertising decisions using historical and real-time evidence.
Turn Instacart advertising and digital shelf data into actionable grocery intelligence with Actowiz Metrics—contact our team to build a customized data analytics solution for your brand!
Expert blogs, research reports and infographics — practical, data-driven reading across e-commerce and quick-commerce.
Most fields are optional — the more you share, the better your sample.
.webp "infographics")
.webp "infographics")