BLOG




















India Product Export Data and Market Insights helps exporters identify attractive markets by connecting product-level trade values, destination demand, growth rates, competitor activity, HS codes, and historical trends. Instead of relying on broad assumptions about global demand, exporters can evaluate which products are gaining traction, where Indian shipments are increasing, and which markets warrant deeper commercial research.
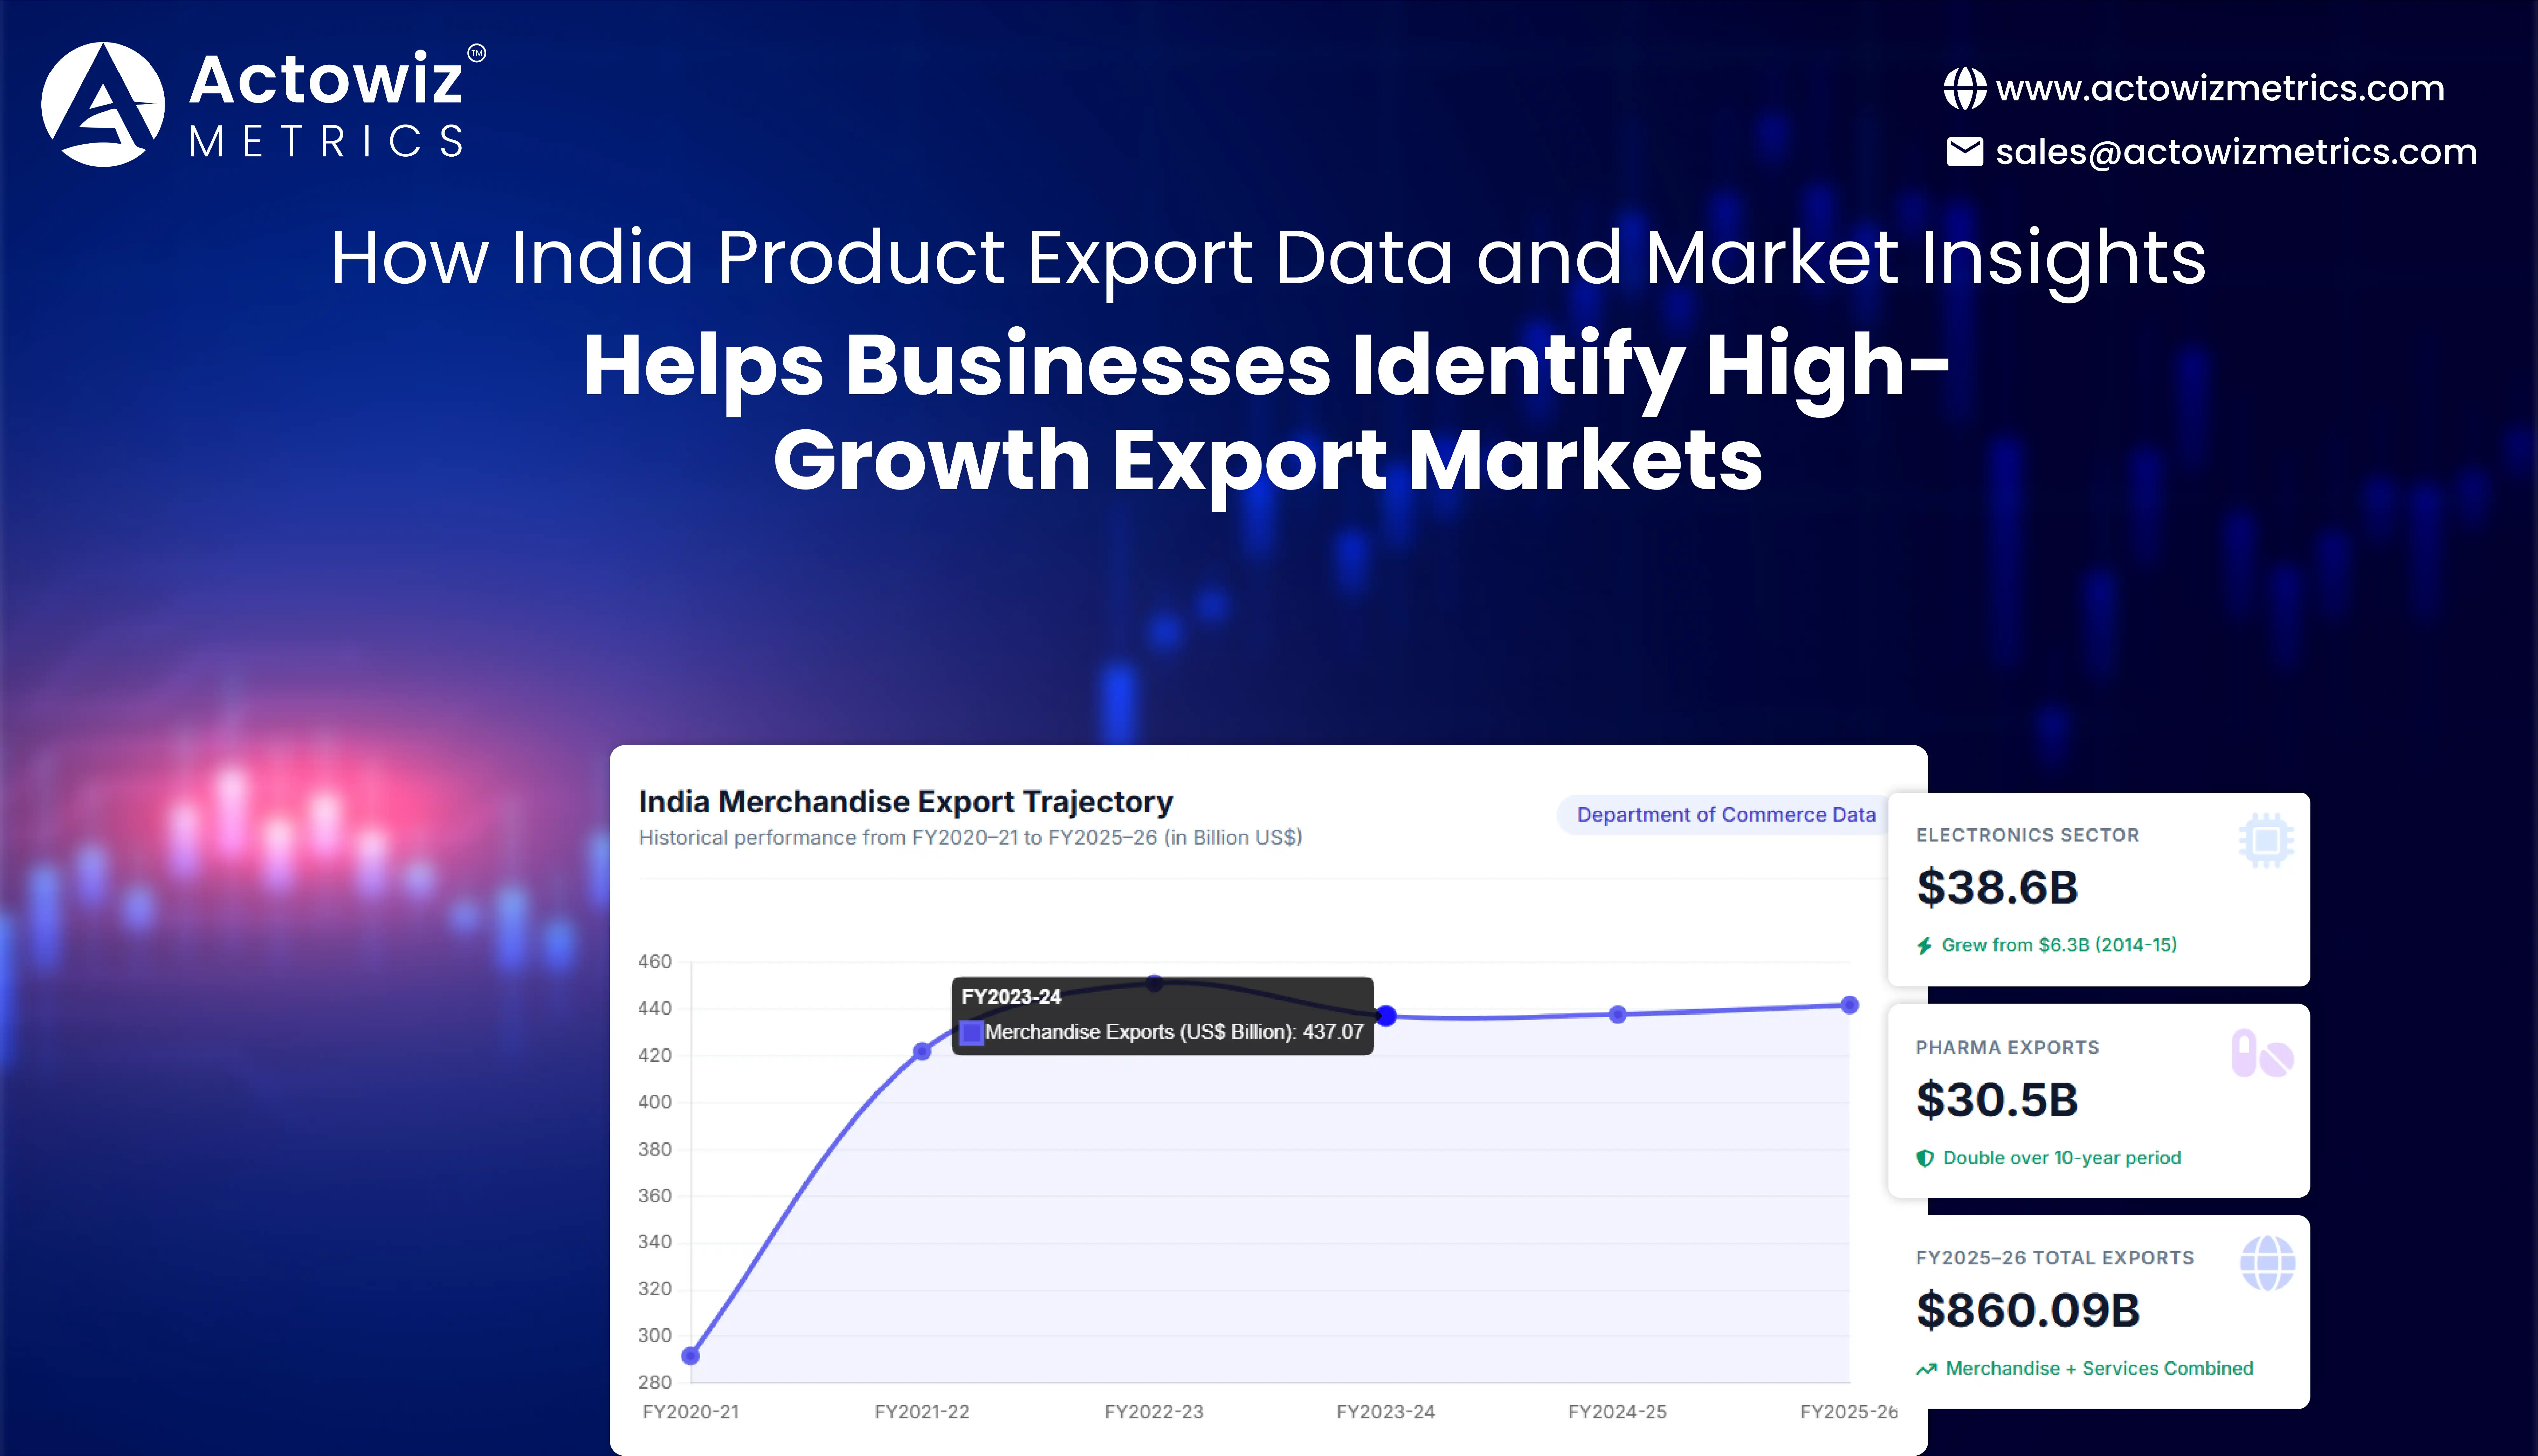
India's merchandise exports reached US$441.78 billion in FY2025–26, compared with US$437.70 billion in FY2024–25. Total merchandise and services exports were estimated at US$860.09 billion in FY2025–26.
This creates a substantial opportunity for manufacturers, exporters, distributors, market researchers, trading companies, and consumer brands. However, the opportunity is not evenly distributed across products or destinations. Digital shelf analytics can complement export intelligence by helping businesses monitor product visibility, pricing, assortment, and competitive positioning across digital marketplaces in target markets.
The Ministry of Commerce's Trade Intelligence and Analytics portal currently covers more than 217 trading partners and 11,700+ HS8 commodities, demonstrating the scale of India's international trade dataset.
For businesses, the practical question is not simply:
"How much does India export?"
It is:
"Which Indian products are growing, where are they growing, who is buying them, and what evidence supports entering that market?"
A country may be a large export destination overall while offering limited opportunity for a specific product. Conversely, a smaller destination can show strong product-specific growth.
Exporters should therefore examine:
This transforms trade statistics into actionable market intelligence.
India's export trajectory shows both scale and diversification.
| Indicator | Real-world figure | Period |
|---|---|---|
| Merchandise exports | US$291.81B | FY2020–21 |
| Merchandise exports | US$422.00B | FY2021–22 |
| Merchandise exports | US$451.07B | FY2022–23 |
| Merchandise exports | US$437.07B | FY2023–24 |
| Merchandise exports | US$437.70B | FY2024–25 |
| Merchandise exports | US$441.78B | FY2025–26 |
| Total exports: merchandise + services | US$860.09B | FY2025–26 |
The figures from FY2020–21 through FY2023–24 are reported by the Department of Commerce, while FY2024–25 and FY2025–26 figures come from later official releases.
The data shows a major jump after FY2020–21, followed by a period of normalization. This makes product-level analysis important because overall export growth does not reveal which individual categories are driving expansion.
India Export Product Trend Monitoring enables businesses to track changes in product demand across countries and time periods.
Instead of looking at one year's export value, exporters can create a multi-year trendline for each HS code.
For example, the Department of Commerce reported that electronic goods exports increased from US$6.3 billion in 2014–15 to US$38.6 billion in 2024–25. Their share of India's merchandise exports increased from 2.02% to 8.82% during the same period. Pharmaceutical exports also increased from US$15.4 billion in 2014–15 to US$30.5 billion in 2024–25.
What should exporters monitor?
| Metric | Business application |
|---|---|
| Export value | Measures commercial scale |
| YoY growth | Detects acceleration or decline |
| CAGR | Measures longer-term momentum |
| Shipment count | Indicates trading frequency |
| Destination count | Measures geographic diversification |
| Average unit value | Supports product-value analysis |
| HS-code concentration | Identifies category dependency |
| Destination growth | Finds expanding markets |
The 2020–2026 period demonstrates why exporters need historical context before interpreting current numbers. India's merchandise exports fell to US$291.81 billion in FY2020–21 before rebounding sharply to US$422 billion in FY2021–22 and US$451.07 billion in FY2022–23. Exports then moderated to US$437.07 billion in FY2023–24 as global trade conditions and geopolitical pressures affected merchandise trade. FY2024–25 showed stabilization, with merchandise exports reported at US$437.70 billion, while FY2025–26 reached US$441.78 billion. The important analytical lesson is that a single-year increase should not automatically be interpreted as a structural trend. Exporters can compare three-, five-, or six-year patterns to distinguish temporary changes from sustained category momentum. Product-level monitoring also allows companies to identify categories that are growing even when total merchandise exports remain relatively stable. This is particularly useful for manufacturers deciding which products deserve additional certification, production capacity, distributor development, or international marketing investment.
India Export Competitive Intelligence helps exporters compare India's product performance with competing supplier countries.
Competitive analysis should not stop at identifying the largest exporting country. Businesses should investigate:
| Factor | What it reveals |
|---|---|
| Export value by country | Supplier scale |
| Market share | Competitive position |
| YoY change | Momentum |
| Unit value | Pricing positioning |
| Product mix | Portfolio overlap |
| Destination coverage | Geographic reach |
| Shipment frequency | Supply continuity |
| Supplier concentration | Entry opportunity |
The Ministry of Commerce identifies petroleum products, electronic goods, drugs and pharmaceuticals, and engineering goods among India's leading export commodities. Together, the portal reports that these top commodities account for 57% of India's exports.
From 2020 through 2026, international competition became increasingly important because exporters faced changing supply chains, geopolitical disruptions, freight-cost fluctuations, and shifts in sourcing strategies. India's merchandise exports recovered strongly after FY2020–21, but the subsequent moderation demonstrates that global demand conditions matter alongside domestic production capability. Competitive intelligence can reveal whether a product's growth reflects genuine market expansion or simply temporary changes in supplier availability. The Department of Commerce's current trade analytics platform provides data covering more than 217 trading partners and more than 11,700 HS8 commodities, creating the foundation for country-product comparisons. By 2025–26, India's leading export destinations included the United States, United Arab Emirates, China, Netherlands, and United Kingdom, according to the Ministry's trade intelligence portal. Comparing Indian exports against other supplier countries at the product and destination level can therefore reveal where competition is concentrated and where supplier diversification may be occurring.
India Export Product Analysis, India Product Export Data and Market Insights enables businesses to move from country-level trade statistics toward detailed product-market analysis.
A granular export dataset can contain:
The Department of Commerce's TradeStat platform provides commodity-wise, country-wise, commodity-country, and HS-code-level reporting, with data availability extending through 2026.
Why HS-code analysis matters
Suppose an exporter sells multiple product variants under one broad category. A category-level number can hide important differences.
An HS-level dataset can reveal:
Category → HS chapter → HS heading → HS code → destination → annual value → growth
This makes it easier to identify specific products with increasing international demand.
The evolution from 2020 to 2026 shows why granular product analysis is becoming more valuable. India's merchandise exports experienced a substantial rebound between FY2020–21 and FY2021–22, followed by another increase in FY2022–23 before moderating in FY2023–24. By FY2025–26, merchandise exports had reached US$441.78 billion. At the sector level, electronics provide a notable example of structural change: exports rose to US$38.6 billion in FY2024–25 from US$6.3 billion in FY2014–15. Pharmaceuticals also doubled over that longer period to US$30.5 billion. These movements demonstrate why businesses should not treat India's export basket as static. A manufacturer can use product-level historical data to identify categories where India's export footprint is expanding, then investigate destination-specific demand before allocating resources. For analysts, the combination of HS code, destination, value, quantity, and time-series data provides a much stronger basis for market selection than headline export totals alone.
India Export Opportunity Analysis helps businesses compare potential markets using measurable indicators rather than relying only on market size.
A practical opportunity model can examine:
Destination data provides useful signals
The Ministry of Commerce's 2025–26 annual report lists the United States as India's largest export destination during April–November 2025, with exports of US$58.99 billion, followed by the UAE at US$25.46 billion. The Netherlands recorded US$12.82 billion and China US$12.20 billion during the same period.
| Destination | Apr–Nov 2025 exports | YoY change |
|---|---|---|
| United States | US$58.99B | +11.28% |
| UAE | US$25.46B | +6.55% |
| Netherlands | US$12.82B | -22.34% |
| China | US$12.20B | +32.60% |
| United Kingdom | US$8.93B | -6.98% |
| Germany | US$7.47B | +9.34% |
Source: Ministry of Commerce, Annual Report 2025–26; April–November 2025 provisional data.
These numbers should be interpreted alongside individual product categories because country-wide export growth does not necessarily represent demand for every Indian product.
The period from 2020 to 2026 shows substantial variation across destinations and products. Global merchandise trade contracted in 2020 before recovering in 2021 and 2022, while India's own merchandise exports followed a strong recovery trajectory. More recently, destination-level data has shown differing patterns. During April–November 2025, Indian exports to the United States grew 11.28% year over year, while exports to China grew 32.60%; exports to the Netherlands and Singapore declined during the same period. This divergence illustrates why exporters should avoid treating "global demand" as one uniform market. An opportunity assessment should connect product-specific export performance with individual destination trends. For a manufacturer, a market with moderate total import growth could still be relevant if its particular HS code is expanding quickly. Conversely, a large destination may not be suitable for a specific product if India's share is declining or competitive intensity is increasing. By 2026, structured trade datasets allow businesses to screen many product-market combinations systematically before committing to distributor development or international expansion.
India Export Market Research gives exporters the evidence needed to validate a target destination before investing in market entry.
Market research should combine quantitative trade data with commercial context.
Key research questions
Data sources to combine
| Source | Insight |
|---|---|
| Indian export records | Existing India-market relationships |
| Import statistics | Total destination demand |
| HS-code datasets | Product specificity |
| Competitor shipment data | Supplier comparison |
| Tariff databases | Market-access conditions |
| Retail data | Consumer-facing demand |
| Search data | Digital demand signals |
| Marketplace data | Product availability |
| Company data | Competitor positioning |
The Department of Commerce's TradeStat system provides commodity-country and country-commodity reporting, allowing analysts to investigate these relationships systematically.
Market research has become more data-intensive as exporters have gained access to increasingly detailed trade datasets. India's official TradeStat system now provides historical data at commodity and country levels and has updated datasets extending into 2026. The broader trade picture also shows why current data should be combined with historical trends. Merchandise exports increased sharply from US$291.81 billion in FY2020–21 to US$451.07 billion in FY2022–23, before settling at US$437.70 billion in FY2024–25 and US$441.78 billion in FY2025–26. This sequence helps researchers distinguish recovery effects from longer-term structural growth. At the destination level, April–November 2025 figures show that growth varied substantially between countries, with China at +32.60%, the United States at +11.28%, Germany at +9.34%, and the Netherlands at -22.34%. Therefore, an export market research program should not rely on a static country ranking. It should evaluate product-specific growth, supplier competition, historical stability, market-access conditions, and recent changes together.
Share of search, India Product Export Data and Market Insights can help businesses connect international trade activity with digital consumer or buyer interest.
Trade data answers:
What is being exported and where?
Digital demand signals can help investigate:
What products or brands are being searched for and discussed?
This distinction matters particularly for consumer products.
Useful digital indicators
| Digital signal | Potential insight |
|---|---|
| Search volume | Product awareness |
| Search growth | Emerging interest |
| Marketplace visibility | Retail presence |
| Product reviews | Consumer response |
| Brand mentions | Competitive awareness |
| Category searches | Demand direction |
| Retail availability | Distribution presence |
| Price movements | Market positioning |
Digital signals should not replace customs or trade statistics. They should complement them.
For example, an exporter may discover rising search interest for a product category in a country. Trade data can then establish whether imports are actually increasing and whether Indian suppliers are participating in that growth.
From 2020 to 2026, the relationship between physical trade and digital demand became increasingly important as more product discovery and purchasing activity moved online. However, digital interest and import demand are not interchangeable metrics. India's merchandise export data shows that overall trade can move differently from individual product categories and destinations. FY2023–24 merchandise exports were US$437.07 billion, while FY2025–26 reached US$441.78 billion. At the same time, the Ministry's trade intelligence infrastructure now provides extensive product and destination coverage, making it possible to compare trade performance with other datasets. For exporters, the most useful approach is therefore triangulation: identify a digital demand signal, validate it against import and export statistics, examine competitive supply, and then assess pricing and distribution conditions. This methodology can reduce the risk of interpreting temporary online interest as durable commercial demand. By 2026, businesses can build market-screening models that combine trade data, search behavior, marketplace visibility, and competitor information to identify product-market combinations that merit deeper investigation.
Actowiz Metrics can help exporters, manufacturers, market researchers, and international brands convert large volumes of trade and digital commerce information into structured datasets for analysis.
Competitor intelligence
Competitor intelligence can be developed around product categories, destinations, brands, exporters, importers, prices, assortment, and digital visibility.
A structured intelligence workflow can include:
Actowiz Metrics can also support customized datasets based on a business's product categories, target countries, HS codes, competitors, and reporting frequency.
Building an export opportunity dashboard
A practical dashboard could contain:
| Dashboard layer | Example metric |
|---|---|
| Product | Export value by HS code |
| Country | Destination growth |
| Competition | Supplier share |
| Demand | Product search activity |
| Pricing | Average unit value |
| Market | Import growth |
| Trend | 3-year CAGR |
| Risk | Destination concentration |
| Opportunity | Product-country combinations |
| Monitoring | Monthly change |
This allows decision-makers to move from static reports toward continuously refreshed market intelligence.
India Product Export Data and Market Insights can therefore become part of a broader export intelligence workflow rather than a one-time research report.
Export-market selection works best when businesses evaluate several signals together.
A high-value product with declining destination demand requires a different strategy from a moderately sized product category experiencing sustained import growth.
The following framework can make the process more systematic:
India's export ecosystem is large and increasingly diversified. Merchandise exports reached US$441.78 billion in FY2025–26, while total merchandise and services exports were estimated at US$860.09 billion. Product categories such as electronics and pharmaceuticals have also expanded significantly over the longer term.
For exporters, however, the headline number is only the starting point. The actionable opportunity lies in understanding which product is growing, which destination is buying it, how competitors are performing, what prices are visible, and whether the trend is sustained.
Trade data can establish the commercial foundation. Destination analysis can reveal geographic opportunities. Competitor monitoring can expose supplier changes. Digital signals can add another layer of demand intelligence. Price & promotion intelligence can then help businesses understand how products are positioned in the target market.
The result is a more structured approach to international expansion—one that uses measurable product, country, competitor, pricing, and demand signals rather than relying exclusively on broad market assumptions.
Connect with Actowiz Metrics to build structured export datasets and turn India Product Export Data and Market Insights into actionable product-market intelligence for smarter international expansion!
Expert blogs, research reports and infographics — practical, data-driven reading across e-commerce and quick-commerce.
Most fields are optional — the more you share, the better your sample.

.webp "infographics")
.webp "infographics")