BLOG
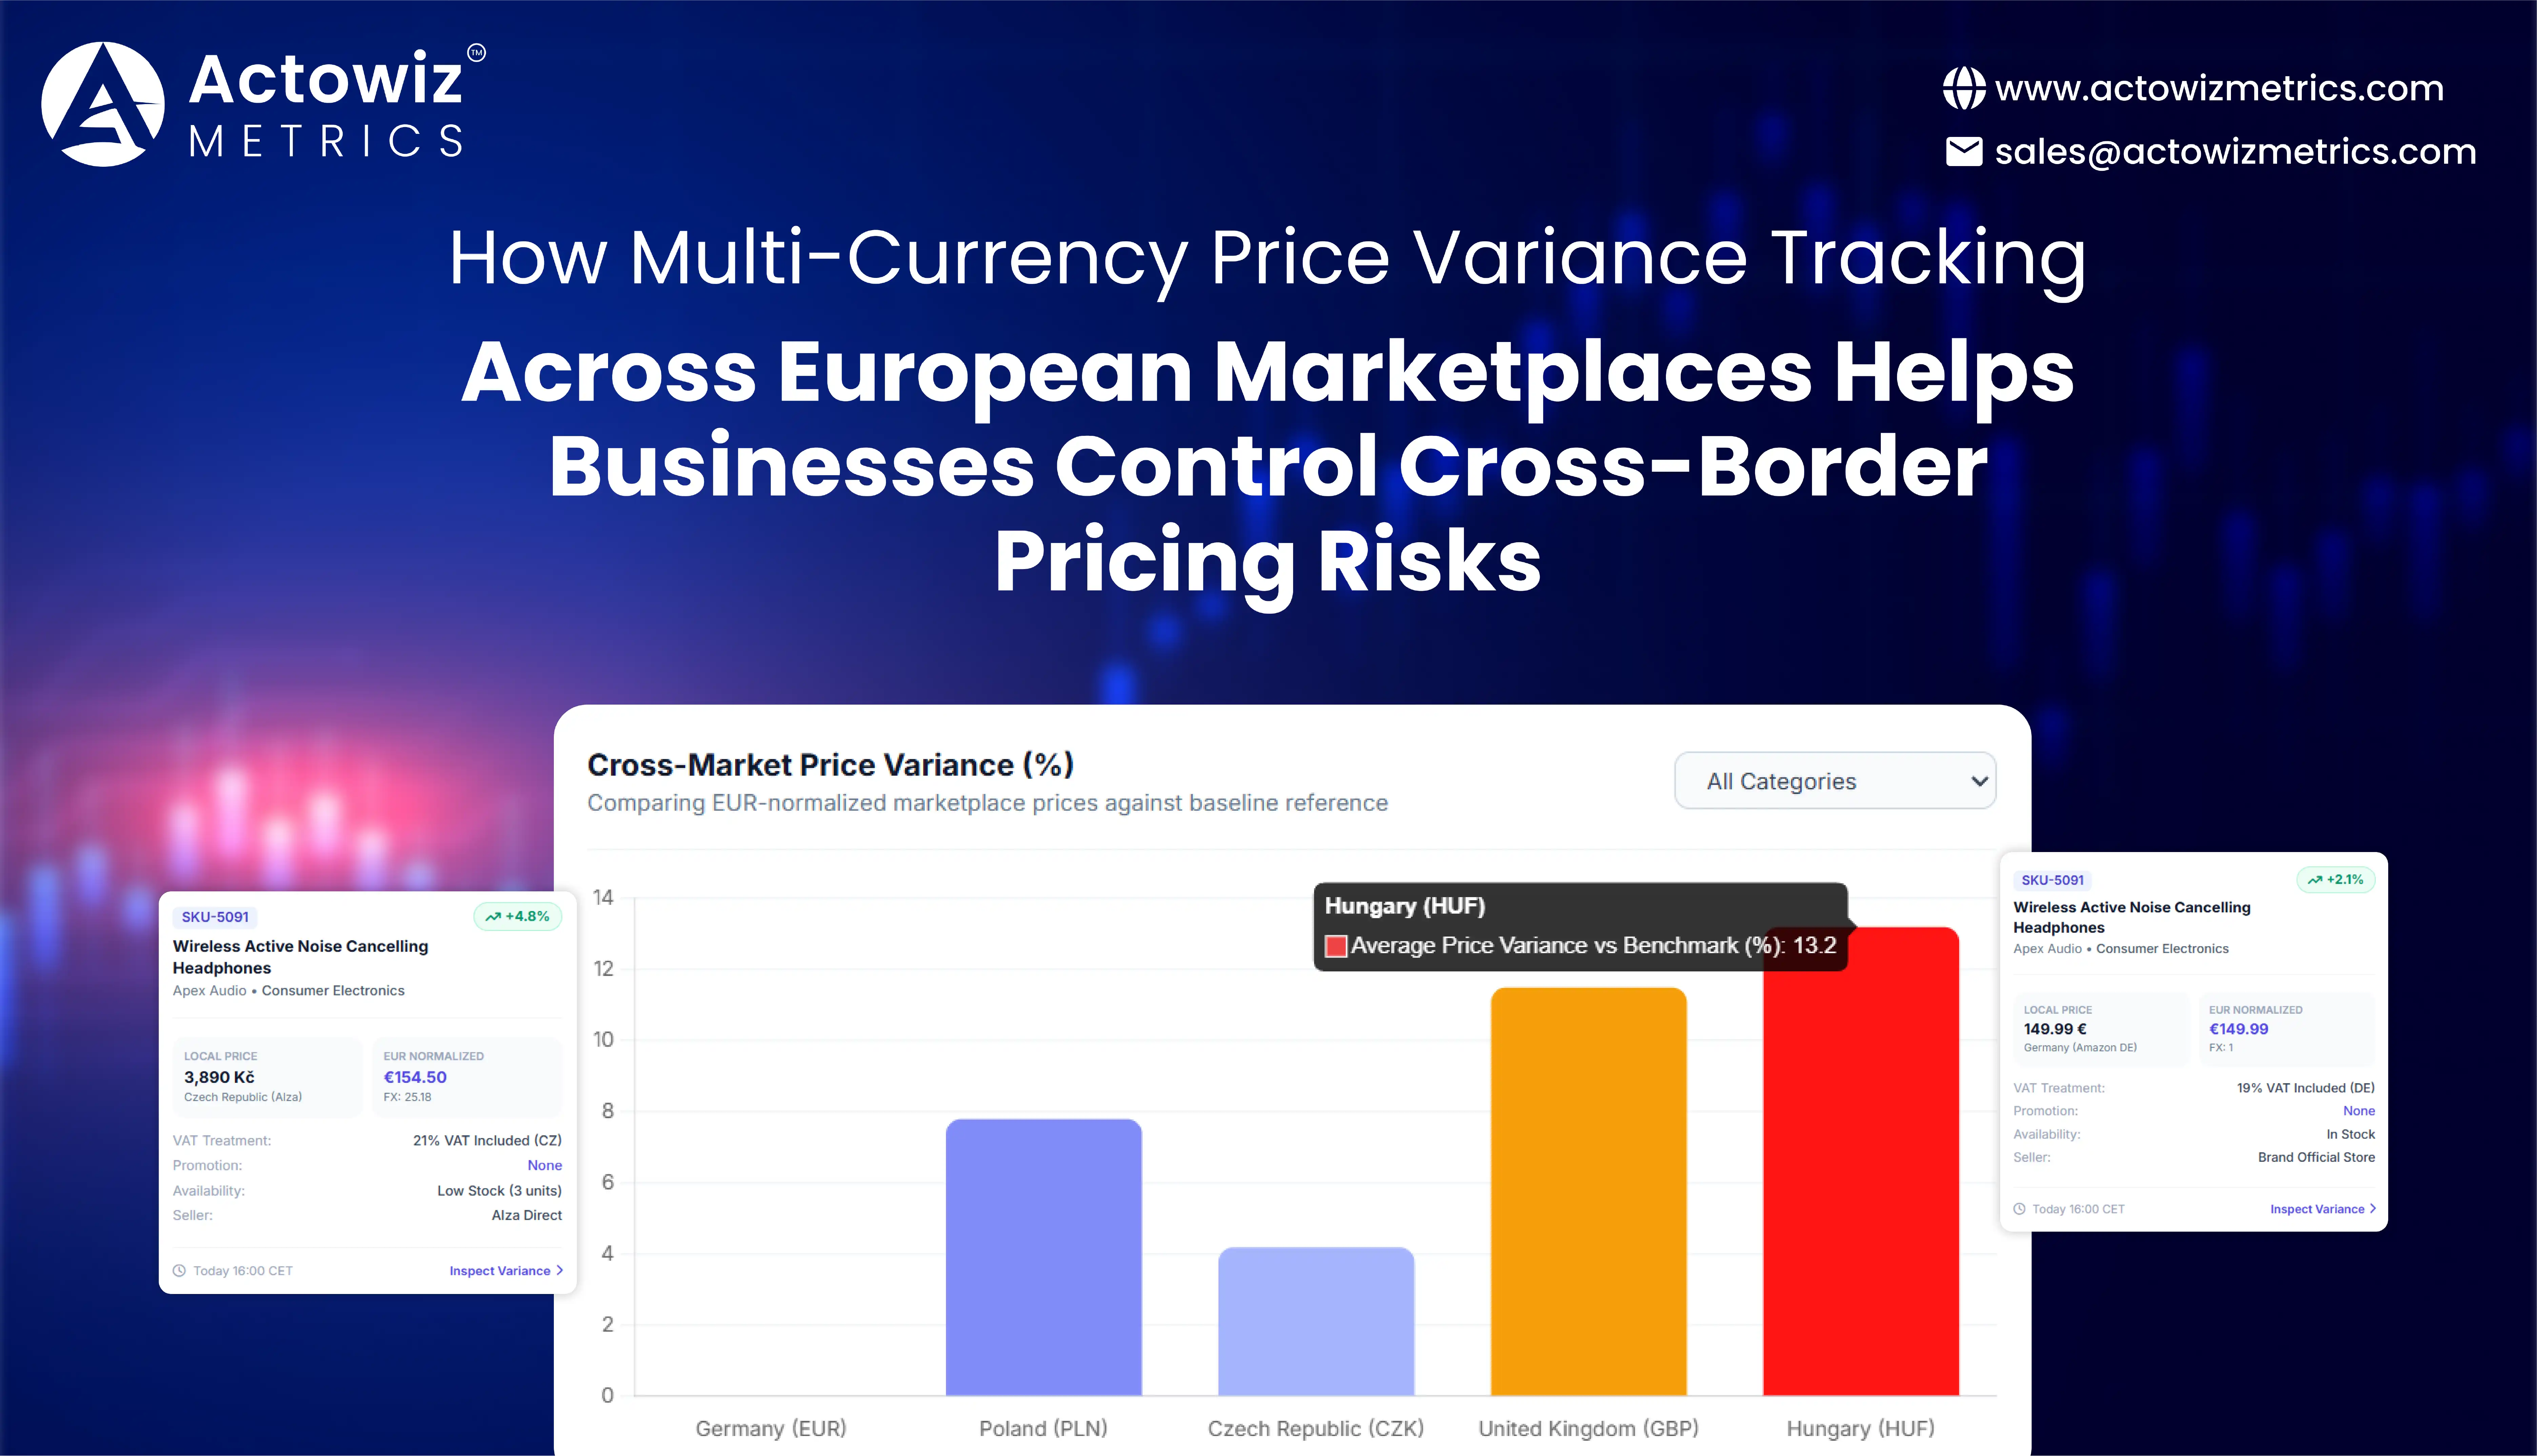




















Businesses selling across European marketplaces face a pricing problem that simple currency conversion cannot solve. The same product can show different local prices because of exchange-rate movements, VAT, marketplace fees, promotions, seller strategies, and country-specific pricing. Multi-Currency Price Variance Tracking Across European Marketplaces helps brands normalize these differences, identify meaningful price gaps, and distinguish genuine competitive changes from currency-driven movements.
Eurostat reported that 23.59% of EU enterprises conducted e-sales in 2024, up from 18.93% in 2014. E-commerce turnover generated by EU enterprises also reached 19.49% of total turnover in 2024. This expanding digital commerce environment makes cross-market pricing visibility increasingly important for manufacturers, retailers, marketplaces, distributors, pricing teams, and D2C brands.
The challenge becomes more complex because European markets do not all use the euro. The ECB publishes daily reference rates for 30 currencies, including GBP, CHF-related markets through applicable datasets, PLN, CZK, HUF, RON, DKK, and others. A €100-equivalent product can therefore appear materially different when viewed in GBP, PLN, CZK, HUF, or another local currency.
For pricing managers, the objective is not merely to convert every marketplace price into euros. It is to determine whether a price difference represents a genuine commercial opportunity, an exchange-rate effect, a tax difference, a promotion, or a marketplace-specific pricing decision.
Price & promotion intelligence provides the broader context needed to understand these movements and connect price changes with discounts, campaigns, assortment, and competitive positioning.
A European pricing dataset must account for more than product price. A meaningful comparison should capture product identity, local currency, exchange rate, VAT treatment, promotion status, seller, marketplace, availability, shipping charges, and timestamp.
The European Commission notes that VAT rates vary between EU Member States, while the standard VAT rate in each Member State is at least 15%. Consequently, comparing displayed consumer prices without considering tax treatment can produce misleading conclusions.
For example, a pricing team may see a product listed at different nominal prices in Germany, Poland, Denmark, and the Czech Republic. That difference could come from:
The correct approach is therefore to create a standardized price record for every marketplace observation.
| Data field | Purpose |
|---|---|
| Product ID / SKU | Match identical products |
| Brand | Identify manufacturer |
| Product title | Validate product identity |
| Marketplace | Identify selling channel |
| Country | Establish market context |
| Local price | Capture displayed price |
| Currency | Identify monetary unit |
| EUR-normalized price | Enable cross-market comparison |
| Exchange rate | Explain currency effect |
| Discount | Separate promotion from base price |
| VAT status | Improve price comparability |
| Availability | Explain potential pricing changes |
| Seller | Track seller-level differences |
| Timestamp | Preserve time-specific context |
This structure allows category managers and pricing analysts to separate nominal price variance from real commercial price variance.
European Marketplace Price Variance Monitoring Services can help pricing teams continuously compare identical products across multiple marketplaces and currencies. Instead of reviewing country-level prices manually, teams can create a normalized dataset that highlights where the largest differences occur.
What should businesses monitor?
A practical monitoring framework should include:
A simple variance calculation can be expressed as:
Price Variance % = [(Local-market equivalent price − Reference-market price) / Reference-market price] × 100
The reference market could be the company's home market, eurozone benchmark, MSRP, or another internally defined baseline.
| Indicator | Real-world data |
|---|---|
| EU enterprises making e-sales in 2014 | 18.93% |
| EU enterprises making e-sales in 2024 | 23.59% |
| EU e-sales share of enterprise turnover, 2024 | 19.49% |
| EU enterprises using websites/apps for e-sales, 2024 | 17.99% |
| EU enterprises using EDI-only sales, 2024 | 2.9% |
Source: Eurostat, e-commerce statistics based on 2025 enterprise survey data.
From 2020 to 2026, European cross-border e-commerce became increasingly shaped by digital marketplaces, mobile commerce, standardized tax processes, and greater availability of structured pricing information. The EU's VAT e-commerce package entered into force on 1 July 2021, changing the framework for cross-border B2C online sales and introducing the One Stop Shop mechanism. The European Commission says more than €125 billion in VAT has been collected through the EU's e-commerce VAT schemes since their introduction, with more than €38 billion collected in 2025 alone. At the same time, the ECB continues to publish daily reference rates, giving businesses a consistent reference point for multi-currency analysis. By 2026, the combination of growing digital sales, cross-border tax infrastructure, and daily currency data makes historical normalization increasingly important. Businesses can now evaluate whether an observed price difference is persistent or temporary rather than treating every local-currency gap as a competitive pricing signal.
Actionable insight
Set a variance threshold based on business requirements. A 2% difference may be operationally insignificant for one category but important for a low-margin consumer electronics portfolio. The threshold should therefore be category-specific rather than universally applied.
European Marketplace Price Data Scraping and Analysis enables businesses to transform fragmented marketplace listings into comparable pricing records.
A useful dataset should not simply collect prices. It should connect price observations with product attributes and market context.
| Dimension | Example analytical question |
|---|---|
| Country | Where is the product priced highest? |
| Currency | How much of the difference comes from FX? |
| Marketplace | Which channel has the largest variance? |
| Seller | Is the variance seller-specific? |
| Product | Are identical SKUs being compared? |
| Promotion | Is the gap caused by a temporary discount? |
| Availability | Does stock status correlate with changes? |
| Time | Is the difference persistent? |
This distinction is particularly important for retailers operating across multiple marketplaces. A product could appear cheaper in one market after conversion but actually have a similar pre-tax or post-tax price once all variables are normalized.
Why timestamping matters
Currency values change continuously. The ECB reference rates are normally updated on working days around 16:00 CET. Therefore, a marketplace price collected on Monday should not automatically be compared with a local-currency price collected several weeks later without considering FX movement.
A robust data pipeline should retain:
Between 2020 and 2026, marketplace pricing analysis moved from periodic manual checks toward continuous digital monitoring. The growth of e-sales across the EU provides a measurable basis for this shift: Eurostat reports that the share of enterprises conducting e-sales rose from 18.93% in 2014 to 23.59% in 2024. Regulatory changes also reduced some barriers to cross-border digital selling. The European Commission introduced the VAT One Stop Shop in July 2021 to simplify VAT reporting for eligible cross-border B2C transactions. These changes did not eliminate market-level pricing differences, but they increased the relevance of systematic monitoring. By 2026, pricing teams increasingly need datasets that combine product, seller, promotion, currency, and time dimensions. The result is a more defensible basis for identifying price gaps and separating commercial pricing decisions from external currency effects.
Actionable insight
Use SKU-level product matching before calculating price variance. Comparing similar titles without validating pack size, model number, quantity, or product configuration can create false competitive signals.
Multi-Currency Product Price Data Collection in Europe should begin with a standardized schema rather than with a list of websites.
For brands selling in multiple countries, the same product may have different:
A normalized data model makes these differences easier to analyze.
| Attribute | Germany | Poland | Czech Republic | United Kingdom |
|---|---|---|---|---|
| Local currency | EUR | PLN | CZK | GBP |
| Local price | Captured | Captured | Captured | Captured |
| FX rate | Recorded | Recorded | Recorded | Recorded |
| Reference price | EUR-normalized | EUR-normalized | EUR-normalized | EUR-normalized |
| Discount | Recorded | Recorded | Recorded | Recorded |
| Seller | Recorded | Recorded | Recorded | Recorded |
| Availability | Recorded | Recorded | Recorded | Recorded |
| Timestamp | Recorded | Recorded | Recorded | Recorded |
The actual prices should come from the monitored marketplace observations rather than from assumptions or hypothetical values.
Why product identity matters
Price variance is meaningful only when the products are genuinely comparable. Product matching should prioritize:
This prevents a 500-gram package from being incorrectly compared with a 1-kilogram package simply because the titles look similar.
From 2020 onward, the European online retail environment increasingly required businesses to manage product information across multiple digital channels. The 2021 EU VAT e-commerce reforms specifically addressed cross-border B2C sales and low-value imports, while the Commission established simplified mechanisms such as OSS and IOSS. By 2024, 23.59% of EU enterprises reported making e-sales, according to Eurostat. These developments created a stronger need for structured datasets that preserve both market and transaction context. From 2025 into 2026, the data requirement has become broader: businesses need product-level information linked with seller, marketplace, country, currency, tax context, promotion, and timestamp. A structured collection framework allows companies to maintain comparable records as marketplace coverage expands. It also creates a historical dataset that can be used to investigate whether pricing differences are temporary, recurring, or structurally associated with a particular market.
Actionable insight
Build one master product ID across countries. Then attach every country-specific listing to that identifier. This makes historical variance analysis substantially easier.
Businesses need to track price differences across European marketplaces in local currencies before converting those observations into a common reporting currency.
This two-layer approach is important.
Layer 1: Preserve the local price
The original marketplace price should always be stored exactly as displayed.
For example:
Layer 2: Normalize the comparison
The same observation can then be converted into EUR or another reporting currency using a clearly documented exchange-rate source. The ECB's reference-rate dataset provides daily rates against the euro for multiple currencies and makes historical time-series data available.
| Factor | What it explains |
|---|---|
| FX movement | Currency-driven price change |
| Base price | Seller or retailer pricing decision |
| VAT | Tax-related consumer price difference |
| Promotion | Temporary discount |
| Shipping | Delivery-related cost |
| Marketplace fee | Channel economics |
| Seller | Seller-specific pricing |
| Product variant | Product-level difference |
| Availability | Potential supply-related movement |
This approach helps pricing teams avoid interpreting a currency movement as a competitor pricing decision.
Currency normalization became particularly relevant as European businesses expanded their digital reach across countries with different currencies. The ECB's reference-rate system provides daily observations and historical exchange-rate data, supporting consistent time-series comparisons. Meanwhile, the European Commission confirms that VAT rates vary among Member States, creating another layer that must be considered when comparing consumer-facing prices. Since the 2021 VAT e-commerce reforms, cross-border B2C transactions have operated under a more standardized EU framework through mechanisms such as OSS, but country-level tax rates and commercial pricing remain relevant. In 2026, businesses therefore have access to stronger infrastructure for cross-market comparison, but the analytical requirement remains: preserve the local price, document the exchange rate, and separate currency-driven changes from actual marketplace pricing decisions.
Actionable insight
Never overwrite the original local-currency price after conversion. Store both values so analysts can reproduce the calculation later.
European Marketplace Multi-Currency Price Monitoring should operate as a recurring data process rather than a one-time spreadsheet exercise.
A monitoring system can establish daily, weekly, or category-specific collection schedules depending on how frequently prices change.
| KPI | Business use |
|---|---|
| Average price variance | Identify broad market gaps |
| Median price variance | Reduce impact of outliers |
| Maximum variance | Detect extreme differences |
| FX-adjusted variance | Isolate commercial pricing |
| Promotion frequency | Track discount intensity |
| Price-change frequency | Measure market volatility |
| Availability rate | Contextualize price changes |
| Seller count | Measure marketplace competition |
| Country coverage | Evaluate monitoring completeness |
| SKU coverage | Track data completeness |
A dashboard can also flag:
The 2020–2026 period has seen stronger institutional support for cross-border digital commerce within the EU. The VAT e-commerce package took effect on 1 July 2021, with the Commission stating that the rules were intended to reduce barriers to cross-border online sales. By September 2026, the European Commission reported that more than €125 billion had been collected through the EU's e-commerce VAT schemes since implementation, including more than €38 billion in 2025. At the same time, Eurostat's 2024 data shows that nearly one in four EU enterprises conducted e-sales. These developments reinforce the value of continuous monitoring because pricing environments are no longer isolated by national borders. Marketplace teams must evaluate multiple countries, sellers, currencies, and promotional cycles simultaneously. A recurring dataset gives businesses a historical baseline that supports anomaly detection, category-level analysis, and investigation of persistent price differences.
Actionable insight
Create separate alerts for absolute variance and percentage variance. A €10 difference can be significant for a €50 product but relatively small for a €1,000 product.
Digital shelf analytics can extend price variance monitoring beyond a single pricing metric by connecting price with availability, assortment, visibility, seller presence, promotions, and product positioning.
When combined with Multi-Currency Price Variance Tracking Across European Marketplaces, businesses can create a broader view of digital shelf performance across countries.
| Digital shelf signal | Pricing question |
|---|---|
| Product price | Is the market priced above or below benchmark? |
| Discount | Is the variance promotion-driven? |
| Availability | Is stock status affecting pricing? |
| Search visibility | Is the product easily discoverable? |
| Seller count | How competitive is the listing? |
| Ratings | Does product reputation differ by market? |
| Reviews | Are customer responses changing? |
| Assortment | Is the same range available everywhere? |
This is particularly useful for D2C brands and manufacturers that need to understand not only what competitors charge but also how their products are positioned.
Between 2020 and 2026, digital commerce intelligence increasingly expanded beyond price tracking toward broader digital shelf measurement. Eurostat's 2024 statistics show that websites and apps remained a major channel for EU e-sales, with 17.99% of EU enterprises using websites or apps for e-sales and 2.9% using EDI-only sales. At the same time, cross-border selling has been supported by EU VAT simplification measures introduced in 2021. These trends mean that brands increasingly need a unified view of price, assortment, availability, and promotional positioning. Currency adds another analytical layer because the same commercial strategy can look different when expressed in local currencies. The ECB continues to provide daily reference-rate information and historical datasets, allowing analysts to incorporate FX movements into time-series models. In 2026, the practical objective is therefore to connect pricing data with broader digital shelf signals rather than treating price as an isolated metric.
Actionable insight
Connect price alerts with availability and promotion fields. A sudden price increase combined with an out-of-stock event should be interpreted differently from a price increase occurring during a competitor promotion.
European pricing teams need more than raw marketplace listings. They need structured, normalized, validated, and recurring data that can support pricing decisions across countries and currencies.
Actowiz Metrics can support E-commerce & D2C analytics by organizing marketplace data around product, country, seller, currency, price, promotion, availability, and timestamp dimensions.
A practical workflow can include:
1. Multi-market source identification
Relevant marketplaces and country-specific storefronts can be mapped according to the business's category, geography, and competitive landscape.
2. Product matching
Products can be matched using available identifiers such as SKU, GTIN, EAN, manufacturer part number, brand, model, and variant information.
3. Local-currency collection
Original prices can be retained in the currency displayed by each marketplace before normalization.
4. Currency normalization
Exchange-rate data can be incorporated into a standardized reporting currency while preserving the original local-currency observation.
5. Price variance calculation
Normalized records can be used to calculate country-to-country price gaps, benchmark deviations, and historical changes.
6. Promotion and availability context
Discounts, promotional labels, seller information, and availability can be connected to price observations so analysts can understand why a variance occurred.
7. Recurring monitoring
Scheduled collection can create a historical dataset for trend analysis, alerts, benchmarking, and reporting.
The European Commission confirms that VAT rules differ across Member States and provides country-specific VAT information through its official tax resources. Combining that tax context with product and pricing data can make cross-market comparisons more meaningful.
For a pricing leader, category manager, marketplace manager, or D2C analytics team, the key advantage is a repeatable dataset that transforms fragmented marketplace observations into structured commercial intelligence.
Cross-border pricing risk comes from treating European marketplace prices as directly comparable when they are influenced by currencies, taxes, promotions, sellers, product configurations, and local market conditions. Multi-Currency Price Variance Tracking Across European Marketplaces gives businesses a structured way to preserve local prices, normalize currencies, calculate meaningful variance, and connect price movements with broader marketplace signals.
The most reliable approach is to:
The growth of European e-commerce makes this increasingly relevant. Eurostat reported that 23.59% of EU enterprises conducted e-sales in 2024, while the European Commission reported more than €125 billion in VAT collected through EU e-commerce schemes since 2021.
Build a reliable cross-border pricing intelligence pipeline with Actowiz Metrics to monitor European marketplace prices, normalize currencies, identify meaningful price variance, and strengthen pricing decisions with structured data!
Expert blogs, research reports and infographics — practical, data-driven reading across e-commerce and quick-commerce.
Most fields are optional — the more you share, the better your sample.
.webp "infographics")
.webp "infographics")