BLOG


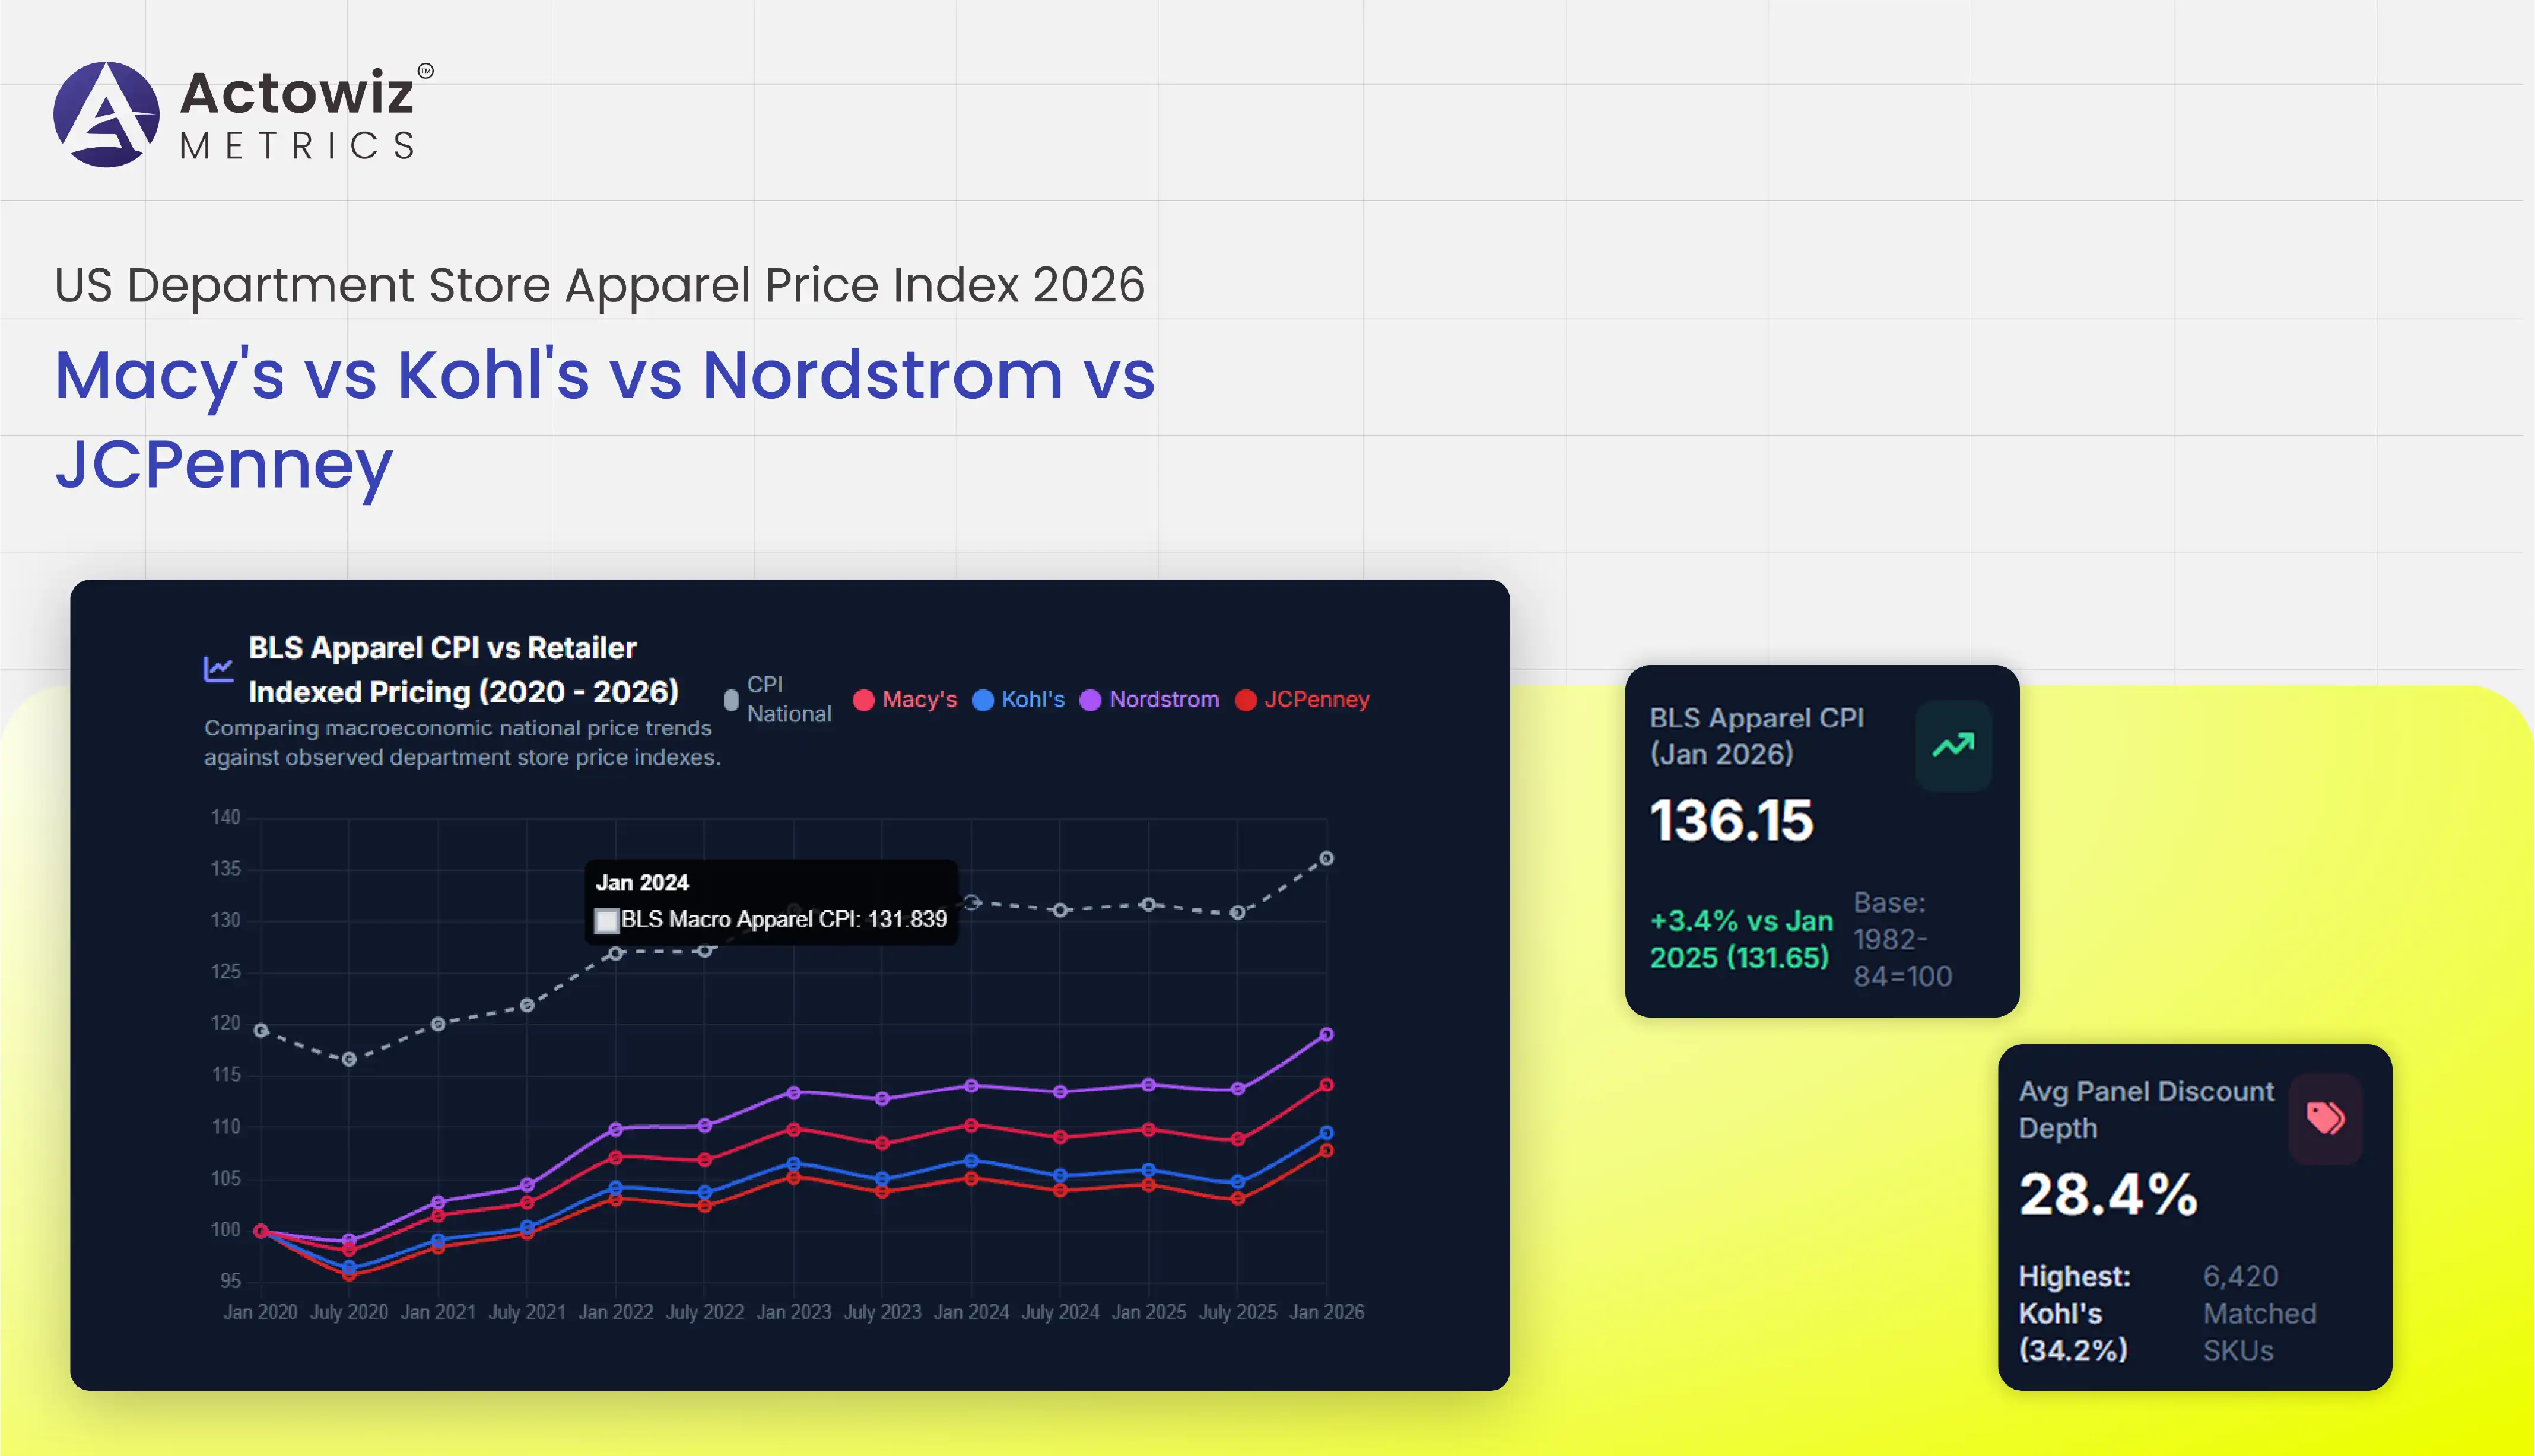
The 2026 US department store apparel price index should compare product prices, promotional discounts, category assortments, and price changes across Macy's, Kohl's, Nordstrom, and JCPenney using consistent product-matching rules. For retailers, apparel brands, and pricing teams, US scrape department store prices can support structured competitive monitoring, while Fashion & apparel analytics helps turn observed product and pricing data into actionable decisions. A reliable index must distinguish listed prices from sale prices, compare equivalent products, and account for differences in brand mix and product availability.
A key limitation is that these retailers do not publish a single, directly comparable apparel price index covering all four businesses. A defensible 2026 comparison therefore requires dated observations of comparable products and transparent methodology. Public company filings and government statistics provide context for retail performance and inflation, but they should not be mistaken for a direct measurement of these four retailers' current apparel prices.
The most important baseline is the US Bureau of Labor Statistics (BLS) Consumer Price Index (CPI) for apparel. It measures consumer price changes across the wider market, not the specific prices charged by Macy's, Kohl's, Nordstrom, or JCPenney. That distinction matters: an apparel CPI increase does not prove that any individual retailer raised prices, and a retailer's discount does not necessarily mean its overall assortment became cheaper.
The BLS apparel index, available through the Federal Reserve Bank of St. Louis, provides a consistent historical reference for the analysis. The observations below are semiannual index values, not prices in dollars. The base period is 1982–1984 = 100.
| Year | January apparel CPI | July apparel CPI | Interpretation |
|---|---|---|---|
| 2020 | 119.469 | 116.688 | The index declined between the two observations |
| 2021 | 120.077 | 121.909 | The index increased across the observations |
| 2022 | 126.930 | 127.231 | The index remained above 2021 levels |
| 2023 | 131.113 | 130.044 | The July reading was below January |
| 2024 | 131.839 | 131.127 | The July reading was below January |
| 2025 | 131.655 | 130.898 | The July reading was below January |
| 2026 | 136.150 | Not listed in this series extract | January reading only; not a full-year result |
Source: FRED — BLS Consumer Price Index for Apparel. The latest available observation should be rechecked before publication because government series can be revised or updated.
The 2026 January observation is higher than the 2025 January observation, but a single index reading cannot establish a full-year trend. For department store buyers, the practical implication is to track the national baseline alongside retailer-specific prices, rather than treating macroeconomic inflation as a substitute for competitive data. The four-store comparison should be built from matched items and dated observations, with clear separation between regular price, promotional price, and product availability.
A meaningful Macy's vs Kohl's vs Nordstrom vs JCPenney apparel price index needs to compare equivalent products, not simply average every listed item on each website. The retailers carry different brand portfolios, styles, quality tiers, and category mixes. A raw average could therefore make one retailer look more expensive simply because it lists more premium merchandise.
A structured US scrape department store prices workflow can capture product title, brand, category, SKU or product identifier, color, size, listed price, sale price, promotion text, availability, and observation timestamp where these fields are publicly available and collection is authorized. Matching should prioritize identical SKUs or GTINs. If those identifiers are unavailable, matching can use brand, product name, style, material, fit, and other attributes, with confidence levels recorded for each match.
| Index component | Recommended measurement | Why it matters |
|---|---|---|
| Regular price | Current displayed non-promotional price | Establishes a reference point |
| Promotional price | Displayed sale price | Captures the price customers may pay before additional conditions |
| Discount rate | (Regular price − sale price) ÷ regular price × 100 | Makes discount depth comparable |
| Matched-item price gap | Retailer price minus comparison retailer price | Identifies relative price differences |
| Availability | In stock, unavailable, or not displayed | Prevents missing products from being misread as price changes |
| Match confidence | Exact identifier or attribute-based match | Makes comparisons more defensible |
This framework avoids publishing an unsupported winner. No verified, standardized four-retailer apparel basket is provided here, so this report does not claim that any one retailer is definitively the cheapest in 2026. A buyer should begin with a fixed basket of comparable essentials—such as jeans, basic shirts, dresses, sweaters, and outerwear—then calculate results by category and by retailer. The basket, weighting method, and observation schedule should remain consistent between reporting periods.
The US apparel price index for department stores should be understood as a retailer-level measure created from comparable products, not as another name for the national CPI. The BLS CPI tracks price movements across a broad set of consumer purchases and uses its own sampling and weighting methodology. It does not rank the four named department stores, report their promotional depth, or show which retailer offers the lowest price for a specific garment.
For a business-facing index, the baseline should be separated into two layers. The first is the national market context: apparel CPI observations and broader retail sales trends. The second is the retailer-specific panel: the same products observed across the four websites over time. The Census Bureau's clothing and clothing-accessories store sales series, available through FRED, is useful for understanding sector-level sales conditions, but it measures sales rather than the prices of individual garments.
| Year | Apparel CPI reference observation | What analysts can conclude |
|---|---|---|
| 2020 | 119.469 in January; 116.688 in July | The two observations differ; this alone does not explain the cause |
| 2021 | 120.077 in January; 121.909 in July | The index was higher in July than January |
| 2022 | 126.930 in January; 127.231 in July | Both observations were higher than the corresponding 2021 readings |
| 2023 | 131.113 in January; 130.044 in July | The July index was lower than January |
| 2024 | 131.839 in January; 131.127 in July | The July index was lower than January |
| 2025 | 131.655 in January; 130.898 in July | The July index was lower than January |
| 2026 | 136.150 in January | Only the January observation is shown here |
Source: FRED apparel CPI data. These are semiannual index observations, not annual averages or retailer prices.
To make the retailer index useful, analysts should report a fixed-basket index alongside the median observed price, average discount, and share of matched items with a price change. These measures answer different questions. A basket index tracks movement over time; a median price reduces the influence of unusually expensive items; discount depth reveals promotional intensity. Reporting all three makes the findings more interpretable for category managers, merchandising teams, and pricing leaders.
A practical Macy's vs Kohl's vs Nordstrom vs JCPenney apparel price comparison US should separate like-for-like price differences from differences in brand positioning and assortment. For example, a premium designer dress should not be compared directly with a private-label casual dress solely because both products are categorized as dresses. The product's brand, construction, material, style, and intended use can materially affect the comparison.
A repeatable US scrape department store prices process can support this analysis by collecting authorized, publicly displayed product information at scheduled intervals. Product matching should be completed before calculating price gaps. If the same item appears at multiple retailers, analysts can calculate the dollar difference and percentage difference relative to a clearly identified reference retailer. If no exact match exists, the item should be reported separately rather than forced into a comparison.
| Comparison dimension | Recommended approach | Business question answered |
|---|---|---|
| Same-item pricing | Match identical product identifiers | Which retailer lists the same item at a lower price? |
| Category pricing | Compare comparable products within each category | Where are price differences most pronounced? |
| Promotion depth | Compare regular and displayed sale prices | Which retailer is offering deeper advertised discounts? |
| Brand availability | Track matched brands and available products | Is the difference driven by price or assortment? |
| Price consistency | Repeat observations over a defined period | Is a price gap persistent or temporary? |
| Size availability | Record available sizes when displayed | Are price comparisons affected by limited stock? |
The comparison should not assume that the four retailers have identical business models. JCPenney, for example, identifies private and national brands in its official company information, and its website lists a broad range of apparel categories and brands. These are relevant assortment factors that can affect the composition of a price basket.
For brands, the strongest output is a category-level comparison that highlights where the same product is consistently more expensive, where promotions narrow the gap, and where missing inventory makes the comparison unreliable. Results should include the observation date and matching confidence. Without a verified, dated product panel, retailer-specific rankings should remain unreported.
US department store apparel assortment and pricing intelligence for brands combines product availability, category coverage, displayed pricing, promotions, and brand representation into one decision-making framework. It helps apparel manufacturers and brand managers understand how their products are presented across retail partners and whether competitive products are positioned at comparable price points.
The first step is to map each retailer's visible assortment into consistent categories. Useful groupings include women's tops, dresses, denim, trousers, men's shirts, suits, children's apparel, activewear, knitwear, and outerwear. The categories should be aligned across retailers, while retailer-specific labels are preserved in the source record. This reduces the risk of comparing dissimilar items or losing useful detail during standardization.
Official retailer pages are useful for confirming the breadth of categories and brands. JCPenney's site map, for example, lists women's categories such as tops, dresses, pants, jeans, coats and jackets, and activewear, alongside men's clothing categories. Its brand directory also lists national and private brands. These pages demonstrate why assortment context matters when constructing a competitive basket.
| Intelligence field | How brands can use it | Validation requirement |
|---|---|---|
| Brand and product count | Monitor visible assortment coverage | Deduplicate product variants |
| Category placement | Identify where products appear in the retail taxonomy | Preserve original category labels |
| Listed price | Compare advertised price positioning | Capture currency and observation date |
| Sale price | Track displayed promotional pricing | Retain the original price and conditions |
| Product availability | Monitor whether items are currently offered | Distinguish unavailable items from collection failures |
| Product attributes | Match comparable competing products | Use consistent attribute definitions |
These records can help a brand identify potential pricing inconsistencies, gaps in category representation, and changes in retail partner assortment. They cannot, by themselves, prove why a retailer changed a price or whether a brand's sales increased. Those conclusions require additional evidence, such as internal sales data, campaign records, or retailer-confirmed information.
A useful reporting cadence is weekly monitoring for rapidly changing promotions and a monthly summary for category and assortment trends. The schedule should be adjusted to the product category, collection permissions, and actual rate of change rather than assumed to be equally valuable for every item.
Price & promotion intelligence helps retail teams understand how advertised discounts vary across retailers, products, and dates. It should distinguish a displayed markdown from a change in the underlying regular price and should preserve the conditions attached to a promotion. A percentage-off label, for example, is not sufficient evidence of the final price a customer will pay if additional eligibility requirements apply.
With US scrape department store prices, analysts can build a dated record of regular prices, displayed sale prices, promotion labels, and product availability, where those details are accessible and collection is authorized. The record should retain the source URL and capture timestamp so that changes can be traced back to the original observation. Price comparisons should also account for exclusions, coupon requirements, loyalty-member conditions, and other terms where they are displayed.
| Promotion measure | Calculation or rule | How to interpret it |
|---|---|---|
| Displayed discount percentage | (Regular price − sale price) ÷ regular price × 100 | Measures the advertised reduction when both prices are valid |
| Price movement | Current displayed price − previous displayed price | Shows the direction and size of an observed change |
| Promotion frequency | Number of observations showing a promotion ÷ valid observations | Indicates how frequently promotions were observed during the study period |
| Price persistence | Number of consecutive observations at the same price | Helps distinguish brief changes from sustained pricing |
| Promotion availability | Percentage of matched items with a displayed promotion | Shows how widely promotions appear across the matched basket |
| Stock-adjusted coverage | Matched products available for comparison ÷ expected matched products | Makes missing or unavailable products visible in the analysis |
The national apparel CPI provides context for overall consumer price movements, while retailer-specific observations reveal advertised prices and promotional activity at the product level. These datasets answer different questions and should not be combined as if they were interchangeable.
For actionable reporting, promotion alerts should be based on explicit thresholds chosen by the business. For example, a pricing team may choose to review a substantial price reduction on a key matched item or investigate a sudden increase in promotional coverage. Such thresholds are internal rules, not market facts, and should be calibrated using the company's historical data.
The objective is not to identify the retailer with the largest advertised discount on a single day. It is to understand whether price positioning is changing consistently, whether the same items remain comparable, and whether the observed promotion is relevant to the customer segment being targeted.
Digital shelf analytics examines how products appear across online retail environments, including their displayed prices, product information, availability, category placement, and promotional presentation. For apparel brands and retailers, it provides a structured view of online product execution rather than focusing exclusively on price.
The first requirement is reliable product identity. A matching system should distinguish different colors, sizes, cuts, and product versions when those differences affect comparability. It should also preserve retailer-specific product identifiers and URLs. When the same product is listed under different titles, attribute-based matching may be useful, but uncertain matches should be flagged for review rather than automatically treated as exact equivalents.
A second requirement is data quality. Each record should carry a timestamp, source reference, collection status, and validation result. Duplicate products, missing prices, inconsistent currencies, and sudden changes in product identifiers should be reviewed before the data enters a reporting dashboard. A missing price should not automatically be interpreted as a price increase, a discontinued item, or a stockout.
| Digital shelf indicator | Suggested reporting view | Recommended action |
|---|---|---|
| Product match rate | Percentage of expected products successfully matched | Review missing identifiers and matching rules |
| Price completeness | Percentage of matched records with valid prices | Investigate collection gaps |
| Availability coverage | Percentage of matched items with a clear availability state | Separate unavailable products from unknown status |
| Content completeness | Presence of relevant titles, brands, descriptions, and attributes | Prioritize corrections to incomplete product records |
| Price change alerts | Items exceeding a defined change threshold | Validate the source record before acting |
| Category coverage | Matched products by retailer and category | Identify assortment gaps and improve basket balance |
These indicators are proposed operational measures, not claimed performance results for the four retailers. The baseline should be measured during implementation and reviewed periodically. Teams should also ensure that collection methods comply with applicable laws, website terms, and access restrictions.
For decision-makers, the value of a digital shelf program is the ability to connect an observed issue with a specific product and source record. A merchandising team can investigate a category gap, a brand manager can review a product's displayed positioning, and a pricing analyst can verify a competitive price change without relying on a manually assembled snapshot. The system should support human review for ambiguous matches and high-impact decisions.
Actowiz Metrics can help brands, retailers, and market intelligence teams design a structured retail monitoring workflow around their business questions. For a department store apparel study, that means defining a comparable product basket, setting a consistent collection schedule, standardizing product attributes, and building reporting views that separate verified observations from uncertain matches.
A useful US scrape department store prices solution should focus on the quality and usability of the resulting data, not simply the volume of collected records. Buyers should be able to see the observation date, source, listed price, promotional price when available, and match status. Those details make the output easier to validate and safer to use in pricing discussions.
A practical engagement can include:
The scope and deliverables should be agreed in advance, including retailer coverage, product categories, refresh frequency, historical requirements, and reporting formats. Any claimed improvements in pricing accuracy, revenue, or operational efficiency should be measured against an agreed baseline rather than assumed before implementation.
A credible 2026 comparison of Macy's, Kohl's, Nordstrom, and JCPenney should combine national apparel inflation context with a retailer-specific, matched-product dataset. The BLS apparel CPI offers a public macroeconomic reference, but it cannot establish which of the four retailers is cheapest. That conclusion requires dated observations of comparable products, clear treatment of discounts, and transparent calculations.
For apparel brands and retail decision-makers, the best starting point is a fixed basket of comparable products across key categories, supported by consistent matching, price-history records, availability checks, and documented data-quality rules. Results should report what was observed, when it was observed, and where matching uncertainty remains.
A structured US scrape department store prices program can help turn scattered online product listings into a repeatable competitive intelligence process—provided the data is collected appropriately and interpreted within its limits.
Ready to build a reliable department store apparel price index? Contact Actowiz Metrics to discuss a tailored retail price monitoring and apparel intelligence solution for your target retailers, categories, and reporting needs!
Expert blogs, research reports and infographics — practical, data-driven reading across e-commerce and quick-commerce.
Most fields are optional — the more you share, the better your sample.
.webp "infographics")
.webp "infographics")