BLOG
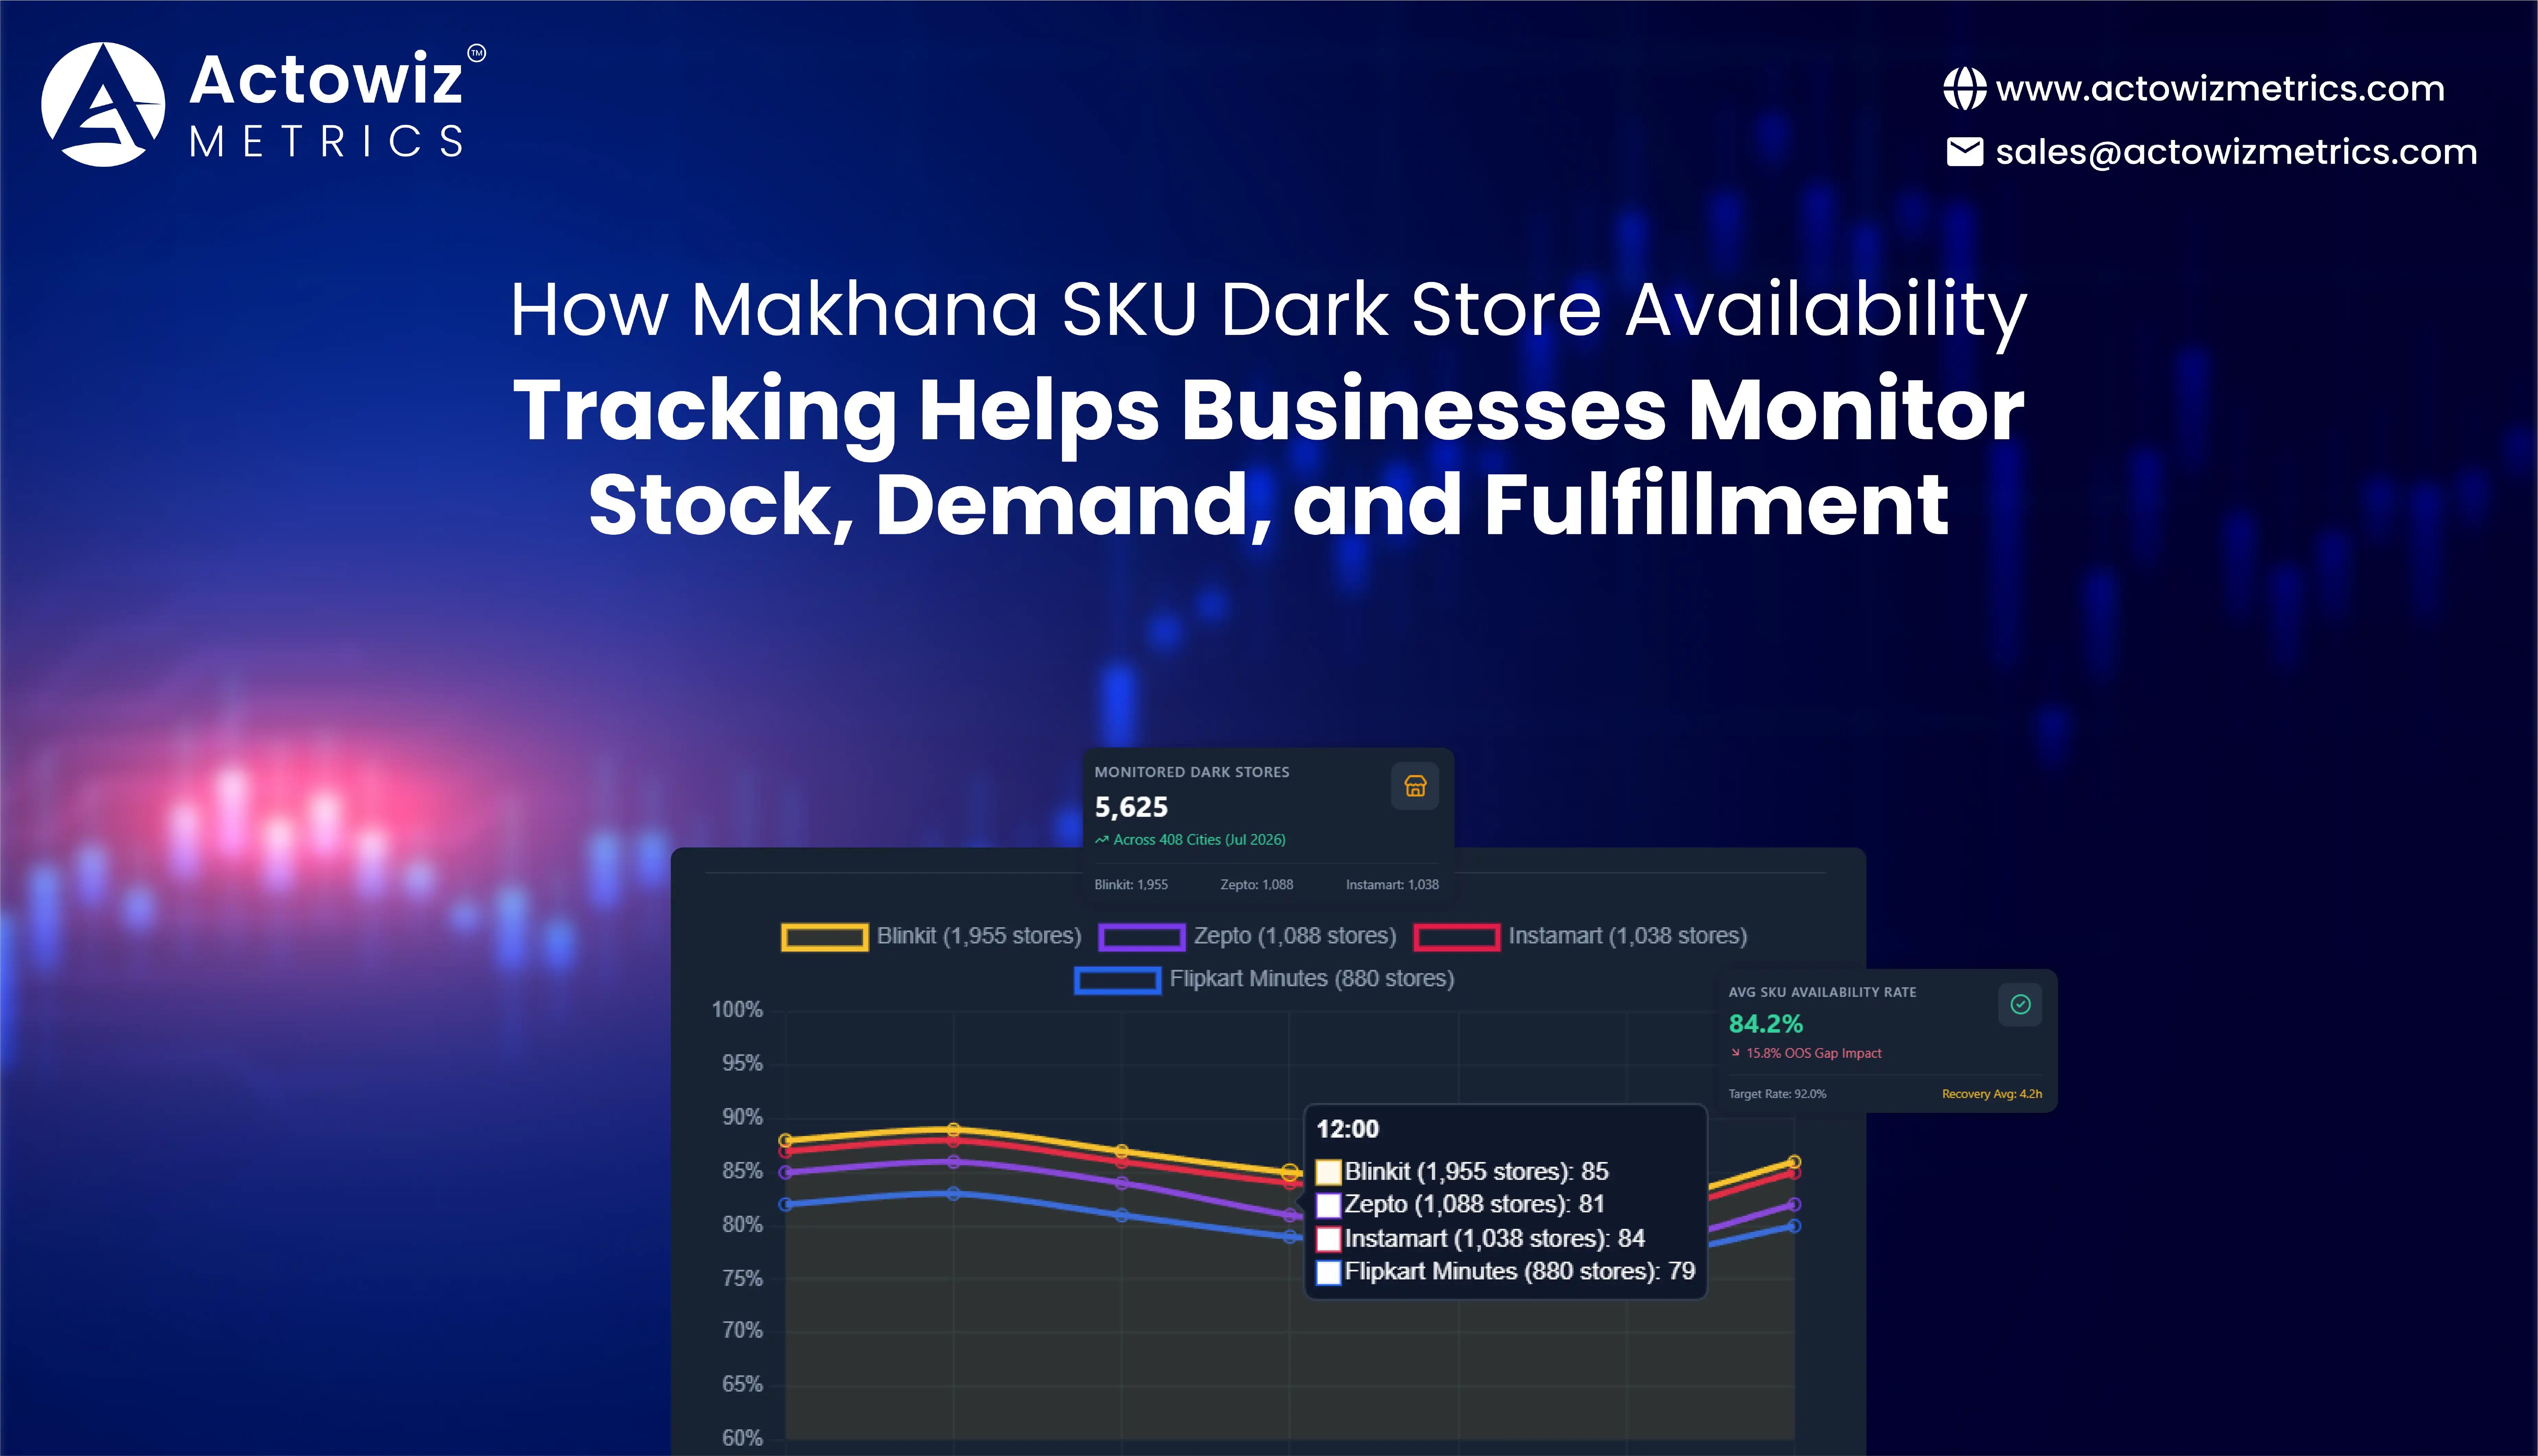


Makhana SKU Dark Store Availability Tracking helps brands identify where individual makhana SKUs are available, unavailable, newly listed, or repeatedly going out of stock across quick-commerce dark stores. For FMCG manufacturers, distributors, and category managers, this turns fragmented marketplace observations into actionable inventory and fulfillment intelligence.
The opportunity is growing alongside both categories. According to APEDA's December 2025 market intelligence dashboard, India produces approximately 0.6 lakh metric tonnes of makhana annually, with around 40% estimated to be exported and 60% consumed domestically. APEDA also reports that the market has grown at approximately 17-18% annually since 2021-22 through 2024-25.
At the same time, India's quick-commerce infrastructure has expanded rapidly. An independent July 2026 mapping study identified 5,625 dark stores across Blinkit, Zepto, Swiggy Instamart, Flipkart Minutes, and BigBasket, spanning 408 cities and 26 states.
This creates a specific challenge for makhana brands: a product can be nationally available but unavailable to consumers in a particular neighborhood. Therefore, national inventory reports alone are insufficient. Brands need SKU-level, location-level visibility that connects stock availability with price, promotions, assortment, and demand signals.
Dark-Store Stockout Tracking for Quick Commerce provides this additional layer by identifying repeated availability gaps, platform differences, geographic stockouts, and competitor substitution opportunities.
Makhana Dark Store Inventory Tracking helps brands move beyond warehouse-level inventory reporting and understand what consumers can actually purchase from individual quick-commerce locations. A brand may have sufficient inventory at a regional warehouse while its 60-gram roasted makhana SKU is unavailable across several high-demand dark stores.
That difference matters because quick commerce is built around proximity. The consumer typically sees the inventory available for a nearby fulfillment location rather than the manufacturer's total inventory position.
Makhana SKU Dark Store Availability Tracking can therefore monitor each SKU across selected cities, stores, platforms, and time intervals.
| Data Point | What It Reveals |
|---|---|
| SKU name | Exact product being monitored |
| Brand | Competitive brand presence |
| Pack size | Enables like-for-like comparison |
| Flavors/variant | Identifies assortment differences |
| Selling price | Current consumer price |
| Discount | Promotional intensity |
| Availability | In-stock/out-of-stock condition |
| Dark store/location | Geographic inventory visibility |
| Platform | Cross-platform availability |
| Rating/reviews | Consumer response signal |
| Timestamp | Historical availability tracking |
A useful system should retain every observation rather than overwriting previous records. This makes it possible to calculate availability rates, stockout frequency, average stockout duration, and store-level consistency.
The 2020-2026 period is important because both makhana and quick commerce developed substantially during this timeframe. APEDA's 2025 makhana dashboard states that the Indian market has grown at approximately 17-18% annually since 2021-22 through 2024-25, supported by health awareness, premiumization, and the expansion of branded players. Meanwhile, quick commerce shifted from a relatively concentrated urban delivery model to a much larger dark-store network. A 2025 JM Financial industry report estimated approximately 1,544 Blinkit dark stores, 1,000-1,100 Zepto stores, 1,082 Instamart stores, and roughly 700 BigBasket Now stores at the time of its analysis. By July 2026, the independent QuickCommerceMap dataset counted 5,625 stores across five major platforms. The implication for makhana brands is significant: an availability problem that might once have been visible at a city level can now occur at hundreds or thousands of individual fulfillment points. From 2020 to 2026, the analytical requirement has therefore shifted from checking whether a product is "available online" to understanding where, when, and at which SKU level it is available.
Brands can calculate:
This helps supply-chain and marketplace teams identify problems before they become widespread fulfillment issues.
Makhana Product Stock Availability Tracking provides a more granular view of consumer access. A category may appear well stocked at the aggregate level while individual variants repeatedly disappear from consumer-facing shelves.
For example, a brand might have four makhana variants:
| SKU | Pack | Store Coverage | Stockout Rate | Interpretation |
|---|---|---|---|---|
| Classic Roasted | 60g | High | Low | Core SKU |
| Peri Peri | 60g | Medium | Medium | Potential demand or replenishment issue |
| Himalayan Salt | 100g | Low | High | Assortment gap |
| Himalayan Salt | 80g | Medium | High | Requires investigation |
These metrics do not automatically prove consumer demand. A stockout can result from supply constraints, listing issues, replenishment delays, or platform assortment decisions. Therefore, availability data should be combined with price, reviews, search visibility, sales information where available, and competitor activity.
Makhana's growing commercial relevance makes SKU-level availability more important. APEDA estimates that India produces around 0.6 lakh MT of makhana, with approximately 0.23-0.25 lakh MT exported and the remainder consumed domestically. The agency identifies value-added formats such as roasted, flavored, organic, and functional variants as opportunities for higher-value growth. This expansion in formats means brands can no longer monitor only one generic "makhana" listing. The 2020-2026 period has seen increasing consumer interest in branded and differentiated snack formats, while quick-commerce infrastructure has expanded into additional cities and neighborhoods. A 2025 research report from Sprout Partners showed estimated dark-store counts for Blinkit rising from 364 in FY23 to 526 in FY24 and 1,251 in FY25E; Instamart increased from 421 to 523 and 1,004 respectively, while Zepto rose from 200 to 450 and 1,050. Although these are industry-level figures rather than makhana-specific numbers, they demonstrate why SKU-level availability measurement has become more complex. In 2026, a brand serving multiple pack sizes and flavors may need to track hundreds of store-SKU combinations to understand its actual digital shelf presence.
These questions convert availability monitoring into demand and operational analysis.
Quick commerce makhana availability monitoring allows brands to compare the consumer-facing shelf across platforms and locations. This is particularly useful because dark stores are not uniform warehouses. Each location can have its own assortment, inventory position, local demand profile, and replenishment cycle.
Makhana SKU Dark Store Availability Tracking can identify these differences through repeated observations.
| Location Type | SKU A | SKU B | SKU C | Competitive Signal |
|---|---|---|---|---|
| Metro cluster | Available | Available | OOS | Variant-level gap |
| Tier-1 cluster | Available | OOS | Available | Local replenishment issue |
| High-income zone | Available | Available | Available | Limited portfolio penetration |
| New market | OOS | OOS | OOS | Coverage gap |
This type of monitoring helps brands avoid treating a national average as a universal market condition.
Quick commerce evolved from an early-stage convenience model into a large distributed retail infrastructure. HSBC Global Research estimated that India's quick-commerce sector could reach roughly 5,000-5,500 dark stores by FY26, compared with about 1,800 operated collectively by major players in FY24. Independent mapping in July 2026 subsequently identified 5,625 stores across five major platforms and 408 cities. The geographic expansion changes the meaning of product availability. In 2020, a brand could often think in terms of marketplace or city coverage; by 2026, the relevant unit is increasingly the store-SKU-location combination. This is particularly important for a snack category such as makhana because consumer demand can differ by neighborhood, pack size, flavor, price point, and shopping occasion. Availability monitoring can expose geographic patterns that aggregate sales or warehouse reports may conceal. For example, if a 60g SKU is consistently available in one city but unavailable across another, the brand can investigate local distribution or replenishment rather than assuming weak nationwide demand. Similarly, if competitors maintain availability while a brand's SKU repeatedly disappears, the issue may require operational attention even when total inventory appears healthy.
Brands can create alerts for:
The result is an early-warning mechanism for marketplace operations.
Makhana dark store inventory data scraping for brands can create a structured dataset from publicly observable marketplace information, subject to applicable platform terms, technical constraints, and legal requirements. The objective is to convert fragmented product observations into a consistent historical dataset.
For a brand, the useful output is not simply a list of URLs. It is a normalized dataset that can answer business questions.
| Dataset Layer | Example Fields |
|---|---|
| Product | SKU, product name, variant |
| Brand | Brand name, manufacturer where displayed |
| Pack | Weight, count, format |
| Commercial | MRP/list price, selling price, discount |
| Location | City, area, dark-store/service location |
| Availability | In stock, unavailable, listing status |
| Competitive | Comparable brands and SKUs |
| Consumer | Rating, review count |
| Temporal | Date and collection time |
The data can then be normalized to create a consistent SKU identifier. Duplicate listings should be detected, pack sizes standardized, and product variants mapped to a common taxonomy.
The rapid expansion of dark-store infrastructure makes comprehensive collection increasingly challenging. Sprout Partners' 2025 research estimated nearly 2,000 dark stores would be added across leading quick-commerce operators in FY25, while JM Financial's September 2025 analysis showed major platforms already operating hundreds to more than 1,500 stores each. By July 2026, an independent mapping exercise counted 5,625 stores across five platforms. Meanwhile, APEDA reports approximately 0.6 lakh MT of annual Indian makhana production and identifies strong growth in branded and value-added formats. Together, these trends create a data-scale problem: more makhana SKUs are competing across more fulfillment locations. Manual checks become increasingly difficult to maintain because the number of possible store-SKU observations expands with every new city, variant, and platform. From 2020 to 2026, the need therefore shifted from periodic competitor checks toward automated, timestamped marketplace data collection. For brands, the objective should be a structured observation history that shows exactly where products appeared, disappeared, changed price, or changed availability.
The resulting dataset can support:
This creates a bridge between marketplace data and commercial decision-making.
Makhana Dark Store Stockout Monitoring helps businesses distinguish short-term availability interruptions from structural assortment changes.
This distinction matters. If a product disappears for two hours and returns, the operational response is different from a product that disappears from 40% of monitored stores for several days.
| KPI | Formula / Method | Business Meaning |
|---|---|---|
| Availability Rate | Available observations ÷ total observations | Overall digital shelf presence |
| Stockout Rate | OOS observations ÷ total observations | Frequency of unavailability |
| Store Coverage | Stores carrying SKU ÷ monitored stores | Distribution footprint |
| Recovery Time | Return time − stockout time | Replenishment speed |
| Competitive Availability | Competitor available during OOS | Substitution pressure |
| Assortment Change | Current SKUs − previous SKUs | Portfolio movement |
These metrics should be segmented by city, platform, SKU, pack size, and store cluster.
The expansion of dark-store networks means that stockouts can now occur at a much more granular level. In FY24, major quick-commerce companies collectively operated about 1,800 stores, according to reporting based on industry research. By FY25, research from Sprout Partners estimated 1,251 Blinkit, 1,004 Instamart, and 1,050 Zepto stores. By July 2026, QuickCommerceMap counted 1,955 Blinkit, 1,088 Zepto, 1,038 Swiggy Instamart, 880 Flipkart Minutes, and 664 BigBasket locations in its public snapshot. These figures illustrate why a single "in-stock" metric can become misleading. A SKU may be available in 80% of monitored stores but unavailable in a high-value cluster. Conversely, a product can show a national stockout rate that appears concerning while its core revenue locations remain consistently supplied. For makhana brands, this makes store-level monitoring particularly useful. A recurring observation system can distinguish between temporary operational stockouts, geographic distribution gaps, SKU rationalization, and competitor-driven assortment displacement. From 2020 to 2026, the growth of distributed fulfillment has therefore made stockout duration and location more informative than a simple yes/no availability field.
This prioritizes issues instead of overwhelming category managers with raw records.
Price & promotion intelligence adds commercial context to availability data. A stockout is not always a supply problem. It can coincide with a successful promotion, a price reduction, a bundle, increased visibility, or a competitor's campaign.
For example, if a 60g makhana SKU receives a major discount and then becomes unavailable across several high-volume locations, the sequence is worth investigating. It may indicate strong promotional demand or insufficient replenishment.
Makhana SKU Dark Store Availability Tracking can connect these events through timestamped observations.
| Event | Availability Signal | Possible Interpretation |
|---|---|---|
| Price reduction | Availability declines | Promotional demand |
| Promotion starts | Stockout frequency increases | Campaign-driven pressure |
| Competitor discount | Brand availability stable | Potential competitive response needed |
| Competitor OOS | Brand availability stable | Substitution opportunity |
| New SKU launch | Existing SKU declines | Portfolio shift |
| Pack-size change | Old SKU disappears | Assortment transition |
These are analytical hypotheses, not automatic conclusions. Sales or order-level data should be used where available to validate demand effects.
The wider market provides a strong reason to connect pricing, availability, and assortment. APEDA reports that the Indian makhana market has grown approximately 17-18% annually since 2021-22 through 2024-25, while identifying branded and value-added products as important growth areas. At the same time, quick-commerce networks expanded dramatically. QuickCommerceMap's July 2026 snapshot identified 5,625 dark stores across five platforms, while its city analysis found that Bangalore alone had 629 stores and Delhi 474. This creates more opportunities for regional price and promotion variation. A promotion that succeeds in one cluster may produce different inventory pressure elsewhere. From 2020 through 2026, the rise of fast delivery and differentiated snack formats therefore makes it increasingly important to interpret stock availability alongside commercial signals. For makhana brands, the analytical question is not simply "Was the SKU out of stock?" but "Did price, promotion, assortment, competitor availability, or location-specific conditions precede the stockout?" This approach can help teams separate operational issues from demand-related events and prioritize the most relevant actions.
A unified dashboard can display:
This gives brand teams a commercial explanation for inventory movements rather than treating availability as an isolated supply metric.
Actowiz Metrics can help FMCG brands, makhana manufacturers, distributors, retailers, and quick-commerce teams create a recurring marketplace intelligence workflow.
The objective is to capture relevant observations at SKU and location level, normalize them, validate the data, and convert them into decision-ready outputs.
Track selected makhana SKUs across relevant quick-commerce platforms and target markets.
Capture availability and assortment conditions across defined dark-store or service-location coverage.
Standardize product names, pack sizes, variants, and brand identifiers to prevent duplicate analysis.
Store timestamped observations to calculate availability trends and stockout duration.
Track comparable makhana brands, variants, pack sizes, prices, promotions, ratings, and availability.
Identify duplicate records, inconsistent product attributes, missing fields, and anomalous observations.
Deliver structured datasets that can feed BI dashboards and internal reporting workflows.
Availability & assortment tracking enables category teams to understand whether a SKU is consistently present across priority locations, where assortment gaps exist, and whether competitor products are filling those gaps.
Makhana SKU Dark Store Availability Tracking can then become part of a broader monitoring framework rather than a standalone stock report.
A useful dashboard can provide:
| Dashboard | Core Question |
|---|---|
| Availability | Where is each SKU currently available? |
| Stockout | Which stores repeatedly experience OOS events? |
| Assortment | Which variants are gaining or losing coverage? |
| Pricing | How does each SKU compare with competitors? |
| Promotion | Which products are receiving discounts? |
| Geography | Which cities or clusters have coverage gaps? |
| Competition | Which competitor SKUs remain available during stockouts? |
| Trend | How has availability changed over time? |
For a growing category, this transforms marketplace observation into an operational intelligence system.
Makhana SKU Dark Store Availability Tracking gives brands a way to understand the difference between having inventory somewhere in the supply chain and having the right SKU available to the consumer at the right location.
The distinction is becoming more important as India's makhana market expands and quick-commerce infrastructure grows. APEDA estimates annual Indian makhana production at around 0.6 lakh MT and reports market growth of approximately 17-18% annually since 2021-22 through 2024-25. Meanwhile, an independent July 2026 mapping study counted 5,625 dark stores across five major quick-commerce platforms.
For brands, the actionable framework is clear:
The result is a more precise view of digital shelf performance—one that connects inventory availability with the realities of quick-commerce fulfillment.
Ready to build a scalable marketplace intelligence workflow? Contact Actowiz Metrics to monitor makhana SKUs, dark-store availability, stockouts, pricing, promotions, and competitive assortment across India's fast-growing quick-commerce ecosystem!
Expert blogs, research reports and infographics — practical, data-driven reading across e-commerce and quick-commerce.
Most fields are optional — the more you share, the better your sample.
.webp "infographics")
.webp "infographics")